Report Overview
Inverter Market Size:
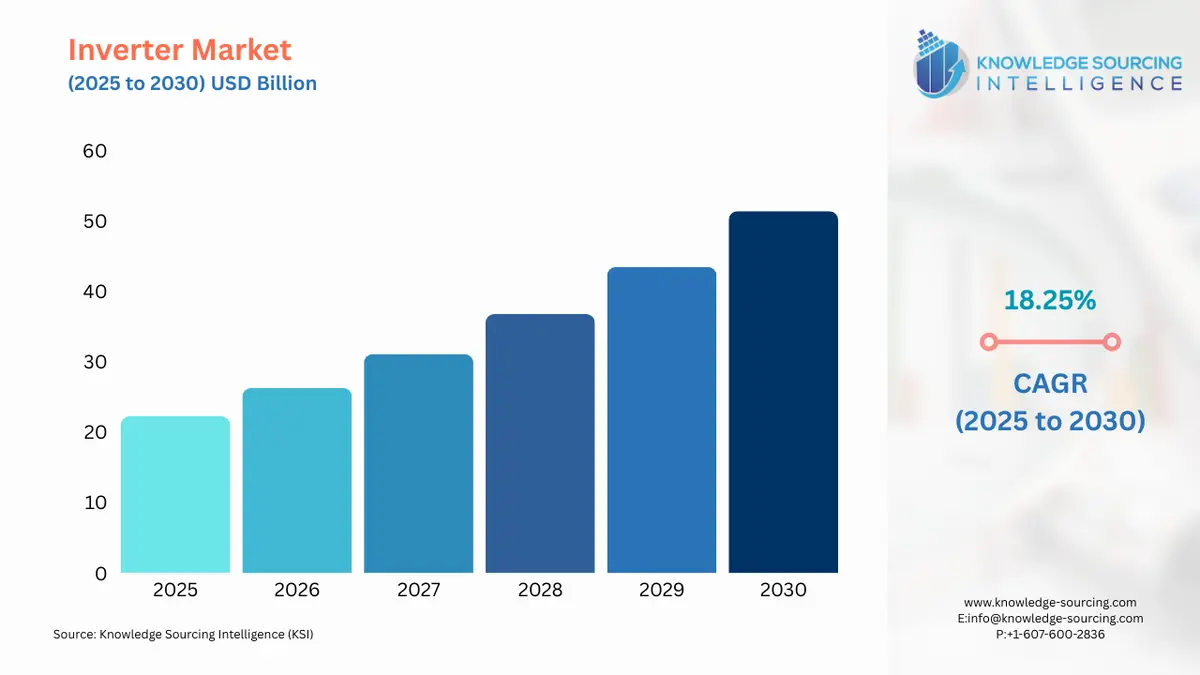
The global inverter market, with a 18.25% CAGR, is expected to grow to USD 51.393 billion in 2030 from USD 22.229 billion in 2025.
Electronic devices that can convert DC (Direct Current) to AC are known as inverters. They are also known as AC drives or VFDs (Alternating Current) and oversee regulating the speed and torque of electronic motors. Owing to the pressure being put on the limited energy resources by the expanding population and other environmental concerns, there is a need to store energy for a long period, which will lead to an increase in demand for inverters for residential and business uses. Furthermore, the demand for inverters is being fuelled by the widespread use of power backup systems in different manufacturing, power, and energy sectors. Such driving factors will boost the market growth during the forecasted period.
Inverter Market Drivers:
- The increasing energy demand is expected to boost the global inverter market growth.
The demand for electricity is expected to rise due to several important causes, including a growing population, as a major driver with fast industrialization, urbanization, and increased infrastructure construction which will require inverters to store the energy for future usage. The increase in electricity demand will boost the global inverter market at a rapid pace. According to IEA, between 2019 and 2030, it is predicted that India's energy demand would rise by about 35%, and during the next 20 years and India's urban population is projected to increase by an additional 270 million individuals. The U.S. Energy Information Administration (EIA) estimates that in 2021, the country used 97 quadrillion BTUs of basic energy in total. (British thermal units). This concludes that as energy consumption is going to rise the electricity demand that will require certain storage systems due to which the global inverters market is expected to grow at a rapid pace.
- The rising application in the transportation industry will boost the global inverter market growth
The need for transportation is expanding quickly which is increasing the usage of inverters used in buses and railways for storage and conversion of electricity. The railway’s transportation uses propulsion inverters which are the control mechanisms that change the power source of the train into a form that is appropriate for driving the traction motors. These inverters transform incoming DC power to AC power and regulate the supply's voltage and frequency by factors like the train's speed, among others. The increasing railway energy demand and government investment will boost the overall market growth. According to the U.S. Energy Information Administration (IEA) statement, by 2050, passenger and freight traffic will be more than double based on current trends. In March 2023, the Indian Ministry of Railways launched trains called the Bharat Gaurav which are being run to highlight India's magnificent historical sites and rich cultural legacy. According to the U.S. Energy Information Administration (IEA) statement in January 2019, the rail industry is the only method of transportation that has been extensively electrified today, with electric trains now accounting for 75% up from 60% 2000 of all passenger rail transport activity, this shows that increasing railway investment by government and electricity demand will boost the global inverter market growth.
Inverter Market Geographical Outlook:
- During the forecast period, the Asia-Pacific region will see a boost in market growth
The Asia Pacific region is anticipated to dominate the global inverter industry due to the increased production of motor and electric vehicles in countries like China, India, Australia, and Japan, which has fuelled demand for inverters. According to data from the International Organization of Motor Vehicle Manufacturers (OICA), the Asia Pacific region saw a 27% increase from 1,40,234 units in 2021 to 1,77,657 in 2022 while India saw a 111% increase in the production of buses and coaches from 2021 to 2022. This increasing production in transportation will boost the inverter market growth during the forecasted period.
Segmentation
- GLOBAL INVERTER MARKET BY TYPE
- Single Wave
- Sine Wave
- GLOBAL INVERTER MARKET BY LOAD
- Single Phase
- Three Phase
- GLOBAL INVERTER MARKET BY SOURCE TYPE
- Current Source
- Voltage Source
- GLOBAL INVERTER MARKET BY END-USER
- Residential
- Power & Energy
- Transportation
- Manufacturing
- Others
- GLOBAL INVERTER MARKET BY GEOGRAPHY
- North America
- USA
- Canada
- Mexico
- South America
- Brazil
- Argentina
- Others
- Europe
- Germany
- France
- United Kingdom
- Spain
- Others
- Middle East and Africa
- Saudi Arabia
- UAE
- Others
- Asia Pacific
- China
- India
- Japan
- South Korea
- Indonesia
- Thailand
- Others
- North America
Market Segmentation
By Type
By Load
By Source Type
By End-user
By Geography
Table of Contents
1. EXECUTIVE SUMMARY
2. MARKET SNAPSHOT
2.1. Market Overview
2.2. Market Definition
2.3. Scope of the Study
2.4. Market Segmentation
3. BUSINESS LANDSCAPE
3.1. Market Drivers
3.2. Market Restraints
3.3. Market Opportunities
3.4. Porter’s Five Forces Analysis
3.5. Industry Value Chain Analysis
3.6. Policies and Regulations
3.7. Strategic Recommendations
4. TECHNOLOGICAL OUTLOOK
5. GLOBAL INVERTER MARKET BY TYPE
5.1. Introduction
5.2. Single Wave
5.3. Sine Wave
6. GLOBAL INVERTER MARKET BY LOAD
6.1. Introduction
6.2. Single Phase
6.3. Three Phase
7. GLOBAL INVERTER MARKET BY SOURCE TYPE
7.1. Introduction
7.2. Current Source
7.3. Voltage Source
8. GLOBAL INVERTER MARKET BY END-USER
8.1. Introduction
8.2. Residential
8.3. Power & Energy
8.4. Transportation
8.5. Manufacturing
8.6. Others
9. GLOBAL INVERTER MARKET BY GEOGRAPHY
9.1. Introduction
9.2. North America
9.2.1. USA
9.2.2. Canada
9.2.3. Mexico
9.3. South America
9.3.1. Brazil
9.3.2. Argentina
9.3.3. Others
9.4. Europe
9.4.1. Germany
9.4.2. France
9.4.3. United Kingdom
9.4.4. Spain
9.4.5. Others
9.5. Middle East and Africa
9.5.1. Saudi Arabia
9.5.2. UAE
9.5.3. Others
9.6. Asia Pacific
9.6.1. China
9.6.2. India
9.6.3. Japan
9.6.4. South Korea
9.6.5. Indonesia
9.6.6. Thailand
9.6.7. Others
10. COMPETITIVE ENVIRONMENT AND ANALYSIS
10.1. Major Players and Strategy Analysis
10.2. Market Share Analysis
10.3. Mergers, Acquisitions, Agreements, and Collaborations
10.4. Competitive Dashboard
11. COMPANY PROFILES
11.1. Huawei Technologies Co. Ltd
11.2. Sungrow
11.3. Growatt New Energy
11.4. Goodwe
11.5. KACO New Energy
11.6. Fronius International GmbH
11.7. Enphase Energy
11.8. ABB Ltd
11.9. Schneider Electric
11.10. SMA Solar Technology
12. APPENDIX
12.1. Currency
12.2. Assumptions
12.3. Base and Forecast Years Timeline
12.4. Key benefits for the stakeholders
12.5. Research Methodology
12.6. Abbreviations
LIST OF FIGURES
LIST OF TABLES
Navigate
Trusted by the world's leading organizations


