Report Overview
Non-Powdered Surgical Glove Market Size:
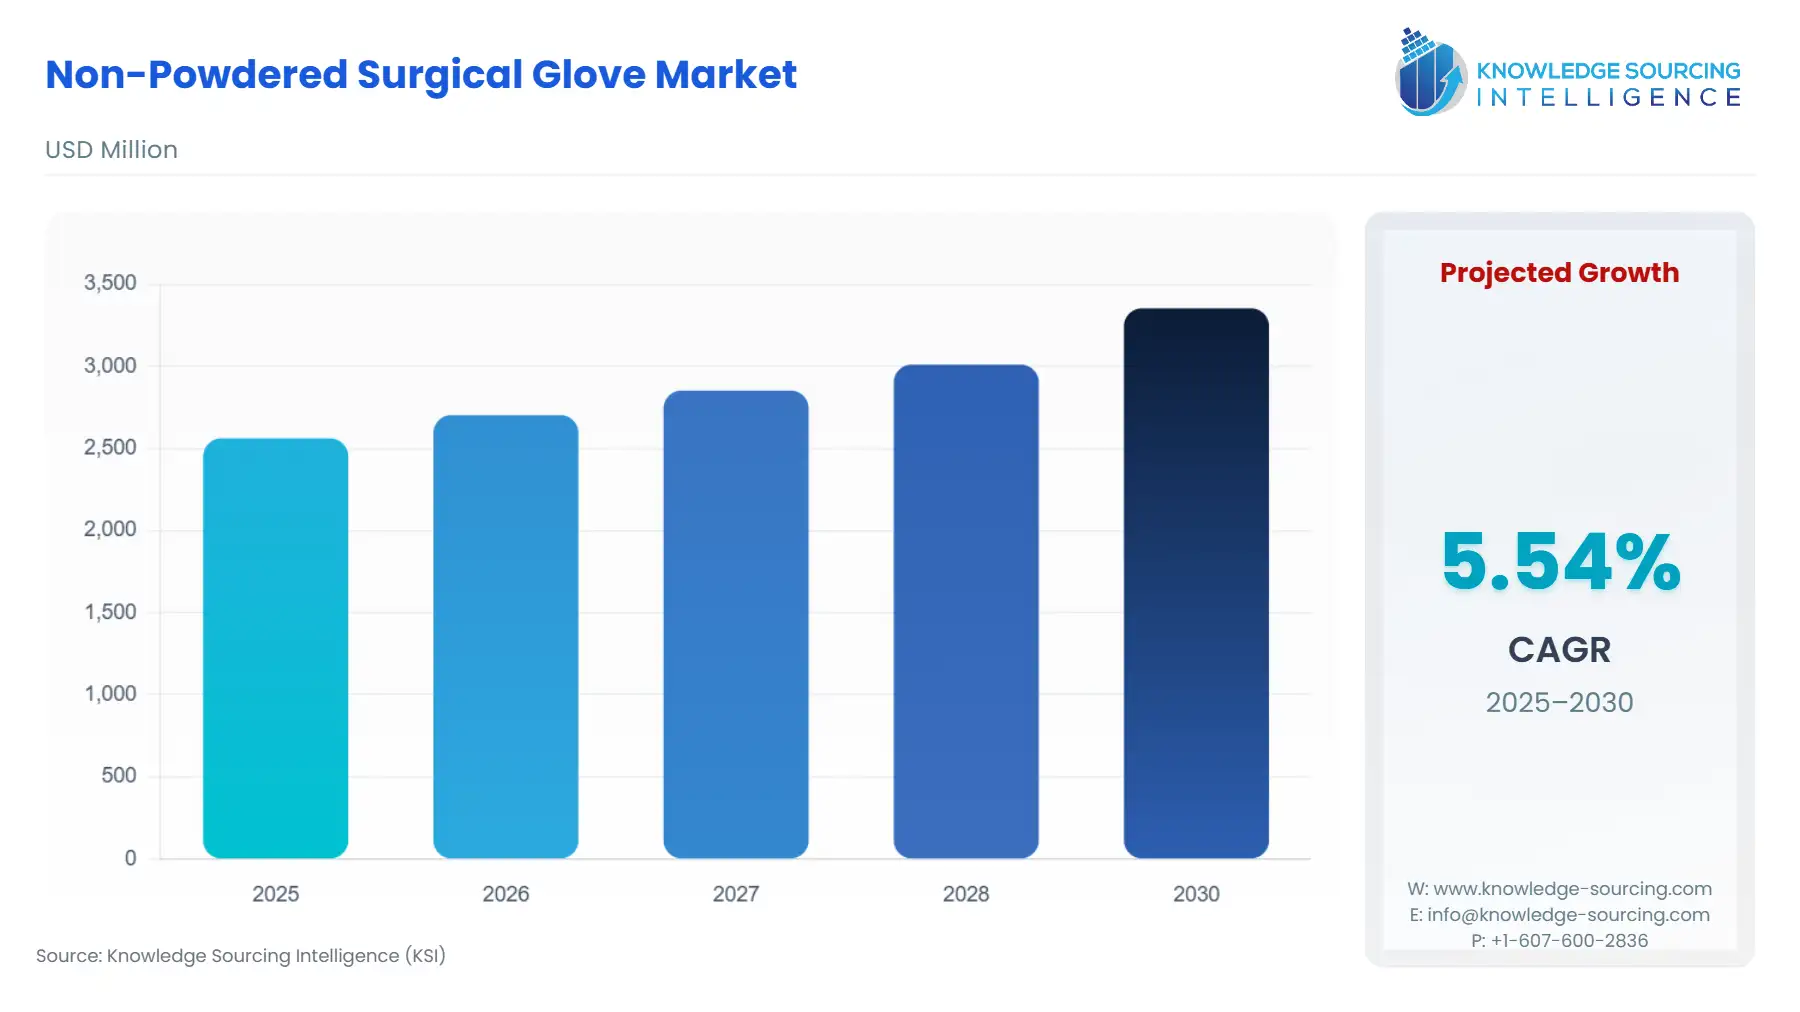
The Non-Powdered Surgical Glove Market is expected to grow from US$2,562.019 million in 2025 to US$3,354.326 million in 2030, at a CAGR of 5.54%.
Highlights:
- 1The mandated transition away from powdered surgical gloves, particularly driven by key regulatory actions like the 2017 U.S. Food and Drug Administration (FDA) ban, remains the singular most powerful growth catalyst for non-powdered alternatives globally.
- 2The rising prevalence of Type I (Natural Rubber Latex protein) and Type IV (chemical accelerators) allergies among healthcare workers propels the shift towards synthetic non-powdered gloves, specifically those made from Polyisoprene and Neoprene.
- 3Supply chain resilience is a critical competitive factor, as the manufacturing base remains highly concentrated in the Asia-Pacific region, creating exposure to geopolitical and raw material price volatility.
- 4Increasing procedural volume, driven by demographic trends such as aging populations and the corresponding rise in both major and minimally invasive surgeries, creates baseline growth in absolute glove demand.
The surgical glove market has undergone a fundamental transformation, shifting almost entirely to non-powdered variants following decisive regulatory action in major global jurisdictions. This regulatory imperative, aimed at mitigating serious patient and healthcare worker health risks associated with cornstarch powder—including respiratory allergic reactions and surgical complications like granuloma formation—has permanently restructured the demand landscape. The current market is defined by a rigorous pursuit of high-performance, hypoallergenic synthetic alternatives that offer the tactile sensitivity and fit characteristics historically provided by natural rubber latex (NRL), yet without its associated protein allergy risk.
Non-Powdered Surgical Glove Market Analysis
- Growth Drivers
The primary catalyst for the non-powdered market is regulatory compliance. The U.S. FDA ban on powdered surgical gloves significantly and immediately increased the demand for non-powdered NRL, Neoprene, Nitrile, and Polyisoprene substitutes, eliminating the previous segment and forcing a complete market conversion. Concurrently, the increasing clinical recognition of latex protein allergies creates a pull for high-performance synthetic alternatives. Healthcare institutions prioritize patient and staff safety, actively increasing procurement of non-latex gloves, which directly elevates demand for synthetic non-powdered polyisoprene and neoprene grades that replicate the fit and feel of NRL. Finally, the worldwide expansion of surgical procedures, including both complex major surgeries and the surging volume of minimal invasive surgeries, establishes a growing baseline consumption requirement for all types of non-powdered sterile gloves.
- Challenges and Opportunities
A major challenge is the price volatility of key raw materials, particularly natural rubber latex and petrochemical-derived synthetic polymers, which directly impacts manufacturers’ cost of goods sold and creates pricing pressures for end-users. This volatility creates a headwind for procurement budgets. The primary opportunity lies in advanced material innovation, specifically the development and commercialization of accelerator-free synthetic gloves (e.g., Nitrile and Neoprene). These products address Type IV chemical allergies (contact dermatitis) and drive demand by offering an advanced safety profile and fulfilling institutional imperatives for "skin-friendly" medical consumables. Furthermore, optimizing the logistics of the Asia-Pacific-centric supply chain to ensure consistent, reliable global supply represents a significant opportunity for market stabilization and competitive differentiation.
- Raw Material and Pricing Analysis
The non-powdered surgical glove market, being a physical product, is intrinsically linked to its raw material supply chain. Natural Rubber Latex (NRL) pricing is subject to agricultural factors, including climate and cultivation capacity, with its supply concentrated in Southeast Asia. Conversely, synthetic polymers like Polyisoprene, Neoprene, and Nitrile are petrochemical derivatives, tying their cost structure to global oil and gas prices. The increasing need for synthetic gloves, driven by allergy concerns, directly correlates with higher demand and, consequently, premium pricing for synthetic materials, notably Polyisoprene, which is significantly more expensive than NRL or Nitrile alternatives due to its complex synthesis process and superior performance characteristics. Manufacturers must manage this raw material cost differential while maintaining the strict quality and sterility requirements essential for surgical use.
- Supply Chain Analysis
The global supply chain for non-powdered surgical gloves is characterized by a significant geographic concentration of manufacturing capacity, with the Asia-Pacific region, particularly Malaysia, Thailand, and Indonesia, serving as the dominant global production hub. This concentration introduces considerable logistical complexity and dependency risk. The process, involving dipping, washing, chlorination/polymer coating (to ensure the non-powdered finish), and final sterilization (often via gamma irradiation), requires large, specialized facilities. Logistical complexity is compounded by the need to transport bulk raw materials to the dipping facilities and then move the final, sterile, high-volume products to global distribution centers. Any disruption—be it regulatory, geopolitical, or health-related—in this APAC manufacturing base poses an immediate and acute threat to global supply stability, which procurement experts continually monitor.
- Government Regulations
|
Jurisdiction |
Key Regulation / Agency |
Market Impact Analysis |
|
United States |
FDA Final Rule (2017) Banning Powdered Surgical Gloves |
This landmark ban entirely eliminated the powdered glove segment in the US, mandating a 100% shift to non-powdered surgical gloves. This regulatory action is the single most significant factor driving and sustaining demand for the non-powdered market. |
|
European Union |
Medical Device Regulation (MDR) (EU) 2017/745 |
The MDR imposes more stringent requirements for clinical evidence, risk classification, and post-market surveillance for all medical devices, including non-powdered surgical gloves. This increases compliance costs for manufacturers but reinforces product quality, thereby supporting demand for higher-quality, compliant non-powdered products in the region. |
|
Brazil |
National Health Surveillance Agency (ANVISA) |
ANVISA's rigorous standards and health surveillance activities focus on minimizing risks and promoting the use of high-quality medical products. The emphasis on patient safety, coupled with the management of risks associated with reprocessed or inferior-quality materials, increases the demand for certified, single-use, non-powdered surgical gloves. |
Non-Powdered Surgical Glove Market Segment Analysis
- Synthetic Polyisoprene Segment (By Material)
The synthetic Polyisoprene segment is a high-growth area driven exclusively by the imperative to mitigate the risk of Type I latex allergy without sacrificing critical surgical performance attributes. Polyisoprene is a synthetic polymer that chemically replicates the molecular structure of natural rubber latex (NRL), granting it superior properties like high elasticity, exceptional tear resistance, and, most crucially, tactile sensitivity. This 'second-skin' feel is non-negotiable for complex and long-duration major surgeries where minute tactile feedback is essential for the surgeon. This segment’s expansion is elevated in high-income healthcare settings and specialized surgical fields (e.g., neurosurgery, cardiovascular surgery) where the premium price of polyisoprene is justified by the clinical need for optimal dexterity and the absolute necessity of a non-latex, non-powdered environment. The market pull comes directly from surgical department heads and infection control teams seeking the highest safety and performance standards.
- By End-User: Hospitals Segment
Hospitals remain the bedrock of the non-powdered surgical glove market expansion due to the scale and complexity of procedures performed within their facilities. This end-user segment’s growth is driven by the sheer volume of both emergency and elective major surgeries, which mandates the use of sterile surgical-grade gloves. Furthermore, hospitals are subject to the strictest regulatory oversight (e.g., Joint Commission standards, national infection control protocols) and have the highest organizational exposure to litigation and staff health concerns related to allergic reactions. Therefore, hospital procurement policies are inherently risk-averse, favoring established, high-quality, and fully compliant non-powdered brands. Their market profile is characterized by large-volume, consolidated purchasing, where the focus is on a mixed portfolio—including cost-effective non-powdered NRL for general surgery and premium synthetics for specialized cases—all channeled through established distribution networks like Cardinal Health and Medline.
Non-Powdered Surgical Glove Market Geographical Analysis
- US Market Analysis (North America)
The US market is highly mature and dictated by two non-negotiable factors: the 2017 FDA powdered glove ban and an intense focus on cost-efficacy balanced with patient outcomes. The total surgical glove demand shifted entirely to the non-powdered segment post-2017. Current growth drivers include the increasing volume of specialized, high-acuity surgeries and the growing preference for advanced synthetic materials like polyisoprene to eliminate all latex-related risks. The market is also heavily influenced by Group Purchasing Organizations (GPOs), which aggregate hospital purchasing power, driving competitive pricing and standardization of non-powdered products across large healthcare systems. The US demand for non-powdered surgical gloves is characterized by high-volume procurement of premium-grade, compliance-heavy products.
- Brazil Market Analysis (South America)
The Brazilian market is characterized by a significant drive toward modernizing infection control practices within its public and private healthcare systems. The growing number of surgical procedures and the increasing stringency of national regulatory bodies, particularly ANVISA, which is committed to the safe management of medical devices, propel the growth. However, price sensitivity is a substantial factor, making cost-effective non-powdered NRL and non-powdered Nitrile gloves more prevalent than the high-cost polyisoprene alternatives. The demand structure is segmented, with private hospitals showing higher adoption of premium synthetic products, while the public sector focuses on securing large, cost-optimized tenders for certified non-powdered variants to meet basic safety requirements.
- Germany Market Analysis (Europe)
Germany’s surgical glove demand is underpinned by the country’s advanced healthcare infrastructure and its strict adherence to both national and the overarching EU Medical Device Regulation (MDR). The necessity is robust for non-powdered gloves that comply with all European standards (EN 455 series), with a strong focus on high-quality, durable products. A key local growth factor is the strong emphasis on occupational health and safety for healthcare personnel, which further accelerates the shift from non-powdered NRL to synthetic gloves, specifically those that are low in or free of chemical accelerators. Procurement decisions are often guided by detailed performance and allergy data, favoring established manufacturers with proven track records in quality and compliance.
- UAE Market Analysis (Middle East & Africa)
The United Arab Emirates market is driven by significant government investment in the healthcare sector, aiming to establish the region as a hub for medical tourism and specialized care. This commitment to world-class healthcare directly creates a premium demand profile for the highest-quality, non-powdered surgical gloves, mirroring the safety standards of North America and Europe. The market is concentrated in state-of-the-art private and public hospitals and specialized surgical centers. The presence of a highly diverse, multinational healthcare workforce also amplifies the focus on hypoallergenic synthetic options to mitigate occupational dermatitis and allergic reactions among staff. The UAE is a logistics gateway, and its demand is characterized by a reliance on international suppliers providing certified, non-powdered stock.
- China Market Analysis (Asia-Pacific)
China represents a massive, rapidly expanding market for non-powdered surgical gloves, driven by a national imperative to expand and modernize healthcare access across its vast population. The surge in surgical procedure volume, coupled with increasing domestic standards for infection control, is creating a sustained, high-volume demand. While domestic manufacturing capacity is rising, the sheer scale of healthcare infrastructure development creates immediate demand. The market is segmented, with high-tier, urban hospitals favoring premium international non-powdered synthetic brands, while lower-tier, regional hospitals focus on volume and cost, primarily driving demand for locally produced non-powdered NRL and Nitrile gloves. Improving domestic regulatory compliance and quality standards is a key long-term growth catalyst.
Non-Powdered Surgical Glove Market Competitive Environment and Analysis
The Non-Powdered Surgical Glove Market features a competitive landscape dominated by a few integrated global players, primarily concentrated in the Asia-Pacific region, which holds the key manufacturing capacity, and major global distribution specialists. Competition centers on material innovation (allergy-free), price-volume stability, and supply chain resilience.
- ANSELL LTD.
Ansell is strategically positioned as a premium player focusing on specialized, high-performance surgical and safety products. The company’s surgical glove portfolio includes flagship non-powdered brands like Gammex (Latex and Polyisoprene) and Encore (Latex and Neoprene), which directly target the high-acuity surgical segment. Ansell leverages its brand reputation for quality and technical innovation, particularly for its Polyisoprene offerings, to secure high-value contracts with major hospital groups and specialized surgical facilities globally, where its premium pricing is justified by superior fit and tactile sensitivity.
- Top Glove Corporation Bhd
Top Glove is positioned as the world’s largest manufacturer of gloves by volume, giving it a powerful, cost-competitive advantage. Its strategy is to command market share across all material and end-user segments by leveraging economies of scale derived from its extensive, geographically diverse manufacturing base, primarily in Malaysia. Its product line includes a vast array of non-powdered surgical gloves made from Natural Rubber Latex and various synthetics, providing a comprehensive, volume-based solution. The company’s core strategy is to secure large-scale national and institutional tenders where price and supply reliability are paramount purchasing criteria.
- Molnlycke Health Care AB
Molnlycke focuses on premium positioning through its proprietary Biogel non-powdered surgical glove line. The Biogel brand is known for its hydrogel-coated inner surface, designed for ease of donning and to minimize skin irritation, directly addressing the occupational health concerns of healthcare workers. The company’s strategy centers on value-added differentiation through clinical evidence and superior performance, particularly with its Biogel NeoDerm (Neoprene) and Biogel PI (Polyisoprene) products, which are designed to eliminate both NRL and chemical accelerator allergies. Its positioning is focused on European and North American hospital systems prioritizing high-quality, clinical-safety features and reliable supply from a European-based company.
Non-Powdered Surgical Glove Market Developments
- May 2025: Mölnlycke Health Care officially opened its new global headquarters in Gothenburg, Sweden. This move consolidates the company's leadership and R&D functions, signaling a strategic focus on driving sustainable healthcare innovation. For the non-powdered surgical glove market, this organizational consolidation supports a centralized, intensified focus on advanced material R&D, particularly in hypoallergenic and sustainable synthetic gloves.
- May 2025: Mölnlycke’s long-term net zero greenhouse gas (GHG) emission reduction targets were validated by the Science Based Targets initiative (SBTi). This development is a critical competitive factor, as major institutional buyers (e.g., European hospital systems) are increasingly incorporating sustainability and environmental, social, and governance (ESG) metrics into their procurement decisions. This validation strategically positions Mölnlycke's non-powdered glove portfolio favorably for sustainability-conscious procurement specialists.
Non-Powdered Surgical Glove Market Scope:
| Report Metric | Details |
|---|---|
| Total Market Size in 2026 | USD 2,562.019 million |
| Total Market Size in 2031 | USD 3,354.326 million |
| Growth Rate | 5.54% |
| Study Period | 2021 to 2031 |
| Historical Data | 2021 to 2024 |
| Base Year | 2025 |
| Forecast Period | 2026 – 2031 |
| Segmentation | Material, Surgical Procedures, Distribution Channel, Geography |
| Geographical Segmentation | North America, South America, Europe, Middle East and Africa, Asia Pacific |
| Companies |
|
Non-Powdered Surgical Glove Market Segmentation:
BY MATERIAL
- Natural Rubber Latex (NRL)
- Synthetic
- Polyisoprene
- Neoprene
- Nitrile
BY SURGICAL PROCEDURES
- Major Surgeries
- Minimal Invasive Surgeries
BY DISTRIBUTION CHANNEL
- Offline
- Online
BY END-USER
- Hospitals
- Ambulatory Surgical Centers
- Others
BY GEOGRAPHY
- North America
- USA
- Canada
- Mexico
- South America
- Brazil
- Argentina
- Others
- Europe
- Germany
- France
- United Kingdom
- Spain
- Others
- Middle East and Africa
- Saudi Arabia
- UAE
- Others
- Asia Pacific
- China
- India
- Japan
- South Korea
- Indonesia
- Thailand
- Others
Market Segmentation
By Material
By Surgical Procedures
By Distribution Channel
By End-user
By Geography
Table of Contents
1. EXECUTIVE SUMMARY
2. MARKET SNAPSHOT
2.1. Market Overview
2.2. Market Definition
2.3. Scope of the Study
2.4. Market Segmentation
3. BUSINESS LANDSCAPE
3.1. Market Drivers
3.2. Market Restraints
3.3. Market Opportunities
3.4. Porter’s Five Forces Analysis
3.5. Industry Value Chain Analysis
3.6. Policies and Regulations
3.7. Strategic Recommendations
4. TECHNOLOGICAL OUTLOOK
5. NON-POWDERED SURGICAL GLOVES MARKET BY MATERIAL
5.1. Introduction
5.2. Natural Rubber Latex (NRL)
5.3. Synthetic
5.3.1. Polyisoprene
5.3.2. Neoprene
5.3.3. Nitrile
6. NON-POWDERED SURGICAL GLOVES MARKET BY SURGICAL PROCEDURES
6.1. Introduction
6.2. Major Surgeries
6.3. Minimal Invasive Surgeries
7. NON-POWDERED SURGICAL GLOVES MARKET BY DISTRIBUTION CHANNEL
7.1. Introduction
7.2. Offline
7.3. Online
8. NON-POWDERED SURGICAL GLOVES MARKET BY END-USER
8.1. Introduction
8.2. Hospitals
8.3. Ambualtory Surgical Centers
8.4. Others
9. NON-POWDERED SURGICAL GLOVES MARKET BY GEOGRAPHY
9.1. Introduction
9.2. North America
9.2.1. USA
9.2.2. Canada
9.2.3. Mexico
9.3. South America
9.3.1. Brazil
9.3.2. Argentina
9.3.3. Others
9.4. Europe
9.4.1. Germany
9.4.2. France
9.4.3. United Kingdom
9.4.4. Spain
9.4.5. Others
9.5. Middle East and Africa
9.5.1. Saudi Arabia
9.5.2. UAE
9.5.3. Others
9.6. Asia Pacific
9.6.1. China
9.6.2. India
9.6.3. Japan
9.6.4. South Korea
9.6.5. Indonesia
9.6.6. Thailand
9.6.7. Others
10. COMPETITIVE ENVIRONMENT AND ANALYSIS
10.1. Major Players and Strategy Analysis
10.2. Market Share Analysis
10.3. Mergers, Acquisitions, Agreements, and Collaborations
10.4. Competitive Dashboard
11. COMPANY PROFILES
11.1. ANSELL LTD.
11.2. Cardinal Health Inc
11.3. Medline Industries, Inc.
11.4. Molnlycke Health Care AB
11.5. Top Glove Corporation Bhd
11.6. Sempermed USA, Inc.
11.7. Budev BV
11.8. Kossan Rubber Industries Bhd
12. APPENDIX
12.1. Currency
12.2. Assumptions
12.3. Base and Forecast Years Timeline
12.4. Key Benefits for the Stakeholders
12.5. Research Methodology
12.6. Abbreviations
Navigate
Trusted by the world's leading organizations


