
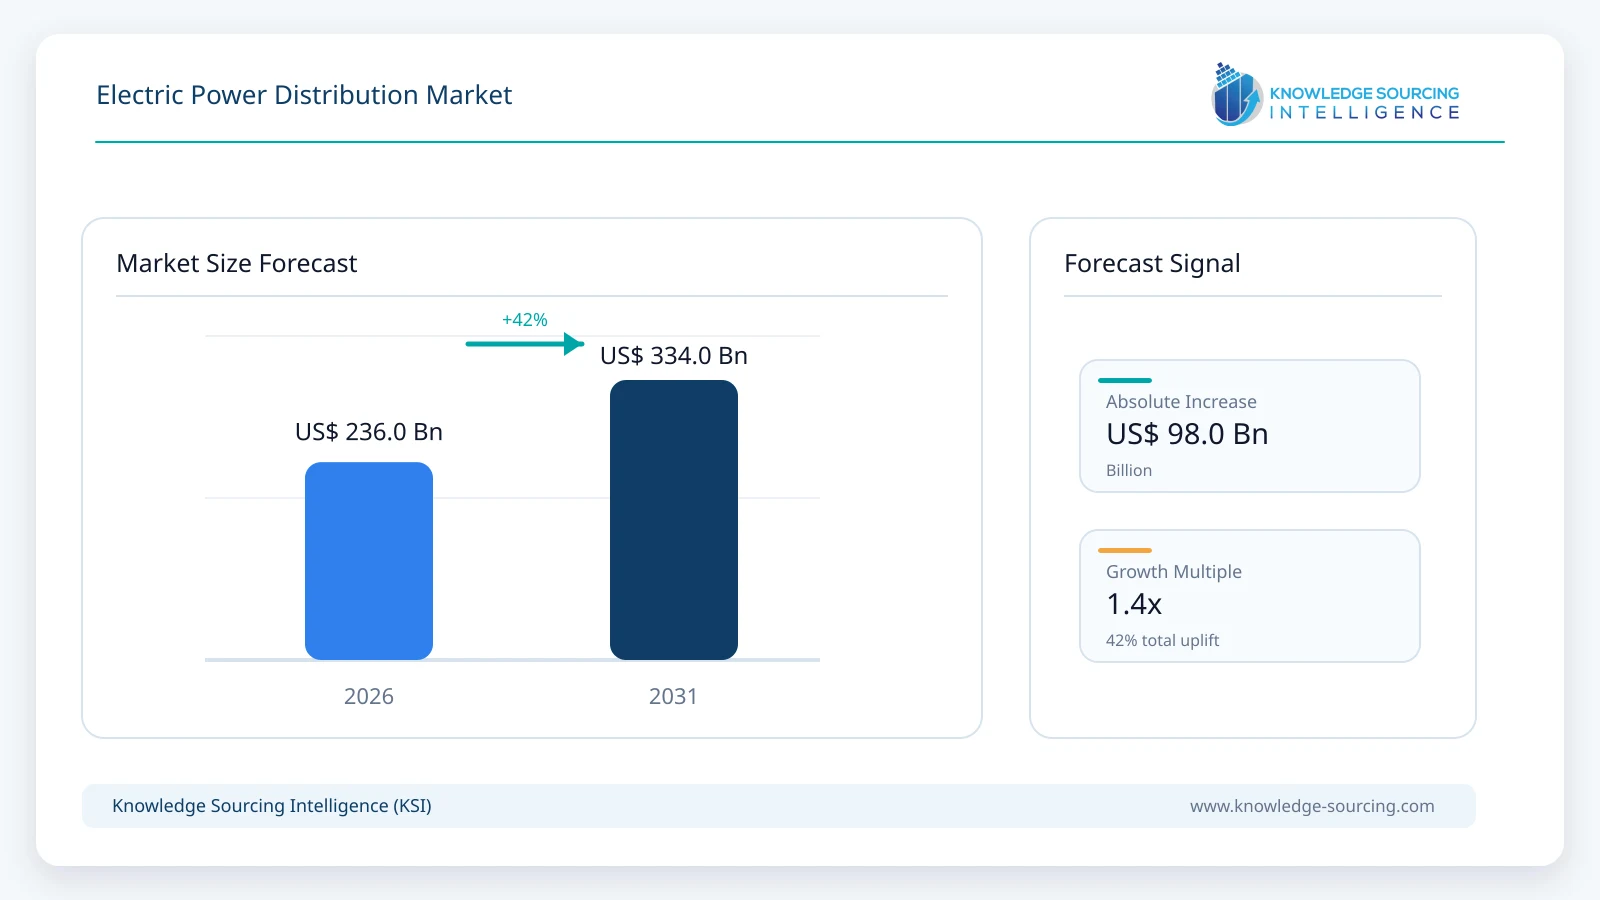
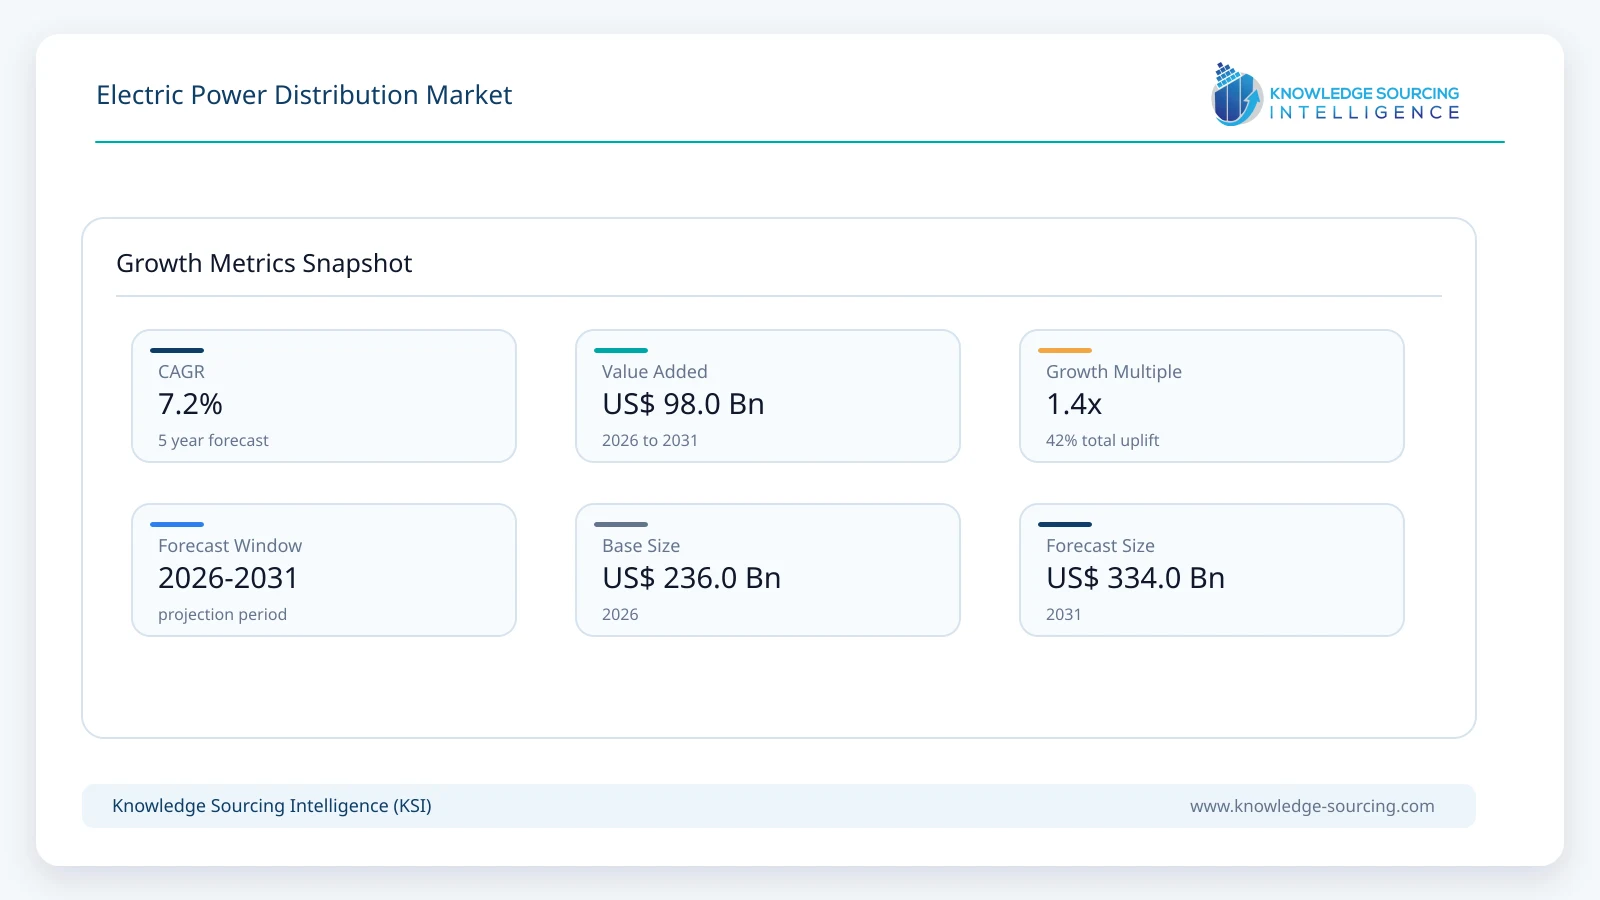
The electric power distribution market is estimated at USD 236.0 billion in 2026 and is forecast to reach approximately USD 334.0 billion in 2031, representing a CAGR of 7.2% during the forecast period.
Highlights:
- 1Distribution transformers represent an estimated USD 25.0 billion of 2026 spending, with procurement constrained by 12-30 month lead times in several utility markets.
- 2Medium-voltage infrastructure accounts for an estimated USD 132 billion, or about 56% of 2026 distribution spending, reflecting feeder, switchgear, protection and substation requirements.
- 3Asia Pacific represents approximately USD 101 billion, or 43% of the 2026 market, supported by China, India and Southeast Asian network expansion and modernization.
- 4Commercial and data-center connections account for approximately USD 68 billion of 2026 distribution spending as concentrated multi-megawatt loads accelerate substation and feeder upgrades.
The market measures annual spending on utility distribution infrastructure, distribution-grid equipment, automation, metering, software, and associated engineering and integration services. Electricity retail revenue, generation assets, bulk transmission infrastructure, and customer-owned internal building electrical systems are excluded.
Market Overview
Electric power distribution is becoming a capital-allocation and supply-chain market rather than a simple extension of electricity demand. Distribution networks sit between bulk transmission systems and end users, and the investment requirement now covers conventional assets such as feeders, underground cables, distribution substations, transformers, switchgear and protection equipment, as well as smart meters, field sensors, communications, distribution management systems and distributed-energy-resource controls. The market therefore reflects annual infrastructure and system spending rather than utility electricity sales.
Distribution networks account for a substantial share of global grid capital expenditure. The International Energy Agency places annual global grid investment at more than USD 400 billion in 2025 and indicates that spending must rise materially through 2030. In the United States, investor-owned electric companies invested USD 60.2 billion in distribution infrastructure in 2024 compared with USD 32.6 billion in transmission. Europe is similarly distribution-heavy, with approximately EUR 730 billion of distribution-network investment identified through 2040. These spending patterns support a large and expanding addressable market for transformers, cables, switchgear, substations, automation, metering and associated engineering services.
The commercial constraint is increasingly execution capacity. The IEA reports that more than 2,500 GW of renewable generation, storage and large-load projects are stalled in grid connection queues globally. Distribution utilities must simultaneously replace ageing assets, connect new distributed generation, absorb electric vehicles and heat pumps, reinforce feeders for concentrated commercial loads, and improve resilience against extreme weather. These pressures raise demand not only for more physical grid equipment but for automation and planning tools that increase usable capacity from existing networks.
Spending growth through 2031 is expected to remain above underlying electricity-demand growth because utilities are funding three requirements simultaneously: capacity expansion, replacement of ageing assets, and digital modernization. Near-term deployment is constrained by transformer, switchgear, and cable availability, permitting, and skilled labor, while multi-year grid plans, smart-meter programs, feeder reinforcement, DER interconnection work, and large-load connections sustain a strong project pipeline.
Electric Power Distribution Market Trends
Transformer Scarcity Converts Grid Expansion into a Procurement Problem
Distribution transformers have become one of the clearest examples of infrastructure demand running ahead of manufacturing capacity. The U.S. Department of Energy reports that lead times moved from approximately 3-6 months in 2019 to 12-30 months in 2023, with more recent industry work still focused on shortening delivery schedules and improving component availability. DOE also identified more than 80,000 distribution-transformer variants in use across U.S. utilities. The commercial implication is that utilities can no longer treat transformer procurement as a routine project-level purchase: specification harmonization, multi-year framework orders, safety-stock policies and dual sourcing are becoming grid-capacity tools because a missing transformer can delay a new connection even when civil work is complete.
Anticipatory Investment is Replacing the Traditional Connection-by-Connection Model
Distribution planning is moving away from purely reactive reinforcement. In June 2025, the European Commission issued guidance on anticipatory grid investment, with an estimated EUR 730 billion of distribution development required through 2040. The policy logic is commercially important: enlarging substations, installing spare cable ducts or reinforcing feeders before all customer requests materialize can lower the total cost and cycle time of repeated upgrades. It also changes utility procurement from isolated projects toward multi-year asset programs, improving visibility for transformer, switchgear, cable and automation suppliers but increasing regulatory scrutiny over who ultimately pays for unused or early capacity.
Large Loads Shift the Constraint from Annual Energy to Local Substation Capacity
Data centers illustrate why system-wide electricity growth can understate distribution investment requirements. Lawrence Berkeley National Laboratory estimates that data centers could account for 9.5%-15.3% of U.S. electricity use by 2030. Not every hyperscale facility connects at distribution voltage, but where large commercial loads land on utility distribution or sub-transmission networks they can force feeder reconductoring, new substations, transformer banks, protection changes and revised cost-allocation tariffs years before broad regional demand would have required the same work. This concentration effect makes location-specific load forecasting more valuable than national electricity-demand growth alone.
Smart Metering is Moving from Device Procurement toward Lifecycle Service Models
India’s Revamped Distribution Sector Scheme shows how distribution procurement models are changing. As of March 2026, distribution infrastructure and smart-metering works worth INR 2.83 lakh crore had been sanctioned, including INR 1.53 lakh crore for loss-reduction infrastructure and INR 1.31 lakh crore for smart metering. The program covers consumer meters, distribution-transformer meters and feeder meters, while Advanced Metering Infrastructure Service Providers are responsible for supply, maintenance and operation under a total-expenditure model. This shifts value from a one-time meter sale toward communications, head-end systems, meter-data management, field service and multi-year operating performance.
DER Interconnection is Turning Upgrade Cost Allocation into a Market Design Issue
The physical grid is only one side of the investment problem. Berkeley Lab’s 2026 interconnection work covers 188 utilities in 24 U.S. states and documents growing attention to how distribution-system upgrades are triggered and paid for. Traditional “first cost-causer pays” rules can force one distributed-energy project to fund infrastructure that also benefits later customers. States are testing group studies, pro-rata sharing and standardized charges. For suppliers and engineering firms, the consequence is a broader pipeline of proactive hosting-capacity upgrades rather than project-by-project reinforcement; for utilities and regulators, the challenge is recovering costs without suppressing new connections.
Segment Analysis
By Investment Category - Distribution Transformers
Distribution transformers are estimated at approximately USD 25.0 billion in 2026, representing about 11% of total electric power distribution spending. The segment is a major capital category because every new or reinforced feeder ultimately requires voltage transformation close to load, while replacement demand is tied to a large ageing installed base. Production depends on electrical steel, copper or aluminum windings, bushings, tap changers, insulation systems and lengthy factory testing. Buyers are responding by standardizing specifications, reserving manufacturing slots earlier and increasing inventories of common ratings, making available transformer capacity itself a competitive advantage for utilities and suppliers.
By Voltage Level - Medium Voltage
Medium-voltage infrastructure is estimated at approximately USD 132 billion in 2026, or about 56% of market value. It forms the operational backbone between primary substations and low-voltage customer networks and includes feeders, ring-main units, reclosers, switchgear, protection relays, distribution transformers and increasingly digital sensors. Distributed generation, storage, EV charging and large commercial loads are altering feeder-level power flows, so utilities are combining physical reinforcement with protection upgrades, automated switching and Volt-VAR optimization rather than simply adding conductor capacity.
By Network Architecture - Radial Networks
Radial networks account for an estimated USD 146 billion of 2026 spending, equivalent to roughly 62% of the market, reflecting their dominant installed base across utility distribution systems. They are comparatively simple to design, protect and operate and require fewer switching assets than meshed alternatives. Their weakness is that a single upstream fault can interrupt all downstream customers unless sectionalizing, alternate feeds or automated restoration are added. This makes radial networks a large addressable base for reclosers, fault indicators, feeder automation and FLISR systems that improve reliability without converting the entire network into a fully meshed topology.
By Construction - Overhead Distribution
Overhead distribution represents an estimated USD 137 billion in 2026, or approximately 58% of global distribution spending. It remains the dominant construction format across large parts of North America, Asia Pacific, Latin America and emerging markets because installed cost is materially lower than underground construction and faults can be accessed quickly. Spending is increasingly shifting from simple line extension toward reconductoring, covered conductors, stronger poles, sectionalizing devices and wildfire or storm hardening. Underground systems capture a larger share of new investment in dense urban areas where reliability, land and aesthetic constraints justify substantially higher civil-works costs.
By Demand Segment - Commercial and Data-Center Loads
Commercial and data-center loads account for an estimated USD 68 billion, or about 29% of 2026 distribution spending. The segment is becoming more capital intensive because data centers, logistics hubs, semiconductor facilities and electrified campuses can add tens or hundreds of megawatts at individual locations. The investment requirement is therefore not proportional to customer count: a small number of large connections can require dedicated substations, redundant feeders, larger transformer banks and revised protection settings, creating a concentrated order pipeline for medium-voltage equipment and engineering services.
By Geography - Asia Pacific
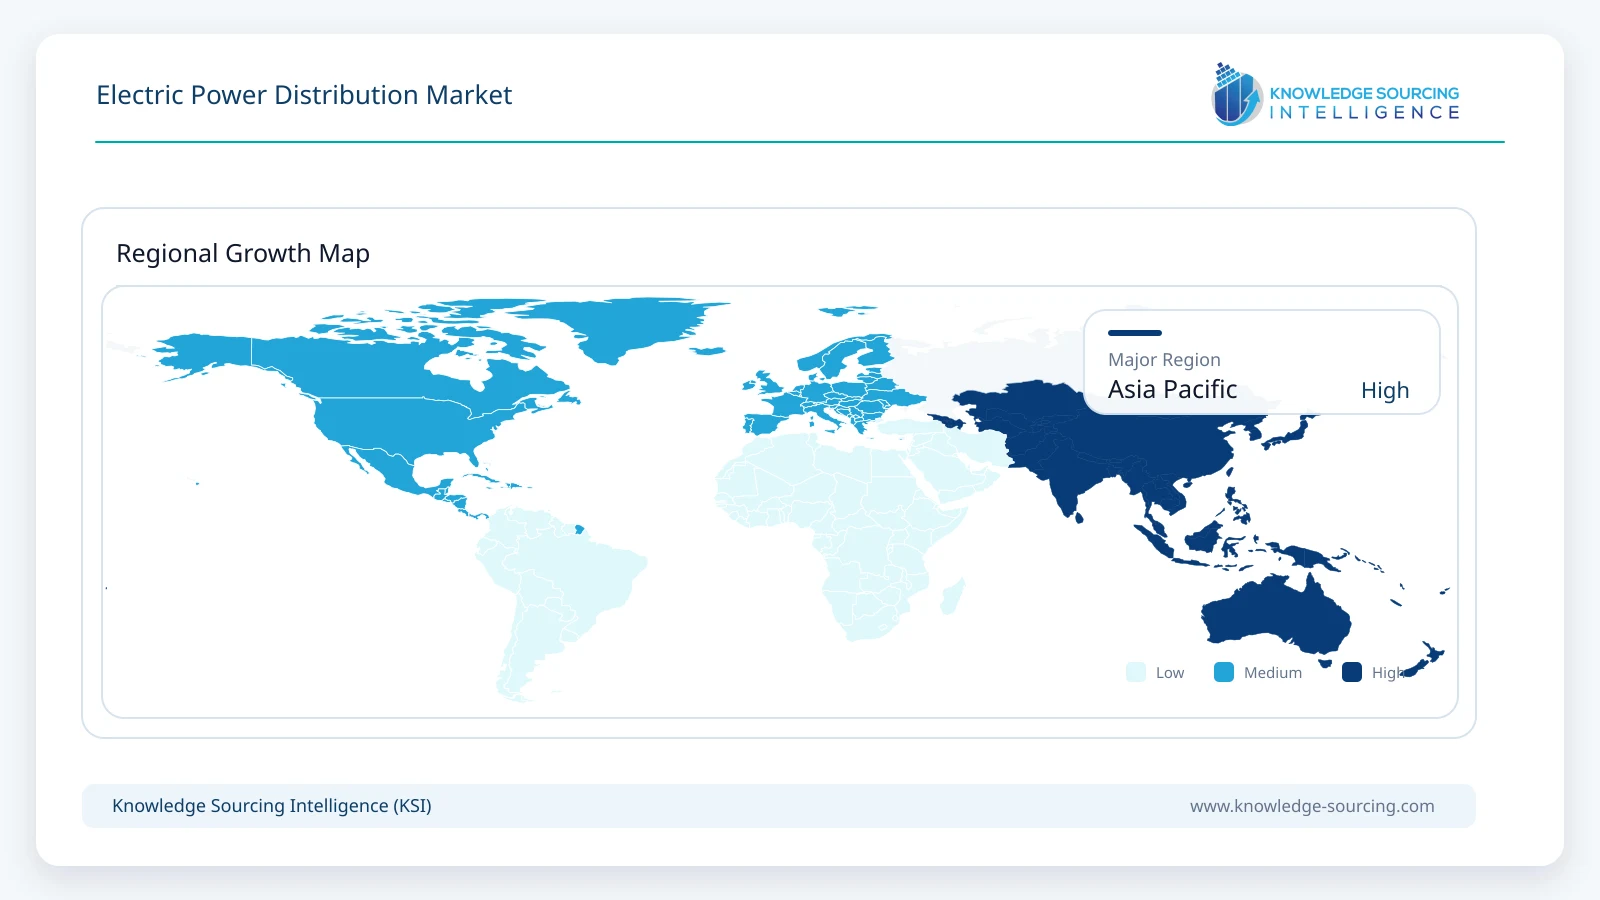
Asia Pacific represents an estimated USD 101 billion in 2026, or approximately 43% of global electric power distribution spending. The region combines rapid electricity-demand growth with urban expansion, manufacturing electrification, renewable integration and large-scale modernization programs. India alone has sanctioned INR 2.83 lakh crore of RDSS distribution and smart-meter works, while China remains the world’s largest electricity system and a strategic manufacturing base for transformers and grid equipment. Regional spending also includes resilience upgrades in Japan, renewable and storage integration in Australia, and network expansion across Southeast Asia.
Market Drivers
Electrification of transport, heating, industrial processes and digital infrastructure increases feeder and substation loading.
Distributed solar and storage require bidirectional power-flow management, protection changes and hosting-capacity upgrades.
Ageing networks in developed markets require replacement alongside new capacity and resilience investment.
Smart meters, sensors and distribution automation increase visibility and improve utilization of existing grid assets.
Government-backed modernization programs are converting long-term grid requirements into funded utility procurement pipelines.
Market Restraints
Transformer, switchgear, cable and electrical-steel supply constraints extend project schedules and raise procurement risk.
Weak utility balance sheets and affordability constraints limit investment in several emerging electricity markets.
Permitting, rights-of-way and skilled-workforce shortages slow distribution projects even where funding is approved.
Regulatory cost-recovery rules can delay anticipatory investment when beneficiaries and timing remain uncertain.
Utility-specific technical standards and large product-variant counts reduce manufacturing scale and complicate inventory planning.
Competitive Environment
Competition is centered on suppliers that capture distribution capital expenditure rather than on utilities that operate the networks. The addressable supplier pool spans transformers, medium-voltage switchgear, protection and control, cables and conductors, smart meters, field sensors, distribution automation, ADMS/DERMS software, engineering and lifecycle services. Scale matters because utilities increasingly want multi-year capacity commitments and local service coverage, but specialized vendors can compete where automation, protection, underground switching or grid software requires deep application expertise.
Manufacturing investment is becoming a competitive differentiator. In July 2026, Siemens announced EUR 300 million of German investment to expand high-efficiency power-distribution and switchgear production, including capacity serving data centers and e-mobility. ABB announced approximately USD 200 million across European medium-voltage factories in May 2026, while Hitachi Energy committed USD 528 million to a new U.S. transformer facility in September 2026 and USD 300 million to transformer and component manufacturing in China in August. These programs are not merely capacity additions: they are attempts to secure delivery slots, localize critical supply chains and reduce lead times in a market where equipment availability can determine when a customer is connected.
Digital differentiation is also increasing. GE Vernova introduced GridBeats APS in February 2026 to consolidate automation and protection functions on a common platform, while Schneider Electric is positioning integrated digital-grid platforms alongside medium-voltage equipment. Utilities are therefore evaluating vendors across hardware availability, interoperability, cyber security, lifecycle software support and engineering execution rather than equipment price alone.
Recent Developments
September 2026: Hitachi Energy announced a USD 528 million transformer manufacturing facility in Mississippi, more than doubling local production capacity.
August 2026: Hitachi Energy announced a USD 300 million investment in China to expand transformer and component manufacturing capacity.
July 2026: Siemens announced EUR 300 million of investment in Germany to expand power-distribution and switchgear production for data centers, e-mobility and industry.
May 2026: ABB announced approximately USD 200 million across European medium-voltage facilities, including SF6-free switchgear and grid-automation capacity.
March 2026: India reported INR 2.83 lakh crore of sanctioned RDSS distribution infrastructure and smart-metering works.
February 2026: GE Vernova launched GridBeats APS, a software-defined automation and protection platform for modern substations.
Market Outlook
Electric power distribution is moving from a replacement-driven utility market toward a capacity, resilience and digital-control market. The strongest spending opportunities through 2031 are likely to occur where physical bottlenecks and operating complexity overlap: transformer supply, medium-voltage reinforcement, distribution automation, smart metering, DER integration and large-load connections. The principal commercial risk is not lack of demand, but whether utilities, regulators, manufacturers and skilled contractors can convert approved investment into commissioned assets quickly enough.
The market should therefore expand faster than underlying electricity consumption. Utilities are paying simultaneously for growth, modernization and risk reduction, while suppliers with available manufacturing capacity and interoperable digital platforms gain pricing and scheduling leverage. Standardization of equipment specifications, anticipatory planning and service-based procurement models are expected to determine how much of the identified grid-investment requirement can actually be delivered by 2031.
Electric Power Distribution Market Scope
| Report Metric | Details |
|---|---|
| Total Market Size in 2026 | USD 236.0 billion |
| Total Market Size in 2031 | USD 334.0 billion |
| Forecast Unit | Billion |
| Growth Rate | 7.2% |
| Study Period | 2021 to 2031 |
| Historical Data | 2021 to 2024 |
| Base Year | 2025 |
| Forecast Period | 2026 – 2031 |
| Segmentation | Investment Category, Voltage Level, Network Architecture, Construction, Demand Segment, Geography |
| Companies |
|
| Customization Scope | 15% Free Customization included with purchase — Request Custom Breakdown → |
| Sample & Data Access | PDF Sample, Excel Databook & Analyst Briefing — Download Free Sample → |
Market Segmentation
By Investment Category
Distribution Lines and Cables
Distribution Transformers
Switchgear, Protection and Control
Distribution Substations
Smart Meters and Field Sensors
Distribution Automation and Software
Engineering, Integration and Lifecycle Services
By Voltage Level
Low Voltage
Medium Voltage
By Network Architecture
Radial
Ring / Loop
Interconnected / Meshed
By Construction
Overhead Distribution
Underground Distribution
By Demand Segment
Residential
Commercial and Data Centers
Industrial
By Geography
North America
United States
Canada
Mexico
South America
Brazil
Argentina
Others
Europe
Germany
France
United Kingdom
Italy
Spain
Others
Middle East and Africa
Saudi Arabia
UAE
South Africa
Others
Asia Pacific
China
India
Japan
South Korea
Australia
Indonesia
Others
Table of Contents
1. INTRODUCTION
1.1. Market Overview
1.2. Market Definition and Scope
1.3. Revenue Reference Point
1.4. Currency and Assumptions
2. RESEARCH METHODOLOGY
2.1. Secondary Research
2.2. Utility Investment and Supplier Validation
2.3. Market Estimation and Grid-Capex Triangulation
3. EXECUTIVE SUMMARY
3.1. Key Findings
3.2. Global Market Size, 2026-2031
4. MARKET DYNAMICS
4.1. Market Drivers
4.2. Market Restraints
4.3. Transformer and Switchgear Supply Constraints
4.4. Utility Capital Planning and Cost Recovery
5. ELECTRIC POWER DISTRIBUTION MARKET BY INVESTMENT CATEGORY
5.1. Distribution Lines and Cables
5.2. Distribution Transformers
5.3. Switchgear, Protection and Control
5.4. Distribution Substations
5.5. Smart Meters and Field Sensors
5.6. Distribution Automation and Software
5.7. Engineering, Integration and Lifecycle Services
6. ELECTRIC POWER DISTRIBUTION MARKET BY VOLTAGE LEVEL
6.1. Low Voltage
6.2. Medium Voltage
7. ELECTRIC POWER DISTRIBUTION MARKET BY NETWORK ARCHITECTURE
7.1. Radial
7.2. Ring / Loop
7.3. Interconnected / Meshed
8. ELECTRIC POWER DISTRIBUTION MARKET BY CONSTRUCTION
8.1. Overhead Distribution
8.2. Underground Distribution
9. ELECTRIC POWER DISTRIBUTION MARKET BY DEMAND SEGMENT
9.1. Residential
9.2. Commercial and Data Centers
9.3. Industrial
10. ELECTRIC POWER DISTRIBUTION MARKET BY GEOGRAPHY
10.1. North America
10.1.1. United States
10.1.2. Canada
10.1.3. Mexico
10.2. South America
10.2.1. Brazil
10.2.2. Argentina
10.2.3. Others
10.3. Europe
10.3.1. Germany
10.3.2. France
10.3.3. United Kingdom
10.3.4. Italy
10.3.5. Spain
10.3.6. Others
10.4. Middle East and Africa
10.4.1. Saudi Arabia
10.4.2. UAE
10.4.3. South Africa
10.4.4. Others
10.5. Asia Pacific
10.5.1. China
10.5.2. India
10.5.3. Japan
10.5.4. South Korea
10.5.5. Australia
10.5.6. Indonesia
10.5.7. Others
11. COMPETITIVE ENVIRONMENT AND ANALYSIS
11.1. Transformer and Switchgear Capacity
11.2. Distribution Automation and Digital Platforms
11.3. Local Manufacturing and Supply-Chain Strategy
11.4. Strategic Developments
12. COMPANY PROFILES
12.1. Hitachi Energy Ltd.
12.2. Siemens AG
12.3. Schneider Electric SE
12.4. ABB Ltd.
12.5. Eaton Corporation plc
12.6. GE Vernova Inc.
12.7. Mitsubishi Electric Corporation
12.8. Toshiba Energy Systems & Solutions Corporation
12.9. S&C Electric Company
12.10. Hubbell Incorporated
12.11. HD Hyundai Electric Co., Ltd.
12.12. LS ELECTRIC Co., Ltd.
12.13. CHINT Group
12.14. Lucy Electric
12.15. G&W Electric Co.
12.16. Ormazabal
12.17. Arteche Group
12.18. CG Power and Industrial Solutions Limited
13. APPENDIX
13.1. Currency
13.2. Assumptions
13.3. Market Definition and Exclusions
13.4. Base and Forecast Years
13.5. Research Methodology
13.6. Abbreviations





Frequently asked questions
What is the forecast for the Electric Power Distribution Market by 2031?
The Electric Power Distribution Market is forecast to reach approximately USD 334.0 billion by 2031.
What is the projected CAGR for the Electric Power Distribution Market?
The Electric Power Distribution Market is projected to grow at a 7.2% CAGR from 2026 to 2031.
Which region accounts for the largest share of the market in 2026?
Asia Pacific represents 43% of the 2026 market, or USD 101 billion.
What infrastructure type accounts for the largest distribution spending?
Medium-voltage infrastructure accounts for 56% of 2026 distribution spending.
Which concentrated loads are accelerating distribution infrastructure upgrades?
Commercial and data-center connections accelerate substation and feeder upgrades.
What does the Electric Power Distribution Market scope include?
Infrastructure, equipment, automation, metering, software, and associated services are included.
Cite this report
Knowledge Sourcing Intelligence. (Oct 2026). Electric Power Distribution Market - Strategic Insights and Forecasts (2026-2031). https://www.knowledge-sourcing.com/report/electric-power-distribution-market