Report Overview
Energy Harvesting Devices Market Highlights
Energy Harvesting Devices Market Size:
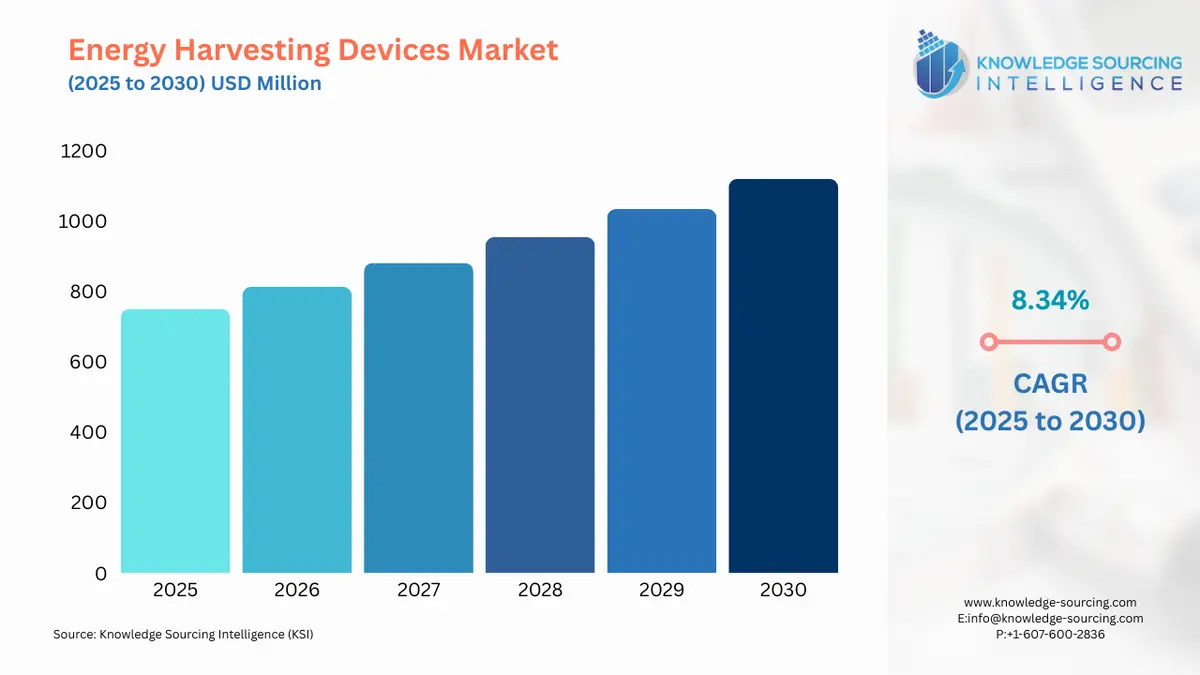
Energy Harvesting Devices Market is forecasted to rise at a 8.34% CAGR, reaching USD 1,119.689 million by 2030 from USD 750.194 million in 2025.
Energy harvesting devices refer to tools that assist in acquiring energy from sources outside of a system, such as solar, thermal, kinetic, etc. This energy is then stored and utilized by small, independent wireless devices like wearable electronics, wireless sensor networks, and condition monitoring systems. These devices are also known as ambient power devices, energy scavenging devices, or bio batteries. Energy harvesters are predominantly deployed in low-energy electronics.

Key determinants such as the widespread adoption of IoT-enabled devices in building and home automation, rapid urbanization, the rising demand for dependable, safe, and long-lasting systems, and the rising popularity of green energy are all positively impacting the global market. Favorable government incentives & policies along with the booming consumer electronics industry are also driving the growth of energy harvesting devices during the analysis period.
However, the damage caused to energy harvesting by their surrounding along with the limitations of remotely installed networking modules is obstructing the growth of the global market for energy harvesting devices during the analysis period.
Energy Harvesting Devices Market Growth Drivers:
- During the anticipation period, the rising demand for wearable technology will support the growth of the global energy harvesting devices market during the projection period.
The use of energy-harvesting devices has become extremely popular in low-energy consumer electronic devices such as wearables (smartwatches, automatic watches, fitness bands, etc). Wearable energy harvesting devices extract energy from the human body such as body heat, blood pressure, and movements. Therefore growing demand for wearable technology will propel market demand during the analysis period. According to a survey conducted by the National Institute of Health, 30 percent of Americans use wearable trackers for healthcare purposes. Around 50% of consumers utilize this technology every day. 88 percent of those surveyed claimed that fitness band has assisted them in achieving their fitness objectives, with regular exercise ranking top, and increasing steps coming in second. According to the company data, American fitness tracking company Fitbit has 28 million active users in 2021. As of 2021, Fitbit has 111 million registered users, an increase of 13 million over the previous year. The company sold 10.6 million fitness devices such as bands in 2021. In Q2 2020, Xiaomi sold 13 million units of its MI fitness band This data demonstrates the growing demand for fitness bands globally.
Rising R&D operations are underway to capitalize on the growing demand for wearable technology. For instance, In November 2022, a group of scientists at Osaka Metropolitan University developed a novel energy harvesting device. The piezoelectric vibration energy harvester is a revolutionary technique that potentially powers tiny wearable gadgets. It increases the electrical power produced by human walking motion by around 90 times. The harvester is just around 2 cm in diameter and has a U-shaped metal part called a dynamic magnifier.
Energy Harvesting Devices Market Geographical Outlook:
- North America is anticipated to hold a significant amount of the energy harvesting market share during the forecast period.
North American region is anticipated to hold a significant market share in energy harvesting devices. This region will witness high growth during the forecast period owing to rapid technological advancements and rising R&D operations. The growing adoption of renewable energy is also propelling demand in this region. For instance, The United States Energy Information Agency says that around 12.4 percent of the nation's total primary energy consumption in 2021 came from renewable sources. Around 19.8 percent of the total power produced at the utility-scale came from renewable sources. Moreover, between 2021 and 2025, it is anticipated that the United States and the European Union would install more than 125 GW of solar PV annually. Market expansion has also been facilitated by government initiatives to minimize energy emissions from public buildings. For instance, U.S. General Services Administration and IBM formed a collaboration for the installation of sophisticated and smart building technologies in 50 of the federal government's most energy-intensive buildings. The energy harvesting devices market dynamics have also changed as a result of the adoption of the smart cities initiative in the North American region. Prime markets in the North American region are the United States, Canada, and Mexico.
Segmentation:
- ENERGY HARVESTING DEVICES MARKET BY ENERGY SOURCE
- Natural Energy
- Solar
- Wind
- Hydro
- Mechanical Energy
- Natural Energy
- ENERGY HARVESTING DEVICES MARKET BY TECHNOLOGY
- ENERGY HARVESTING DEVICES MARKET BY END-USER
- Agriculture
- Consumer Electronics
- Automotive
- Aerospace
- Industrial
- Others
- ENERGY HARVESTING DEVICES MARKET BY GEOGRAPHY
- North America
- USA
- Canada
- Mexico
- South America
- Brazil
- Argentina
- Others
- Europe
- Germany
- France
- United Kingdom
- Spain
- Italy
- Others
- Middle East and Africa
- Saudi Arabia
- UAE
- Israel
- Others
- Asia Pacific
- China
- India
- Japan
- South Korea
- Indonesia
- Thailand
- Taiwan
- Others
- North America