
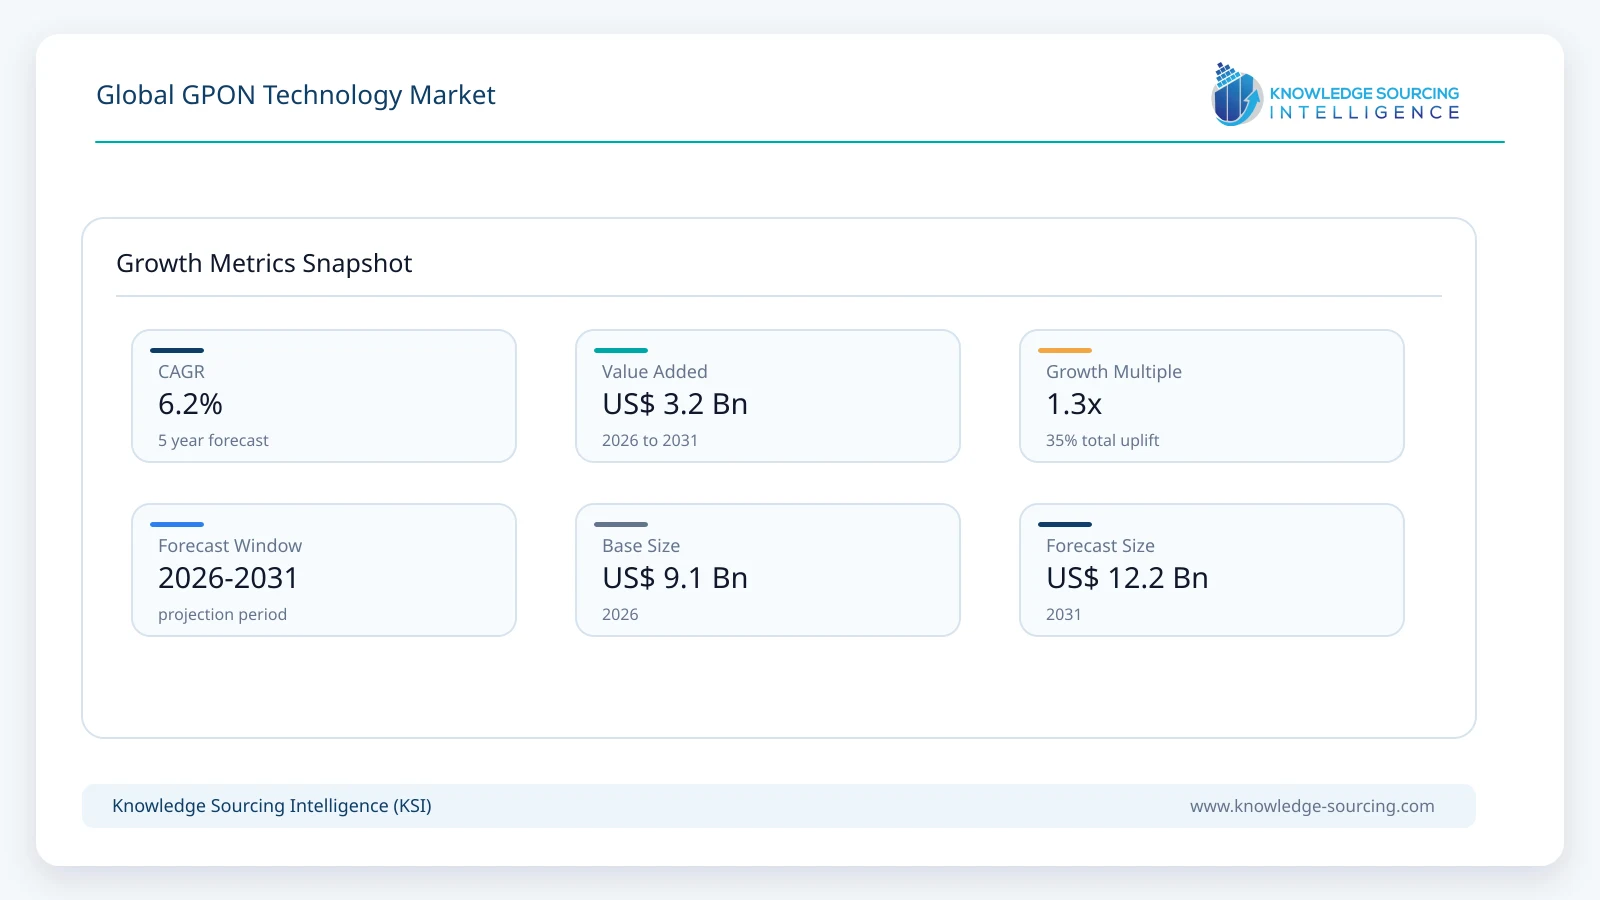
The Global GPON Technology Market is projected to grow at a CAGR of 6.16%, increasing from USD 9.06 billion in 2026 to USD 12.22 billion by 2031.
Highlights:
- 1Conventional 2.5G-PON/GPON accounts for approximately 49% of market value in 2026, reflecting the scale of the installed FTTH base.
- 2XGS-PON is projected to grow at approximately 13.0% annually through 2031, substantially above the overall market.
- 3Optical Network Terminals remain the larger component category because every served premises requires subscriber-side termination equipment.
- 4Optical Line Terminals record stronger growth as operators add higher-capacity line cards and upgrade access platforms.
- 5Residential applications account for approximately 66% of market value in 2026, while Commercial applications grow faster as multi-gigabit fibre expands into enterprises and multi-dwelling environments.
- 6Asia Pacific remains the largest regional market, supported particularly by China, Japan and South Korea.
- 7Middle East and Africa is projected to record one of the strongest regional growth rates as fibre deployment expands from a smaller installed base.
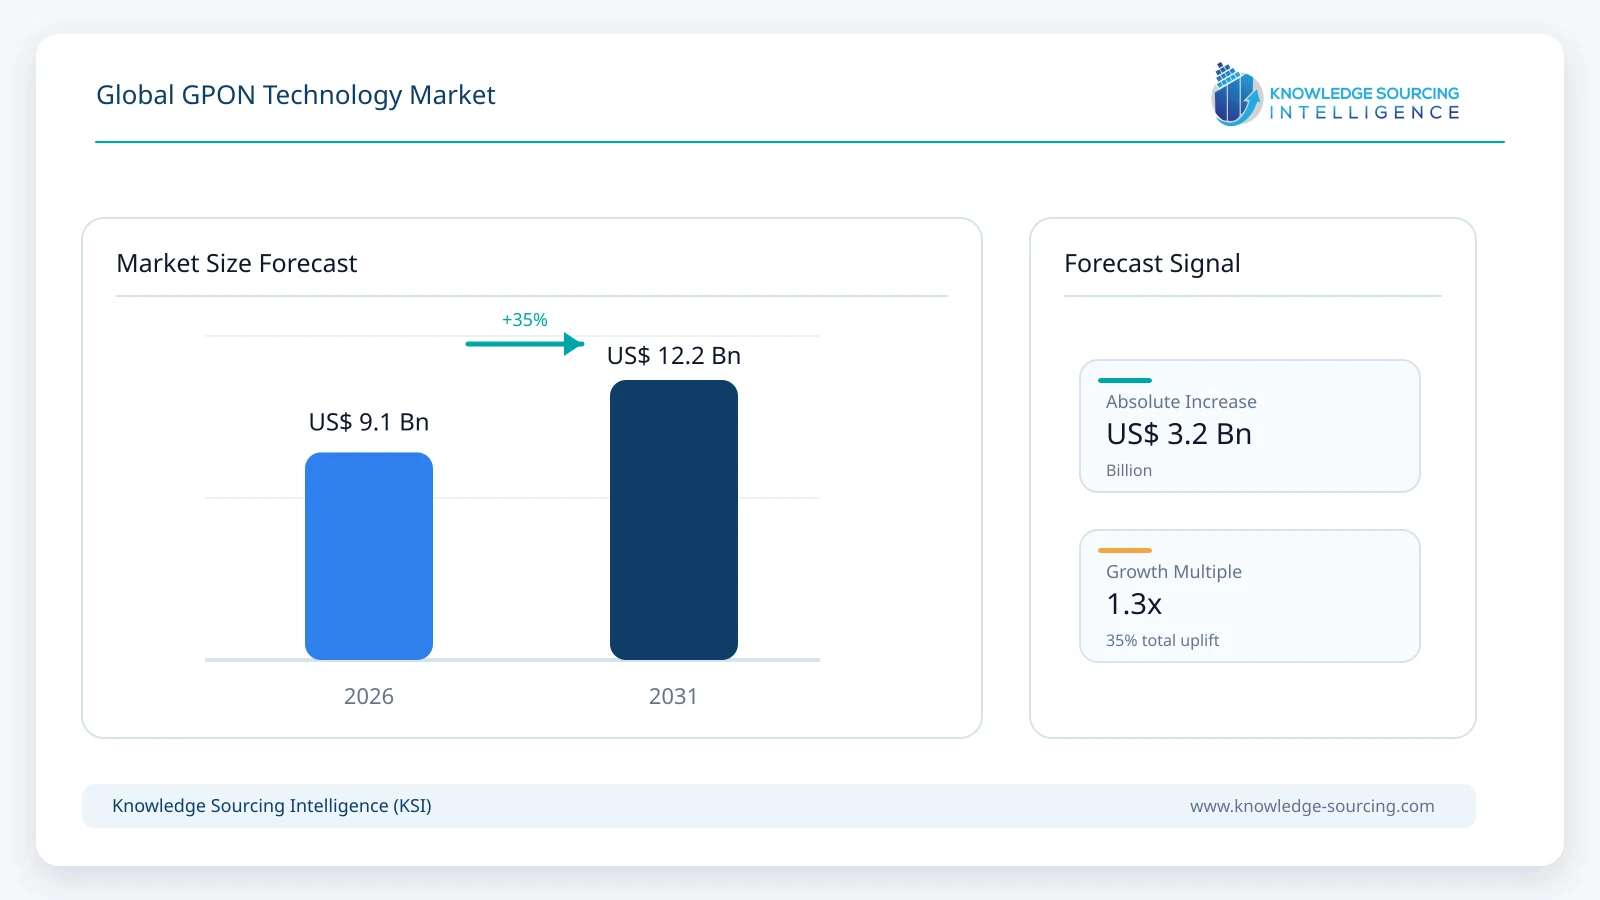
The market covers passive optical network equipment supporting conventional GPON and higher-capacity generations including XG-PON, XGS-PON and NG-PON2. Growth is being supported by continued fibre-to-the-home deployment, migration toward gigabit and multi-gigabit broadband, higher fixed-network traffic, enterprise fibre adoption and the ability of operators to upgrade PON electronics while retaining much of their existing passive fibre infrastructure.
The underlying fixed-broadband demand base continues to increase. ITU estimates that global fixed broadband subscriptions reached approximately 20 per 100 inhabitants in 2025, with subscriptions expanding at an average annual rate of 5.2% over the preceding five years. Fixed networks also carried approximately 7.3 zettabytes of end-user Internet traffic in 2025, almost five times mobile broadband traffic, reinforcing the need for higher-capacity access networks as streaming, cloud applications, Wi-Fi traffic and enterprise connectivity increase.
Fibre is simultaneously replacing legacy fixed-access technologies. Across OECD countries, fibre accounted for approximately 47% of fixed broadband subscriptions at the end of 2024, up from 28% in 2019. South Korea had fibre penetration above 90% of fixed broadband subscriptions, while Spain approached 90%. China operates on an even larger physical scale: by July 2026, the country’s three major operators had 702 million fixed broadband subscribers, 260 million of whom subscribed to services at 1 Gbps or above, while FTTH/O represented 96.7% of broadband access ports.
The technology mix is shifting as these fibre networks mature. Conventional GPON remains the largest installed equipment category, but XGS-PON is expanding substantially faster because it provides symmetrical 10 Gbps capability while allowing operators to reuse existing optical distribution networks. The industry’s longer-term migration path is already moving toward 25G and 50G PON. During 2026, Nokia, Huawei, ZTE, Calix and Adtran all demonstrated or commercially supported higher-capacity PON architectures designed to coexist with earlier GPON generations, reducing the need for disruptive fibre rebuilds.
Market Growth Drivers and Trends
Fixed Broadband Traffic Is Increasing the Value of Fibre Access Networks
Fixed broadband continues to carry most data-intensive Internet traffic despite the rapid expansion of mobile connectivity. ITU estimates that fixed broadband networks carried approximately 7.3 zettabytes of end-user Internet traffic during 2025, compared with about 1.5 zettabytes over mobile broadband. Average fixed traffic per subscription reached 369 GB per month globally and exceeded 500 GB in high-income countries.
This traffic profile supports continued investment in fibre access because households increasingly connect televisions, PCs, gaming systems, mobile devices, cameras and IoT equipment through the same broadband connection. Business customers add cloud software, video collaboration, cybersecurity and remote-work requirements that increase upstream as well as downstream traffic.
PON architectures allow operators to distribute fibre capacity across multiple subscribers using passive splitters, limiting the amount of powered equipment required between the central office and customer premises. The economic advantage becomes more valuable as networks need to carry greater traffic without multiplying active field equipment.
Fibre Continues to Replace Copper and Cable Access
The shift from DSL and other legacy technologies toward fibre remains one of the strongest structural drivers of the market. OECD fibre subscriptions expanded at nearly 15% annually between 2019 and 2024, and fibre has become the largest fixed-broadband access technology across the OECD aggregate.
China illustrates what a mature fibre-access environment can look like. By July 2026, FTTH/O represented 96.7% of broadband access ports, while 33.04 million 10G PON-capable ports were already deployed. The number of Chinese subscribers on 1 Gbps or higher services reached 260 million, representing 37.1% of the fixed broadband base.
Other markets remain earlier in the transition and therefore have more greenfield deployment potential. India continues to expand rural fibre through BharatNet, while Brazil reported 55.4 million fixed broadband accesses in the second quarter of 2026 and maintains a highly fragmented fibre-oriented provider market.
XGS-PON Is Becoming the Main Upgrade Path for Multi-Gigabit Access
Conventional GPON remains sufficient for many residential connections, but operators increasingly require greater symmetrical capacity for premium households, businesses, multi-dwelling units and mobile backhaul. XGS-PON provides 10 Gbps symmetrical capability and can coexist with GPON over the same passive optical distribution network when appropriate wavelength plans and coexistence elements are used.
The economic importance of coexistence is substantial. Civil works and fibre construction represent a large portion of FTTH deployment cost, so the ability to replace or add OLT line cards and ONTs while retaining existing fibre and splitters improves the return on previous network investment.
Current vendor portfolios reflect this transition. Calix’s 2026 access portfolio combines XGS-PON with Wi-Fi 7 subscriber equipment, while Adtran demonstrated XGS-PON operating alongside EPON and 50G PON on the same live fibre during its August 2026 TOHKnet trial in Japan. Ubiquiti also currently markets GPON and XGS-PON OLT and ONU equipment with coexistence components, illustrating how 10G PON capability is becoming available beyond the largest carrier-grade suppliers.
Multi-Generation PON Reduces the Risk of Technology Obsolescence
Operators historically faced the risk that access-network upgrades would require expensive parallel infrastructure. Current multi-PON architectures increasingly allow several generations of technology to operate on the same fibre network, making migration more incremental.
In September 2026, ZTE and Uruguay’s Antel validated coexistence of GPON, 10G PON and symmetric 50G PON on the same infrastructure. Adtran’s Japanese trial similarly demonstrated EPON, XGS-PON and 50G PON together on a live network. Nokia’s Lightspan architecture supports multiple PON generations, including GPON, XGS-PON, 25G and 50G, from common access platforms.
This reduces the need for an operator to wait for one final access standard before investing. Residential subscribers can remain on lower-speed services while enterprise, mobile-transport or premium users migrate to higher-capacity wavelengths, allowing network investment to follow actual demand.
PON Is Expanding Beyond Residential FTTH
Residential broadband remains the principal market, but PON infrastructure is increasingly being used for enterprises, multi-dwelling units, utilities and other non-residential environments. Higher-speed PON enables operators to deliver business services over the same basic fibre footprint used for residential access, improving asset utilization.
Nokia’s January 2026 altafiber deployment uses 25G PON to support both residential and business customers while providing an upgrade path toward 50G services. Calix expanded its PON-based portfolio into utility grid monitoring in August 2026 using dedicated ONT equipment and its E-Series access platform.
Enterprise adoption also raises requirements for symmetrical bandwidth, redundancy, security and service-level performance, supporting higher-value OLT platforms and advanced ONTs rather than merely adding residential subscriber units.
Market Restraints
Fibre Construction Remains Capital Intensive
PON equipment can reduce active-network operating costs, but the fibre network itself requires significant upfront investment. Civil engineering, rights of way, trenching, pole access, ducts, fibre cable and premises installation frequently represent a larger cost than the optical electronics.
The economics are particularly difficult in low-density and rural areas where each kilometre of fibre serves relatively few subscribers. Public broadband programmes can improve the economics, but operators still need sufficient customer uptake to justify long-term infrastructure investment.
This creates substantial differences in deployment pace between dense cities, suburban markets and sparsely populated areas and helps explain why fixed broadband penetration remains below one subscription per 100 inhabitants in low-income countries compared with 39 in high-income economies.
Fixed Wireless Access Provides an Alternative in Selected Areas
Fibre offers high capacity and long-term upgrade potential, but fixed wireless access can be deployed more quickly where mobile infrastructure and suitable spectrum already exist. OECD data show that FWA represented only 5.8% of fixed broadband subscriptions but was expanding rapidly in several countries, including the United States.
FWA is unlikely to replace fibre in the highest-capacity or densest applications, but it can reduce the commercial attractiveness of new FTTH construction in areas where customers prioritize speed of installation and adequate rather than maximum capacity.
Operators therefore increasingly evaluate fibre and FWA as complementary access technologies and deploy each where its economics are strongest.
Multiple PON Generations Increase Network Planning Complexity
Coexistence protects fibre investment but also increases operational complexity. Operators may simultaneously support GPON, XGS-PON and higher-capacity PON systems, each with different optics, ONTs, line cards and customer-service profiles.
Managing these generations requires careful wavelength planning, inventory control and migration procedures. Poorly planned upgrades can strand equipment or create unnecessary truck rolls if subscriber hardware needs to be replaced repeatedly.
Integrated multi-PON platforms reduce this problem, but they also increase dependence on vendors capable of supporting long product lifecycles and interoperability.
Low-Cost Broadband Can Pressure Equipment Economics
Broadband access is highly price sensitive in many emerging markets. Operators expanding fibre into lower-income households need to control customer acquisition and premises-equipment cost while still achieving acceptable payback on the underlying network.
ONTs are particularly exposed because each new subscriber requires customer-side equipment. Even relatively small changes in unit cost become meaningful when operators deploy millions of devices.
This encourages intense vendor competition, standardized hardware and greater use of integrated Wi-Fi gateways, but it can also compress supplier margins in high-volume GPON equipment.
Security and Vendor Requirements Can Influence Procurement
PON access networks form part of critical communications infrastructure, making equipment security, software maintenance and supply continuity important procurement considerations. Operators and governments may impose vendor restrictions, cybersecurity requirements or local sourcing policies that affect supplier selection.
As networks become software-managed and support enterprise and utility applications, security requirements extend beyond the optical layer to management systems, subscriber gateways and cloud-based operational platforms.
This can lengthen procurement cycles and increase qualification costs even when demand for fibre capacity remains strong.
GPON Technology Market Segmentation Analysis
By Technology
Conventional 2.5G-PON Remains the Largest Installed Technology
Conventional GPON, represented in the segmentation as 2.5G-PON, accounts for approximately 49% of market value in 2026. The technology remains deeply embedded in existing FTTH networks and continues to provide sufficient capacity for a large proportion of mass-market residential broadband connections.
Its commercial importance comes from scale rather than technological leadership. Operators have already installed large OLT and ONT bases, and maintaining these subscribers remains economically attractive where service requirements do not justify immediate migration to 10 Gbps systems. GPON also continues to be deployed in cost-sensitive markets where the price difference between mature GPON hardware and newer XGS-PON equipment materially affects project economics.
XGS-PON Records the Strongest Growth
XGS-PON is projected to grow at approximately 13.0% annually through 2031, more than twice the overall market rate. Symmetrical 10 Gbps capacity gives operators substantially more headroom for multi-gigabit residential services, business connectivity, MDUs and other applications while retaining the passive fibre distribution network already in place.
The migration is increasingly evolutionary rather than disruptive. Existing GPON customers can remain on their current service while higher-value customers migrate to XGS-PON over the same fibre infrastructure using coexistence technology. This lowers the economic threshold for deployment and allows operators to add XGS capacity according to actual demand rather than performing a network-wide replacement.
Bby Component
Optical Network Terminals Remain the Largest Component
Optical Network Terminals account for approximately 60% of market value in 2026. The installed quantity of ONTs is inherently much larger than OLTs because subscriber premises require individual termination equipment, frequently integrated with routing, Wi-Fi and voice functionality.
The subscriber device is also becoming more sophisticated as broadband speeds increase. Wi-Fi 6 and Wi-Fi 7 integration, multi-gigabit Ethernet, managed security and whole-home networking are increasing the functional content of ONTs and residential gateways even as intense hardware competition limits unit prices.
Optical Line Terminals Record Faster Growth
Optical Line Terminals are projected to grow at approximately 7.5% annually through 2031, supported by operator upgrades from GPON-only platforms toward multi-PON systems capable of XGS-PON and future higher-speed generations.
The shift increases value per deployed access node because operators need denser line cards, higher backplane capacity and software capable of managing multiple service generations simultaneously. New platforms can therefore support subscriber growth and network modernization without requiring an equivalent replacement of the passive fibre outside plant.
By End-User
Residential Remains the Core Demand Base
Residential applications account for approximately 66% of global market value in 2026. FTTH remains the largest use of PON because one optical line terminal can efficiently serve large numbers of households through passive splitters, providing a scalable architecture for broadband, voice and video services.
The continuing increase in home traffic supports additional capacity requirements even in mature fibre markets. ITU estimates that fixed networks carried nearly five times more end-user traffic than mobile broadband networks in 2025, reflecting the volume generated by home Wi-Fi and fixed-connected devices.
Commercial Applications Grow Faster
Commercial applications are projected to grow at approximately 8.2% annually through 2031. Businesses increasingly require symmetrical bandwidth for cloud applications, video, data backup and distributed workplaces, while multi-dwelling and campus environments benefit from PON’s ability to reduce active switching equipment.
Higher-capacity PON also allows service providers to address enterprise demand from the same fibre infrastructure used for residential customers. Nokia’s altafiber deployment and the broader industry’s move toward 25G and 50G PON demonstrate how access platforms are increasingly designed to accommodate residential and business services together rather than as completely separate networks.
Geographical Outlook
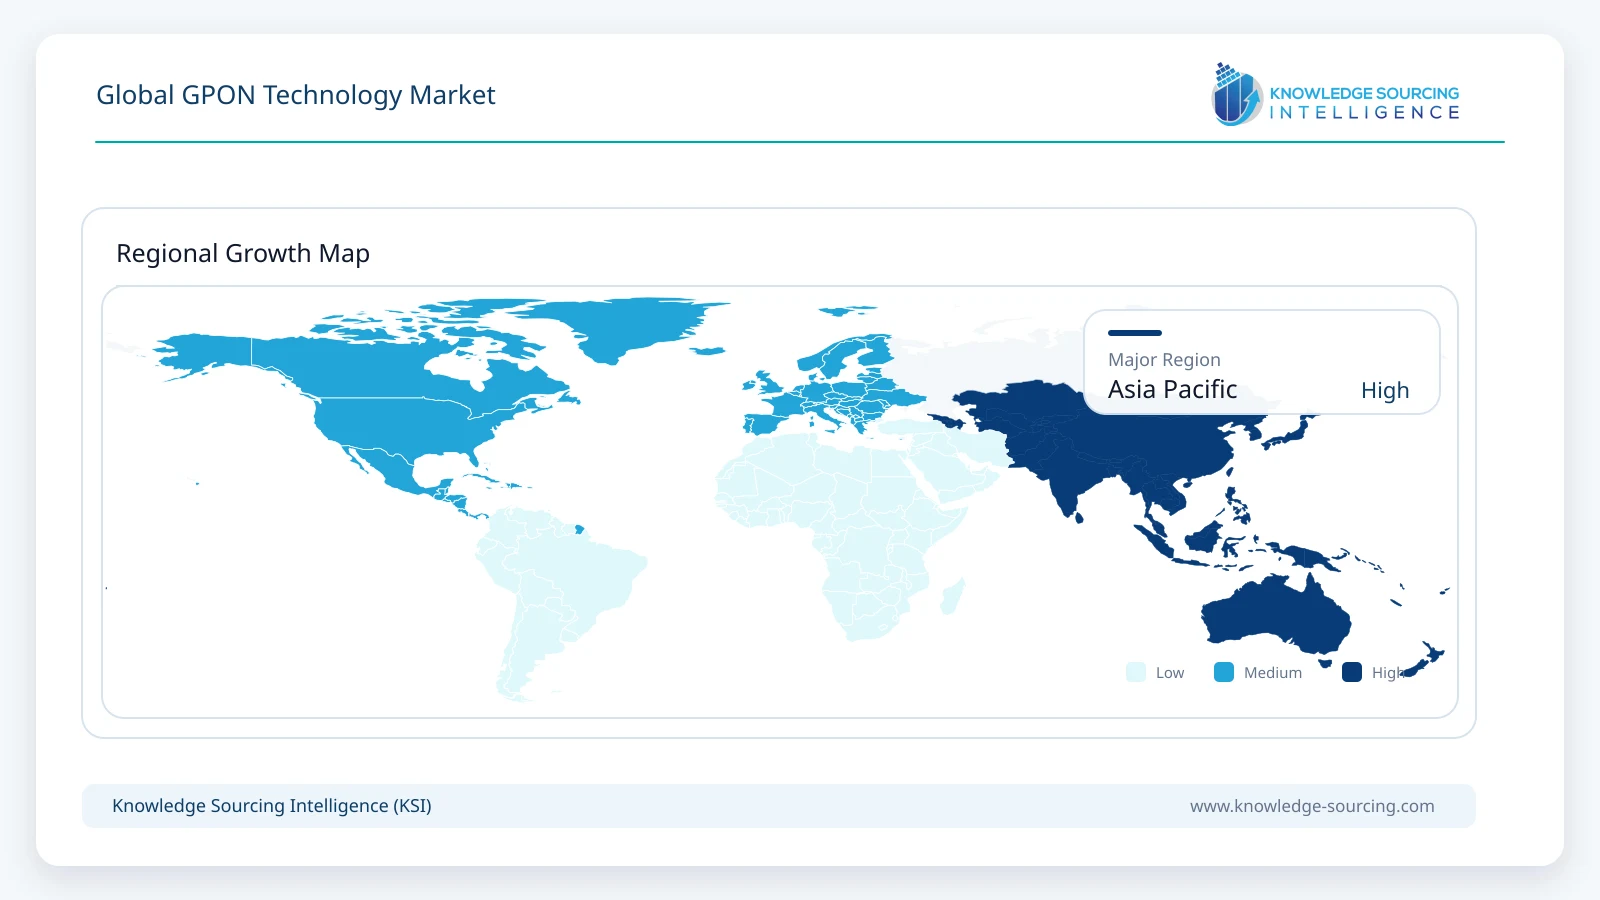
Asia Pacific Remains the Largest Regional Market
Asia Pacific accounts for approximately 43% of global market value in 2026. China provides the largest physical installed base, while South Korea and Japan have highly developed fibre broadband infrastructure and India continues to expand fibre deeper into urban and rural networks.
China’s scale is particularly significant. By July 2026, FTTH/O represented 96.7% of the country’s broadband access ports, 33.04 million ports were capable of gigabit service using 10G PON technologies and 260 million subscribers were already taking services at 1 Gbps or above.
The region combines ongoing subscriber additions with technology migration, allowing demand to shift progressively from conventional GPON toward XGS-PON without removing the enormous installed GPON equipment base.
Middle East & Africa Records the Strongest Regional Growth
Middle East & Africa is projected to grow at approximately 9.0% annually through 2031 from a comparatively smaller base. Gulf markets are investing in high-capacity fixed infrastructure, while parts of Africa continue to have very low fixed broadband penetration and therefore significant longer-term room for expansion.
The region contains two different opportunities. Higher-income Gulf countries support gigabit and multi-gigabit upgrades, enterprise fibre and smart infrastructure, while lower-penetration African markets provide greenfield FTTH potential where project economics and affordability permit.
The combination of premium upgrades and new network construction supports a growth rate above mature North American and European markets, although the region remains much smaller than Asia Pacific in absolute equipment value.
Recent Developments
September 2026, ZTE and Uruguay’s Antel completed Latin America’s first validation of symmetric 50G PON, demonstrating coexistence of GPON, 10G PON and 50G PON over the same fibre infrastructure.
August 2026, Adtran and TOHKnet completed Japan’s first live-network 50G PON trial, demonstrating simultaneous operation of 50G PON, XGS-PON and EPON on one fibre network.
June 2026, Huawei introduced a high-density 50G PON service board intended for large-scale commercial deployment as part of its AI-optical-network portfolio.
May 2026, Calix announced standards-based 50G PON support for its Calix One platform, providing operators with an upgrade route from existing fibre access infrastructure.
January 2026, Nokia was selected by altafiber for a multi-gigabit fibre expansion across Ohio and Hawaii using 25G PON, with the platform also providing a migration route toward 50G services.
Competitive Environment
The GPON Technology Market combines large global telecom equipment vendors with specialist broadband-access suppliers and customer-premises-equipment manufacturers. Huawei, ZTE, Nokia and FiberHome have particularly broad carrier portfolios spanning OLTs, ONTs and multiple generations of PON technology. Their scale allows them to participate in large national and Tier-1 operator fibre programmes while maintaining extensive product families across residential and enterprise applications.
Calix and Adtran hold important positions among regional and independent broadband providers, particularly in North America and selected international markets. Both companies increasingly combine access hardware with cloud software, operational platforms and managed subscriber services, illustrating the shift from selling optical equipment alone toward managing the wider broadband experience.
TP-Link, Ubiquiti, Zyxel, Sagemcom and Sercomm strengthen competition in ONTs, gateways and smaller operator deployments, while DASAN Networks, Raisecom, UTStarcom and V-SOL participate across access equipment and optical subscriber systems. Ciena, Harmonic and Radisys contribute through disaggregated, virtualized or open broadband-access architectures that give operators alternatives to vertically integrated access stacks.
Competitive advantage through 2031 is increasingly determined by the ability to support several PON generations from common platforms. Operators want to preserve fibre and chassis investments while introducing XGS-PON and eventually higher-capacity services only where needed. Vendors that combine multi-PON hardware, software automation, interoperability and a large ONT ecosystem are therefore positioned more strongly than suppliers tied to a single access generation.
Analyst View
The Global GPON Technology Market is growing as fibre continues to replace legacy fixed-access networks and existing FTTH operators migrate toward higher-capacity PON.
The market should not be interpreted as a simple replacement cycle in which XGS-PON immediately eliminates conventional GPON. The more important trend is coexistence. Large installed GPON networks remain economically useful, while XGS-PON is added where subscribers require multi-gigabit symmetrical performance. Multi-PON architectures allow operators to make this transition gradually and protect the much larger investment already made in ducts, fibre and passive splitters.
This favours XGS-PON as the fastest-growing technology while conventional 2.5G GPON remains the largest value category during the forecast period. A similar pattern is visible in components: ONTs remain larger because subscriber devices are deployed in much greater quantities, while OLT value grows faster as operators modernize central-office access platforms.
The next technology generation is already visible through 25G and 50G PON deployments and trials, but these technologies should currently be treated as the upgrade path around the report rather than inserted into the existing forecast segmentation. Their commercial significance is that they extend the useful life of the same fibre infrastructure, strengthening the long-term investment case for PON networks being deployed today.
GPON Technology Market Scope:
| Report Metric | Details |
|---|---|
| Total Market Size in 2026 | USD 9.06 billion |
| Total Market Size in 2031 | USD 12.22 billion |
| Forecast Unit | Billion |
| Growth Rate | 6.16% |
| Study Period | 2021 to 2031 |
| Historical Data | 2021 to 2024 |
| Base Year | 2025 |
| Forecast Period | 2026 – 2031 |
| Segmentation | Technology, Component, End-User, Geography |
| Companies |
|
Market Segmentation
By Technology
XG-PON
2.5G-PON (GPON)
NG-PON2
XGS-PON
By Component
Optical Line Terminal (OLT)
Optical Network Terminal (ONT)
By End-User
Residential
Commercial
Industrial
By Geography
North America
USA
Canada
Mexico
South America
Brazil
Argentina
Others
Europe
Germany
France
United Kingdom
Spain
Others
Middle East and Africa
Saudi Arabia
UAE
Israel
Others
Asia Pacific
China
India
Japan
South Korea
Thailand
Indonesia
Taiwan
Others
Table of Contents
1. EXECUTIVE SUMMARY
2. MARKET SNAPSHOT
2.1. Market Overview
2.2. Market Definition
2.3. Scope of the Study
2.4. Market Segmentation
3. BUSINESS LANDSCAPE
3.1. Market Drivers
3.2. Market Restraints
3.3. Market Opportunities
3.4. Porter’s Five Forces Analysis
3.5. Industry Value Chain Analysis
3.6. Policies and Regulations
3.7. Strategic Recommendations
4. TECHNOLOGICAL OUTLOOK
4.1. GPON to XGS-PON Migration
4.2. Multi-PON Coexistence
4.3. 25G and 50G PON Evolution
4.4. Software-Defined and Open Access Networks
5. GLOBAL GPON TECHNOLOGY MARKET BY TECHNOLOGY
5.1. Introduction
5.2. XG-PON
5.3. 2.5G-PON (GPON)
5.4. NG-PON2
5.5. XGS-PON
6. GLOBAL GPON TECHNOLOGY MARKET BY COMPONENT
6.1. Introduction
6.2. Optical Line Terminal (OLT)
6.3. Optical Network Terminal (ONT)
7. GLOBAL GPON TECHNOLOGY MARKET BY END-USER
7.1. Introduction
7.2. Residential
7.3. Commercial
7.4. Industrial
8. GLOBAL GPON TECHNOLOGY MARKET BY GEOGRAPHY
8.1. Introduction
8.2. North America
8.2.1. USA
8.2.2. Canada
8.2.3. Mexico
8.3. South America
8.3.1. Brazil
8.3.2. Argentina
8.3.3. Others
8.4. Europe
8.4.1. Germany
8.4.2. France
8.4.3. United Kingdom
8.4.4. Spain
8.4.5. Others
8.5. Middle East and Africa
8.5.1. Saudi Arabia
8.5.2. UAE
8.5.3. Israel
8.5.4. Others
8.6. Asia Pacific
8.6.1. China
8.6.2. India
8.6.3. Japan
8.6.4. South Korea
8.6.5. Thailand
8.6.6. Indonesia
8.6.7. Taiwan
8.6.8. Others
9. COMPETITIVE ENVIRONMENT AND ANALYSIS
9.1. Major Players and Strategy Analysis
9.2. Market Share Analysis
9.3. Mergers, Acquisitions, Agreements and Collaborations
9.4. Competitive Dashboard
10. COMPANY PROFILES
10.1. Huawei Technologies Co., Ltd.
10.2. ZTE Corporation
10.3. Nokia Corporation
10.4. FiberHome Telecommunication Technologies Co., Ltd.
10.5. Calix, Inc.
10.6. Adtran Holdings, Inc.
10.7. TP-Link Corporation Pte. Ltd.
10.8. Ubiquiti Inc.
10.9. Zyxel Communications Corp.
10.10. Sagemcom
10.11. Sercomm Corporation
10.12. DASAN Networks, Inc.
10.13. Raisecom Technology Co., Ltd.
10.14. UTStarcom Holdings Corp.
10.15. Ciena Corporation
10.16. Harmonic Inc.
10.17. Radisys Corporation
10.18. Guangzhou V-SOL Technology Co., Ltd.
11. APPENDIX
11.1. Currency
11.2. Assumptions
11.3. Base and Forecast Years Timeline
11.4. Key Benefits for Stakeholders
11.5. Research Methodology
11.6. Abbreviations
Navigate
Trusted by the world's leading organizations











