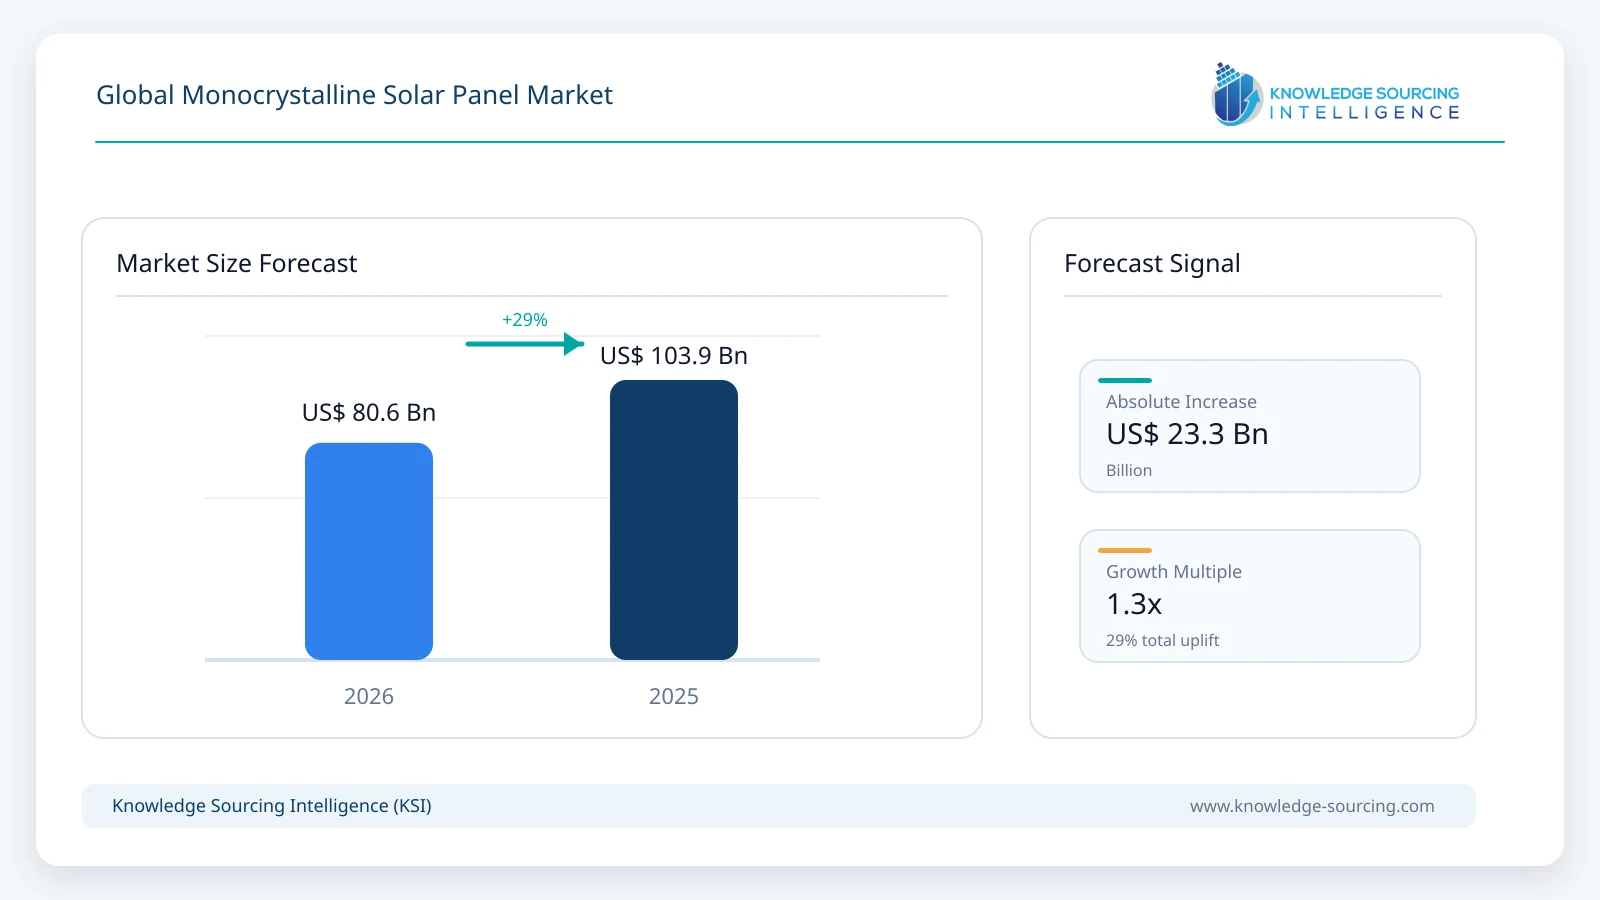
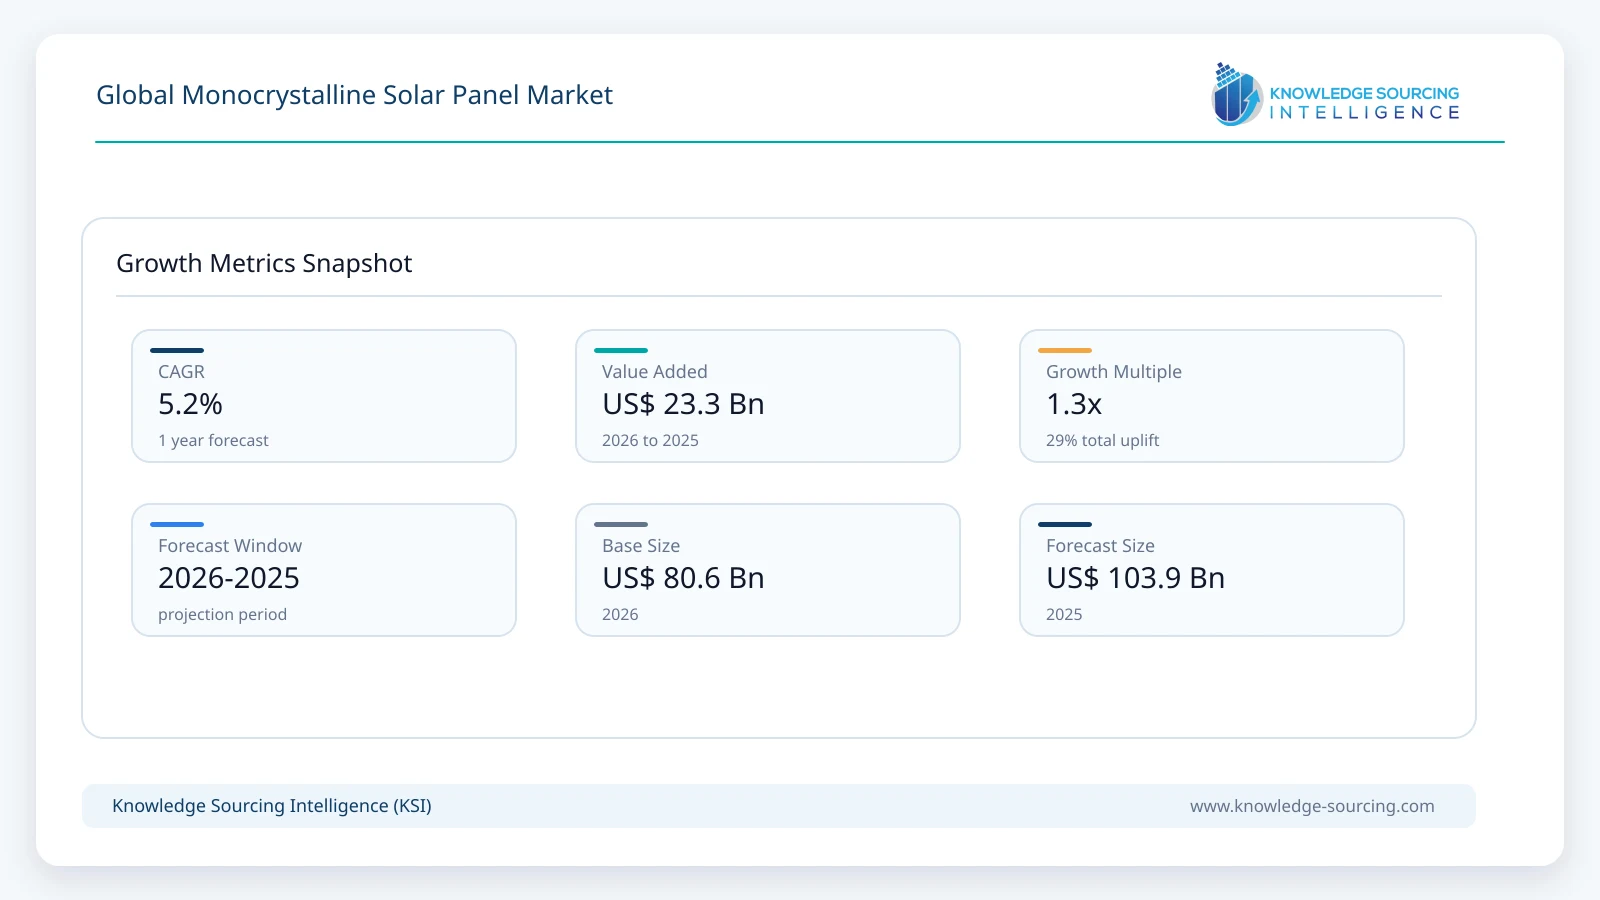
The global monocrystalline solar panel market is forecast to grow from USD 80.60 billion in 2026 to USD 103.90 billion in 2031, representing a CAGR of 5.21% during the forecast period.
Highlights:
- 1N-type modules account for approximately 90.0% of global monocrystalline panel revenue in 2026.
- 2Panels above 200 W represent approximately 95.0% of global 2026 market revenue.
- 3Utility-scale projects account for approximately 54.0% of global monocrystalline module demand by value.
- 4Asia Pacific represents approximately 49.0% of global monocrystalline panel revenue in 2026.
- 5Global PV module shipments reached roughly 706 GW in 2025 despite severe price pressure.
- 6TOPCon, back-contact and heterojunction architectures are driving the next efficiency improvement cycle.
Market Overview
The monocrystalline solar panel market covers finished photovoltaic modules manufactured from monocrystalline silicon wafers and sold for electricity-generation systems. The scope includes mono-PERC, n-type TOPCon, heterojunction, back-contact and other monocrystalline silicon module architectures across utility-scale, commercial, industrial and residential applications. It excludes thin-film modules, polycrystalline modules, upstream wafers and cells sold separately, inverters, trackers, mounting systems, batteries and installation or engineering revenue.
Monocrystalline silicon has become the dominant crystalline-silicon platform in global PV manufacturing. IEA PVPS reports that crystalline silicon accounted for approximately 98% of global module production in 2024, while the 2026 edition of its Trends report shows n-type technology reaching around 82% of crystalline silicon wafers used for cell manufacturing in 2025. The remaining technology mix is rapidly shifting away from legacy p-type architectures toward TOPCon, back-contact and heterojunction designs.
Industry shipment data confirm that the addressable market is far larger than the current KSI page estimate. The International Technology Roadmap for Photovoltaics reported approximately 706 GW of global PV module shipments in 2025. JinkoSolar and LONGi alone each shipped roughly 86 GW during 2025, while JA Solar reported 69.56 GW of combined cell and module shipments and Canadian Solar shipped 24.3 GW of modules. These volumes place finished-module revenue in the tens of billions of dollars even after the sharp decline in per-watt prices.
Revenue growth is expected to remain materially slower than shipment growth because module pricing remains highly competitive. IEA PVPS reported n-type single-crystalline module prices below USD 0.10/W during parts of 2024, while OPIS assessed mainstream China TOPCon modules at approximately USD 0.108/W FOB China in September 2026. Higher prices in the United States and selected protected markets lift the global weighted realization, but continued manufacturing overcapacity constrains revenue expansion.
The market therefore combines strong underlying volume growth with moderate value growth. New installations, replacement demand, data-center power procurement, electrification and declining system costs support module shipments, while technology upgrades increase power density and energy yield. At the same time, intense competition, falling manufacturing costs and periodic oversupply limit the rate at which shipment gains translate into market revenue.
Monocrystalline Solar Panel Market Trends
N-Type TOPCon Becomes the Mainstream Architecture
N-type TOPCon has moved from a premium technology to the mainstream monocrystalline platform. IEA PVPS reports that n-type wafers represented around 82% of crystalline-silicon wafer use in 2025, and leading manufacturers are now concentrating new product development around higher-efficiency TOPCon generations. JinkoSolar's Tiger Neo 5.0, Trinasolar's Vertex N G3, Canadian Solar's TOPCon 3.0, Tongwei's TNC 3.0 and Astronergy's ASTRO N7 3.0 illustrate how suppliers are competing on cell passivation, bifaciality, temperature coefficient and packaging efficiency.
Module Power Density Moves Above 700 W for Utility Applications
The utility-scale market is shifting toward higher wattage without proportional growth in module footprint. Trinasolar introduced Vertex N G3 products reaching 760 W, Tongwei moved its 750 W TNC 3.0-G12 module into mass production, and JinkoSolar launched Tiger Neo 5.0 above 700 W. Higher power density reduces module count, cabling, mounting labor and land-related balance-of-system requirements for large projects, making module efficiency a direct system-economics variable rather than only a laboratory metric.
Back-Contact Technology Expands Beyond Premium Rooftops
Back-contact architectures are gaining commercial momentum as manufacturers seek efficiency improvements beyond conventional TOPCon. LONGi reported 22.87 GW of BC-series module sales in 2025 and 19.55 GW in the first half of 2026, while AIKO continues to scale n-type ABC products with mass-production efficiencies above 25%. BC remains smaller than TOPCon globally, but its rapid commercialization is creating a second major high-efficiency pathway for premium residential, C&I and selected utility projects.
Bifacial and Dual-Glass Designs Become Standard in Large Projects
Bifacial modules represented more than three quarters of crystalline-silicon module production in 2024 according to IEA PVPS. Utility developers increasingly favor bifacial dual-glass designs because rear-side generation can improve energy yield where albedo and tracker configuration are favorable. Manufacturers are also raising bifaciality and improving encapsulation, glass selection and mechanical design to balance energy gain with hail, heat and structural reliability requirements.
Segment Analysis
By Type - N-Type
N-type monocrystalline modules are estimated at approximately USD 72.54 billion in 2026. The segment has become the commercial center of the market as TOPCon displaces p-type PERC in mainstream utility and distributed applications, while HJT and back-contact architectures expand at the premium end. N-type products support higher conversion efficiency, stronger bifacial performance and lower long-term degradation, and most major suppliers are directing new capacity and product launches toward n-type platforms. JinkoSolar, Trinasolar, Canadian Solar, Astronergy and Tongwei are scaling successive TOPCon generations, while LONGi and AIKO are expanding back-contact portfolios. This technology shift is expected to keep n-type modules dominant through 2031.
By Power - Above 200 W
Panels rated above 200 W are estimated at approximately USD 76.57 billion in 2026. Modern residential products commonly exceed 400 W, commercial rooftop modules increasingly operate in the 450-600 W range, and utility products now extend beyond 700 W, making lower-power modules a small specialty category. Higher wattage improves installation productivity and can reduce balance-of-system costs because fewer panels, clamps, cables and electrical connections are required for a given project capacity. The segment is also benefiting from larger rectangular wafers, improved cell efficiency, denser interconnection and module-area optimization, which allow manufacturers to raise power while maintaining bankable form factors.
By End User - Utility-Scale
Utility-scale projects are estimated at approximately USD 43.52 billion in 2026. Large ground-mounted projects remain the biggest monocrystalline module demand pool because they absorb very high shipment volumes and increasingly standardize around high-power bifacial n-type products. IEA PVPS data show utility-scale systems remaining the largest global installation class, while manufacturers are tailoring 650-760 W modules specifically to reduce tracker, cabling and installation costs. China, India, the United States, the Middle East, Latin America and parts of Africa continue to support multi-hundred-megawatt and gigawatt-scale procurement, keeping utility applications central to global module revenue despite lower per-watt pricing than some residential channels.
By Geography - Asia Pacific
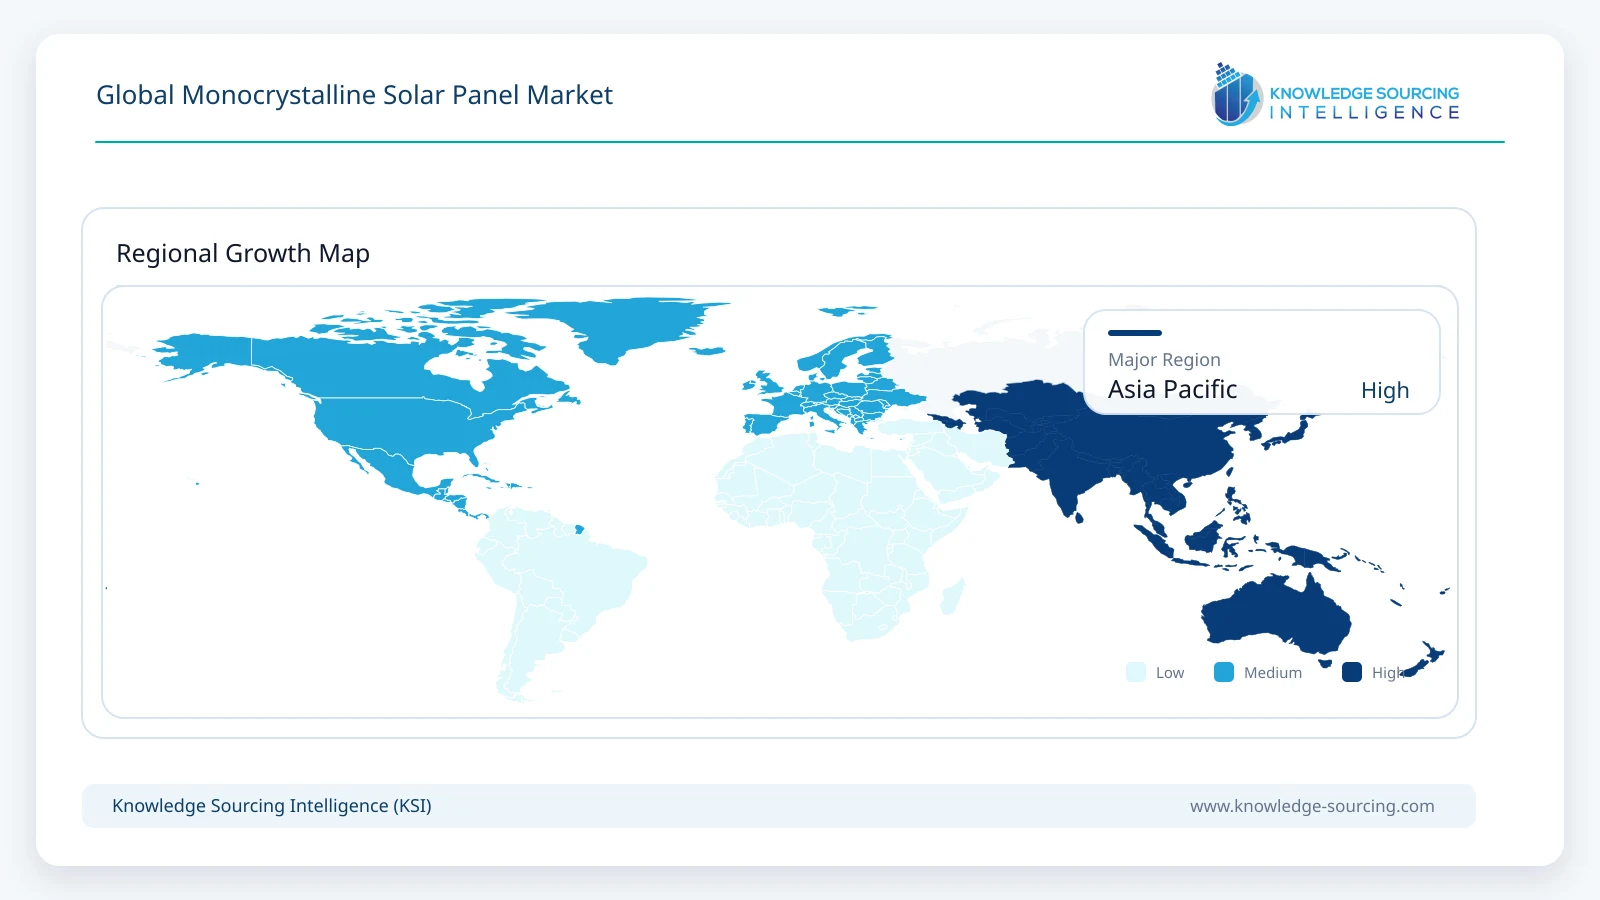
Asia Pacific is estimated at approximately USD 39.49 billion in 2026. The region combines the world's largest installation market with the dominant manufacturing base for monocrystalline wafers, cells and modules. China installed approximately 415 GW of PV in 2025 according to IEA PVPS, while India installed about 54 GW and became the world's second-largest annual market. China also remains the principal module manufacturing center, while India is scaling domestic module and cell capacity through companies such as Waaree, Adani Solar and Vikram Solar. Strong utility procurement, rooftop deployment and manufacturing localization are expected to keep Asia Pacific the largest regional market through 2031.
Market Drivers
Record Global Solar Deployment
Global PV additions reached approximately 690 GW in 2025 according to IEA PVPS, lifting cumulative installed capacity to about 2.96 TW. Solar remains the largest source of new renewable capacity in many markets because modules can be deployed across utility, rooftop and distributed applications with short construction timelines. Continued installation growth directly expands the addressable market for monocrystalline modules.
Falling System Costs and Higher Energy Yield
Module efficiency gains allow developers to install more generating capacity within fixed land or rooftop areas, while larger modules reduce hardware and labor requirements per megawatt. Even where module prices stabilize, reductions in balance-of-system cost and higher lifetime energy yield can improve project economics, supporting replacement of older technologies with newer monocrystalline platforms.
Rapid Electricity Demand Growth and Data-Center Loads
Electricity consumption from industry, transport electrification, cooling and data centers is expanding in several major markets. Solar is increasingly procured alongside storage to meet new load growth and corporate decarbonization requirements. High-efficiency monocrystalline modules are particularly attractive where available land, interconnection capacity or rooftop space is constrained.
Manufacturing Localization and Industrial Policy
The United States, India and other markets are encouraging domestic solar manufacturing through tariffs, incentives, procurement rules and local-content policies. These measures are increasing regional module capacity and diversifying supply chains beyond China. Localization can raise regional selling prices and investment requirements even as global manufacturing remains highly competitive.
Market Restraints
Persistent Manufacturing Overcapacity
Global module production capacity remains substantially above annual installations, keeping utilization rates low and intensifying price competition. IEA PVPS notes that manufacturing overcapacity persisted through 2025. This supports low solar-system costs but compresses manufacturer margins and limits revenue growth even when shipment volumes increase.
Volatile Module Pricing
Module revenue is highly sensitive to per-watt selling prices. The industry experienced severe price declines during 2023 and 2024, followed by partial stabilization and selective recovery. Raw-material prices, trade measures, inventory levels and changes in Chinese domestic demand can move prices rapidly, making value growth less predictable than shipment growth.
Trade Barriers and Supply-Chain Fragmentation
Tariffs, antidumping measures, import restrictions and domestic-content rules affect module flows between major manufacturing and demand centers. These policies can support local manufacturing but also create procurement complexity, regional price differences and uncertainty for developers planning projects several quarters ahead.
Grid Constraints and Curtailment
Rapid PV deployment is increasingly constrained by grid connection queues, curtailment and the need for storage or transmission expansion. Where new projects cannot secure timely interconnection, module demand can be delayed even when project economics remain attractive. Grid flexibility therefore becomes increasingly important as solar penetration rises.
Competitive Landscape
The monocrystalline solar panel market is highly competitive and dominated by large Asian manufacturers with vertically integrated wafer, cell and module operations. JinkoSolar, LONGi, Trinasolar and JA Solar each operate at shipment scales measured in tens of gigawatts annually, while Canadian Solar, Astronergy, Tongwei, Risen Energy, DAS Solar, GCL System Integration and other suppliers compete across utility, C&I and residential channels.
Technology differentiation is becoming increasingly important as commodity module margins remain under pressure. TOPCon is the mainstream architecture, but manufacturers are differentiating through advanced passivation, rectangular wafers, higher bifaciality, improved temperature coefficients, reduced degradation and denser packaging. LONGi and AIKO are building stronger positions in back-contact technology, while HJT remains commercially relevant for selected premium and high-efficiency applications.
Regional manufacturing is also becoming a competitive factor. Waaree, Adani Solar and Vikram Solar are expanding Indian capacity, while Qcells maintains manufacturing and market positions in South Korea and the United States. Canadian Solar is expanding U.S. manufacturing, and multiple suppliers are restructuring supply chains in response to trade and traceability requirements. Scale, bankability, technology roadmap, geographic manufacturing footprint and project finance acceptance increasingly determine supplier competitiveness.
Recent Developments
August 2026: JinkoSolar reported first-half module shipments of 29.6 GW and highlighted its Tiger Neo 5.0 module, launched with power output above 700 W and module efficiency up to 25.91%.
July 2026: Tongwei moved its TNC 3.0-G12 750 W module into mass production, with mass-production efficiency above 24.14% and bifaciality around 90%.
June 2026: Canadian Solar launched its TOPCon 3.0 module with power output up to 670 W and efficiency up to 24.8%, with global mass shipments scheduled from August 2026.
June 2026: AIKO unveiled its fourth-generation INFINITE ULTRA back-contact module with mass-production power in the 690 W range and efficiency up to 25.6%.
March 2026: Trinasolar upgraded the Vertex N G3 platform to as much as 760 W using its n-type TOPCon Ultra technology, with large-scale commercialization targeted during 2026.
2026: LONGi accelerated back-contact commercialization, reporting 19.55 GW of BC module sales in the first half of 2026 and a BC shipment mix above 65%.
Market Outlook
The monocrystalline solar panel market is expected to expand steadily through 2031 as solar remains one of the fastest-deployable sources of new electricity capacity. Shipment growth should outpace revenue growth because ongoing manufacturing scale and efficiency improvements continue to reduce the cost per watt. The market is therefore expected to add value primarily through higher annual deployment, premium technology adoption and regional price differentiation rather than sustained module-price inflation.
N-type architectures will dominate the technology mix, with TOPCon retaining the largest share while back-contact and heterojunction products expand in premium and space-constrained applications. Utility-scale projects will remain the largest demand pool, but distributed rooftop markets will continue to create attractive premium segments for high-efficiency modules with strong aesthetics, low degradation and enhanced safety.
Competition will remain intense. Manufacturers with strong balance sheets, high utilization, bankable product histories, advanced cell roadmaps and diversified manufacturing footprints are better positioned to navigate low-margin periods. The next phase of market development is likely to favor suppliers that can combine very high efficiency with reliable mass production, supply-chain traceability and region-specific manufacturing strategies.
Global Monocrystalline Solar Panel Market Scope:
| Report Metric | Details |
|---|---|
| Total Market Size in 2026 | USD 80.60 billion |
| Total Market Size in 2025 | USD 103.90 billion |
| Forecast Unit | USD Billion |
| Growth Rate | 5.21% |
| Study Period | 2021 to 2025 |
| Historical Data | 2021 to 2024 |
| Base Year | 2025 |
| Forecast Period | 2026 – 2025 |
| Segmentation | Type, Power, End User, Geography |
| Companies |
|
Market Segmentation
By Type
N-Type
TOPCon
Heterojunction
Back Contact and Other N-Type
P-Type
By Power
Up to 100 Watts
100 to 200 Watts
Above 200 Watts
By End User
Utility-Scale
Commercial and Industrial
Residential
Other Distributed Applications
By Geography
North America
United States
Canada
Mexico
South America
Brazil
Chile
Others
Europe
Germany
Spain
Italy
France
United Kingdom
Others
Middle East and Africa
Saudi Arabia
UAE
South Africa
Others
Asia Pacific
China
India
Japan
South Korea
Australia
Southeast Asia
Others
Table of Contents
1. INTRODUCTION
1.1. Market Overview
1.2. Market Definition
1.3. Scope of the Study
1.4. Market Segmentation
1.5. Currency
1.6. Assumptions
1.7. Base and Forecast Years Timeline
1.8. Key Benefits to Stakeholders
2. RESEARCH METHODOLOGY
2.1. Research Design
2.2. Secondary Research
2.3. Primary Validation
2.4. Market Estimation and Forecasting
2.5. Data Triangulation and Quality Control
3. EXECUTIVE SUMMARY
3.1. Key Findings
3.2. Global Market Size, 2026-2031
3.3. Technology and Application Summary
3.4. Regional Opportunity Summary
4. MARKET DYNAMICS
4.1. Market Drivers
4.1.1. Record Global Solar Deployment
4.1.2. Falling System Costs and Higher Energy Yield
4.1.3. Electricity Demand Growth and Data-Center Loads
4.1.4. Manufacturing Localization and Industrial Policy
4.2. Market Restraints
4.2.1. Persistent Manufacturing Overcapacity
4.2.2. Volatile Module Pricing
4.2.3. Trade Barriers and Supply-Chain Fragmentation
4.2.4. Grid Constraints and Curtailment
4.3. Porter’s Five Forces Analysis
4.4. Industry Value Chain Analysis
5. MONOCRYSTALLINE SOLAR PANEL MARKET BY TYPE
5.1. Introduction
5.2. N-Type
5.2.1. TOPCon
5.2.2. Heterojunction
5.2.3. Back Contact and Other N-Type
5.3. P-Type
6. MONOCRYSTALLINE SOLAR PANEL MARKET BY POWER
6.1. Introduction
6.2. Up to 100 Watts
6.3. 100 to 200 Watts
6.4. Above 200 Watts
7. MONOCRYSTALLINE SOLAR PANEL MARKET BY END USER
7.1. Introduction
7.2. Utility-Scale
7.3. Commercial and Industrial
7.4. Residential
7.5. Other Distributed Applications
8. MONOCRYSTALLINE SOLAR PANEL MARKET BY GEOGRAPHY
8.1. Introduction
8.2. North America
8.2.1. United States
8.2.2. Canada
8.2.3. Mexico
8.3. South America
8.3.1. Brazil
8.3.2. Chile
8.3.3. Others
8.4. Europe
8.4.1. Germany
8.4.2. Spain
8.4.3. Italy
8.4.4. France
8.4.5. United Kingdom
8.4.6. Others
8.5. Middle East and Africa
8.5.1. Saudi Arabia
8.5.2. UAE
8.5.3. South Africa
8.5.4. Others
8.6. Asia Pacific
8.6.1. China
8.6.2. India
8.6.3. Japan
8.6.4. South Korea
8.6.5. Australia
8.6.6. Southeast Asia
8.6.7. Others
9. COMPETITIVE ENVIRONMENT AND ANALYSIS
9.1. Major Players and Strategy Analysis
9.2. Technology Positioning
9.3. Manufacturing Footprint and Supply-Chain Strategy
9.4. Market Share Analysis
9.5. Mergers, Acquisitions, Agreements and Partnerships
9.6. Competitive Dashboard
10. COMPANY PROFILES
10.1. JinkoSolar Holding Co., Ltd.
10.2. LONGi Green Energy Technology Co., Ltd.
10.3. Trina Solar Co., Ltd.
10.4. JA Solar Technology Co., Ltd.
10.5. Canadian Solar Inc.
10.6. Astronergy / Chint New Energy Technology Co., Ltd.
10.7. Tongwei Co., Ltd.
10.8. Risen Energy Co., Ltd.
10.9. DAS Solar Co., Ltd.
10.10. GCL System Integration Technology Co., Ltd.
10.11. Hanwha Qcells
10.12. AIKO Solar
10.13. Waaree Energies Limited
10.14. Adani Solar / Adani New Industries Limited
10.15. Vikram Solar Limited
11. APPENDIX
11.1. Currency
11.2. Assumptions
11.3. Base and Forecast Years Timeline
11.4. Abbreviations
Navigate
Trusted by the world's leading organizations