
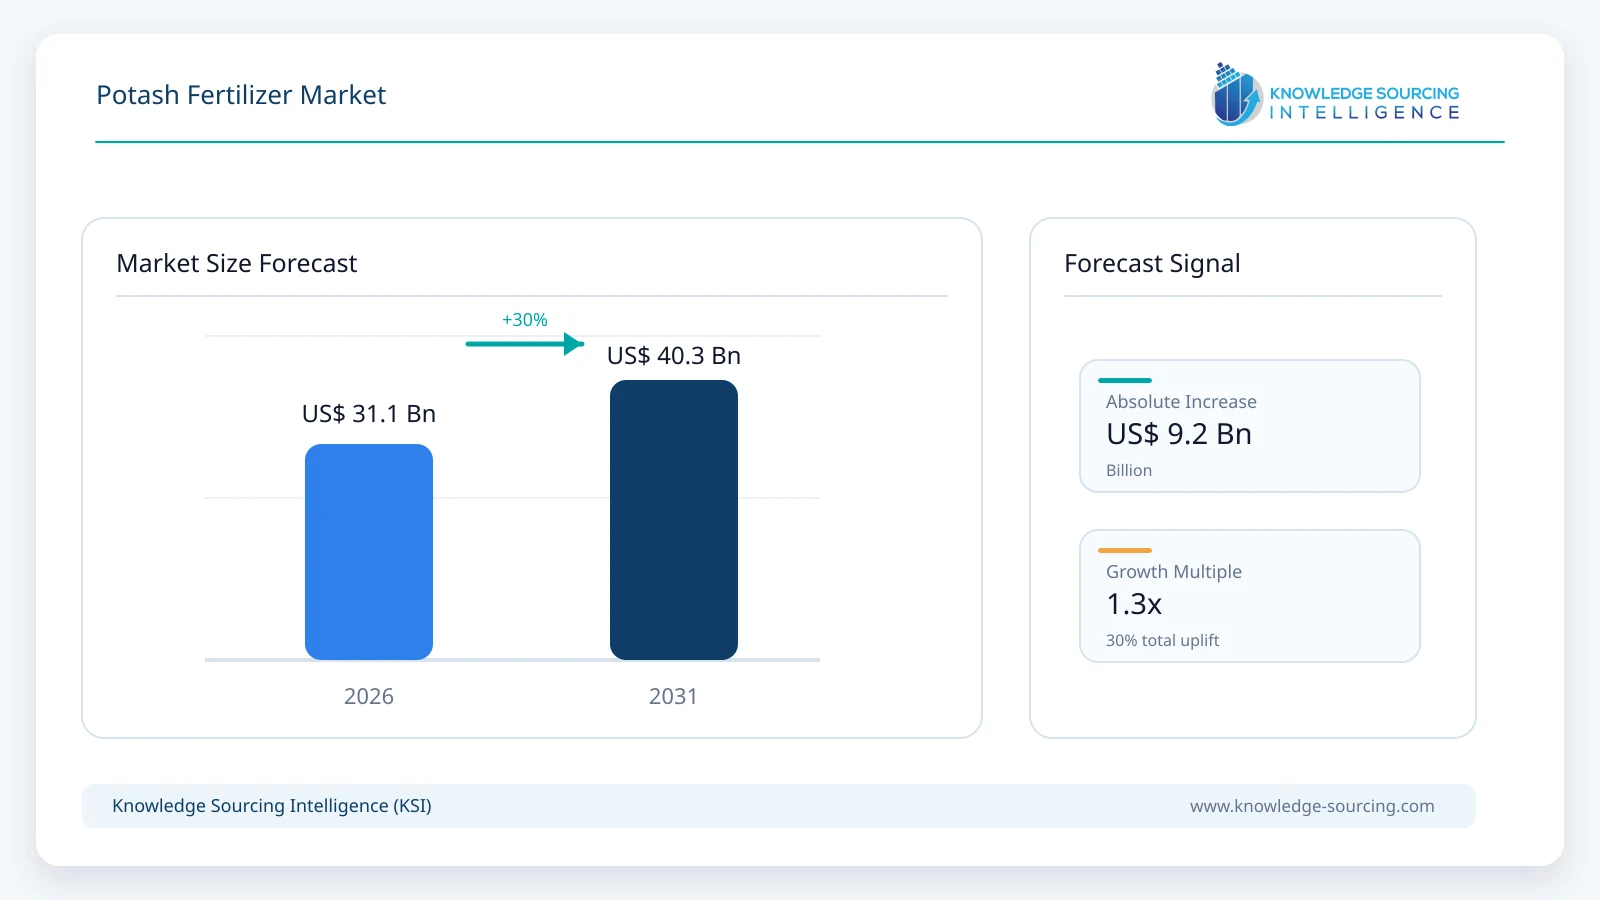
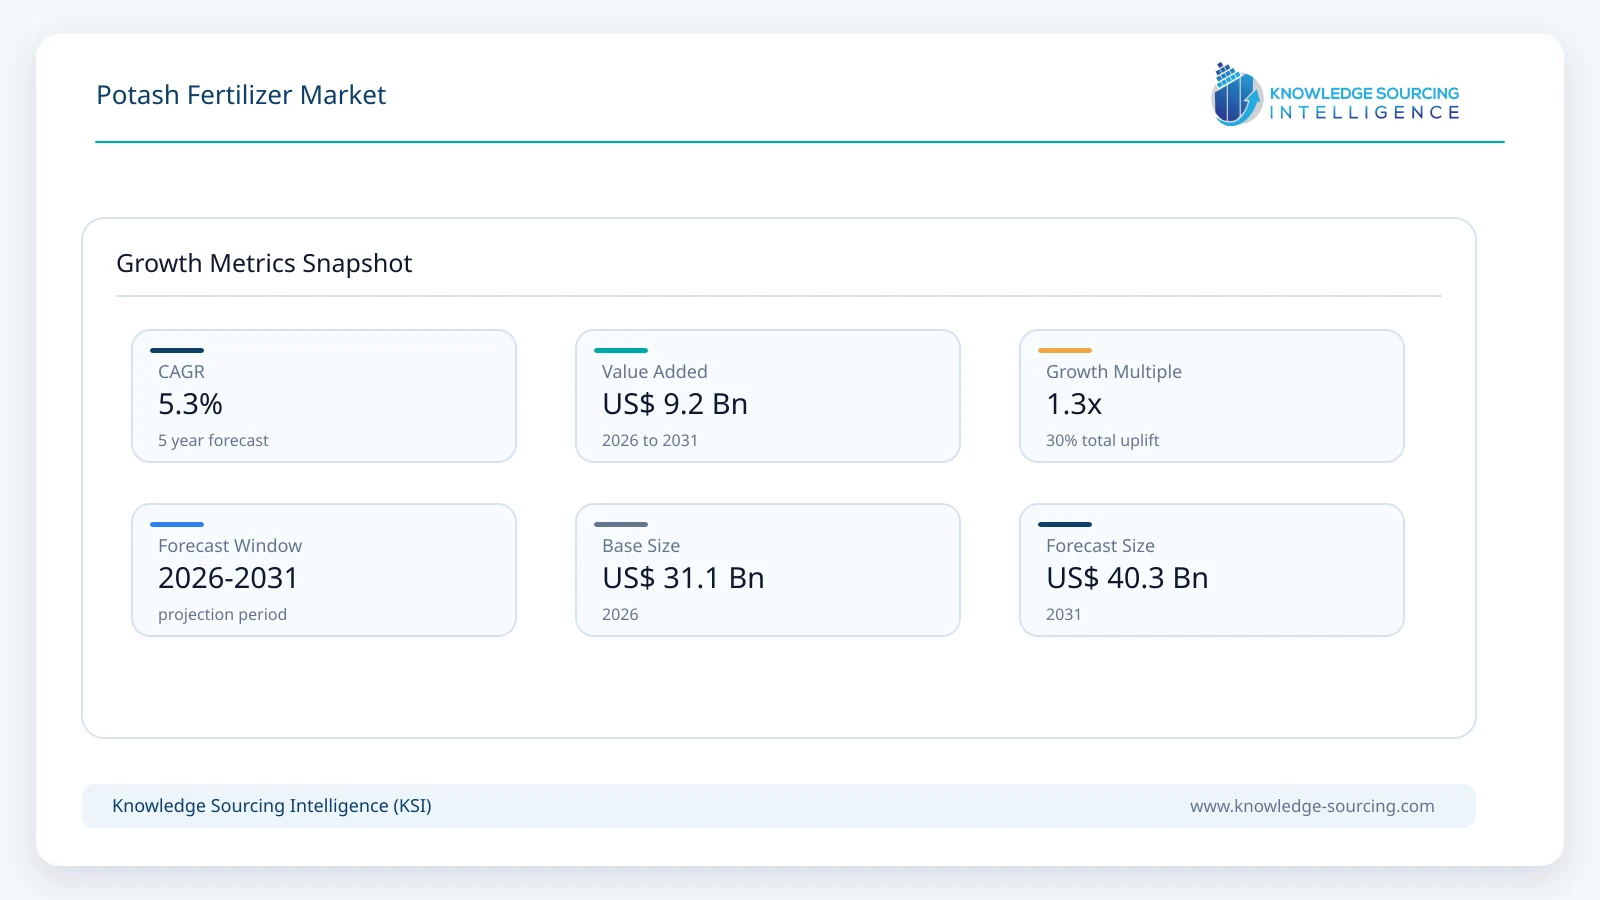
The global potash fertilizer market is estimated at USD 31.08 billion in 2026 and is projected to reach USD 40.30 billion by 2031, representing a CAGR of approximately 5.3% during the forecast period.
Highlights:
- 1Global potash shipments are expected to reach approximately 74-77 million tonnes in 2026.
- 2Muriate of potash remains the dominant product because of its scale, nutrient concentration and cost efficiency.
- 3Brazil, China, India and North America remain the most important demand centers for global potash trade.
- 4Specialty potassium fertilizers gain share in chloride-sensitive crops, fertigation and high-value horticulture.
- 5BHP's Jansen Stage 1 is scheduled to begin production in mid-2027, adding major Canadian supply.
- 6Potash prices strengthened in 2026 but face longer-term pressure from new capacity and improved export availability.
Potassium is one of the three primary crop nutrients alongside nitrogen and phosphorus and supports water regulation, enzyme activity, nutrient transport, root development and crop quality. Potash demand is therefore tied closely to planted area, crop prices, farmer profitability, soil nutrient balances and the relative affordability of potassium versus nitrogen and phosphate fertilizers. Unlike nitrogen, potash production is concentrated in a small number of geological basins and brine systems, particularly in Canada, Russia, Belarus, China, Israel, Jordan and Germany. This concentration makes trade flows and logistics especially important to regional fertilizer availability.
Market conditions improved during 2026. Nutrien maintained its forecast of 74-77 million tonnes of global potash shipments and reported record first-half potash sales volumes and production. ICL reported a realized potash price of USD 362 per tonne in the first quarter and USD 376 per tonne in the second quarter, with higher sales volumes to China, India and Brazil. The World Bank reported MOP prices more than 5% higher quarter on quarter in the first quarter of 2026 and nearly 17% higher year over year, supported by healthy demand and fertilizer-market tightness.
The medium-term market is nonetheless moving toward a better-supplied structure. Belarusian exports have increased through alternative logistics routes, Russian supply remains important, Canadian producers are investing in capacity, and BHP's Jansen Stage 1 is planned to start production in mid-2027. Once both Jansen stages are fully ramped, combined output is expected to reach approximately 8.5 million tonnes per year. These additions support long-term shipment growth but can cap benchmark-price inflation, making volume, operating cost and product mix more important determinants of producer revenue.
Market Trends
Canadian Capacity Is Becoming the Main Source of New Global Supply
Canada already holds the world's largest potash production base and is becoming even more important to incremental supply. Nutrien continues to operate a large Saskatchewan network and is investing in mine automation and targeted brownfield optimization. K+S is expanding capacity at its Bethune operation, while BHP's Jansen Stage 1 is expected to start production in mid-2027 and produce approximately 4.15 million tonnes annually once ramped. Jansen Stage 2 is expected to add a further 4.36 million tonnes annually later in the forecast period. This expansion improves long-term supply security but increases competitive pressure on higher-cost producers.
Specialty Potassium Products Are Growing Faster Than Standard MOP
MOP remains the largest product by volume, but chloride-sensitive crops and intensive horticulture create stronger growth for SOP, potassium nitrate, SOPM and soluble specialty formulations. These products are used in fruits, vegetables, greenhouse crops, fertigation and other high-value systems where chloride exposure, solubility or nutrient balance matters more than lowest cost per unit of potassium. ICL, SQM, Compass Minerals, Haifa Group and Migao Group all participate in specialty potassium fertilizers alongside conventional potash producers.
Potash Trade Is Rebalancing as Sanctions and Logistics Routes Evolve
Russia and Belarus remain major potash suppliers despite trade restrictions imposed after 2022. The World Bank reported that Belarusian exports were increasing again in 2026 as U.S. restrictions eased, while alternative routes continued to support shipments despite European restrictions. This adds supply back into the global system and reduces the extreme tightness seen earlier in the decade. Buyers in Brazil, China and India are also diversifying contract sources, which increases competition among Canadian, Russian, Belarusian, Middle Eastern and Chinese suppliers.
Fertigation and Precision Nutrient Management Increase Product Differentiation
Potassium application is becoming more targeted in high-value agriculture. Water-soluble potassium nitrate, SOP and liquid potassium products can be applied through fertigation, foliar systems and precision nutrient programs. Haifa Group, SQM, ICL and other specialty suppliers market potassium products specifically for greenhouse, orchard and irrigated systems. The shift does not materially reduce demand for bulk MOP, but it raises the value contribution of specialty formulations and creates opportunities for differentiated products with low chloride, high solubility or controlled nutrient release.
Market Drivers
Crop Nutrient Replenishment Supports Potash Demand
Potassium removal from soil increases with crop harvest, and farmers must replenish this nutrient to maintain yields and soil fertility. Nutrien linked its 2026 outlook to nutrient replenishment following a record crop and low inventory levels in key markets such as China and Brazil. When grain and oilseed economics remain supportive, farmers are less likely to defer potash applications because prolonged under-application can reduce yield potential and weaken soil potassium balances.
Brazil, India and Other Agricultural Growth Markets Drive Incremental Consumption
Brazil is a major potash importer because its large soybean, corn and sugarcane sectors operate on potassium-demanding soils with limited domestic production. India also depends heavily on imported MOP and uses fertilizer subsidies to manage affordability for farmers. China combines large domestic output with substantial imports, while Southeast Asia requires potash for oil palm and plantation crops. These growth markets offset slower demand expansion in mature agricultural regions.
High-Value Horticulture Expands Demand for Chloride-Free Potassium
Fruits, vegetables, greenhouse crops, tobacco and several specialty crops are more sensitive to chloride or require highly soluble nutrient sources. This supports SOP, potassium nitrate and other premium potassium fertilizers. These products sell at substantially higher prices per tonne than standard MOP and therefore contribute disproportionately to market-value growth even though they represent a smaller share of total potassium nutrient volume.
Market Restraints
Concentrated Supply, Price Volatility and New Capacity Create Cyclical Risk
Potash is structurally concentrated among a relatively small group of producers, exposing buyers to operational outages, sanctions and logistics constraints. At the same time, major new projects can quickly shift the market from tightness toward oversupply because individual mines are very large. The World Bank expects MOP prices to rise in 2026 but ease in 2027 as supply improves. BHP's Jansen project, Canadian brownfield expansions and stronger Belarusian exports reinforce the risk that future volume growth is partly offset by lower benchmark prices.
Global Potash Fertilizer Market Segment Analysis
By Type
Muriate of Potash / Potassium Chloride
Muriate of potash is estimated at approximately USD 23.0 billion in 2026 and remains the largest product segment. MOP typically contains around 60% potassium oxide equivalent and is the lowest-cost potassium source for broad-acre crops. It dominates wheat, corn, soybean, rice, oilseed and plantation applications where chloride tolerance is acceptable. SOP, potassium nitrate and other specialty fertilizers are smaller but grow faster because they serve chloride-sensitive crops, fertigation and high-value horticulture.
By Form
Solid
Solid products account for more than 90% of global potash fertilizer value in 2026 because MOP, SOP, potassium nitrate and most compound potassium fertilizers are shipped as granules, crystals or powder. Liquid potassium products such as potassium thiosulfate remain a smaller segment used in fertigation, foliar nutrition and specialty programs. Liquid products can grow faster from a small base, but bulk solid fertilizer remains structurally dominant because of storage, shipping and nutrient-density economics.
By Crop Type
Cereals and Grains
Cereals and grains are estimated at approximately USD 12.0 billion in 2026 and represent the largest crop segment because wheat, corn, rice and other staple crops cover very large global acreage. Fruits and vegetables generate a smaller nutrient-volume base but higher use of premium SOP and potassium nitrate, making them strategically important to specialty suppliers. Oilseeds, pulses, plantation crops and other agricultural uses form the remaining market.
By Geography
Asia Pacific
Asia Pacific is the largest regional consumption market, supported by China, India, Indonesia and other high-intensity agricultural economies. China combines domestic production with imports, while India is a major MOP importer and manages farmer affordability through fertilizer policy.
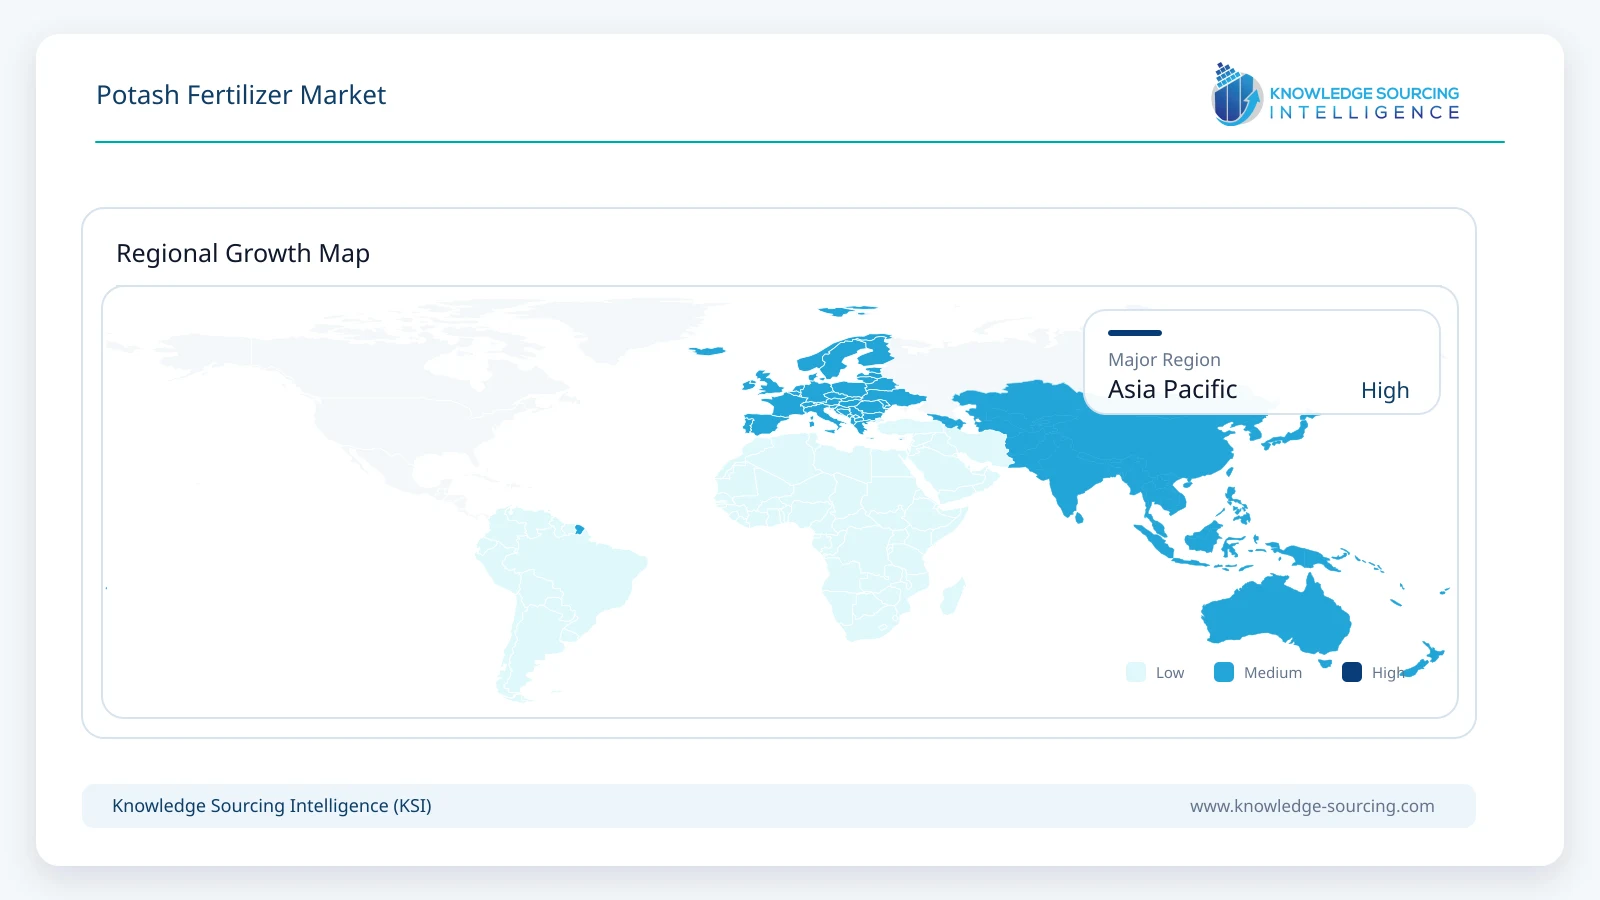
North America is strategically dominant on the production side because Canada is the world's largest potash source and exporter. South America, led by Brazil, remains one of the most important import-dependent demand regions and strongly influences seaborne trade and pricing.
Competitive Environment
The market is concentrated among large mining companies with long-life deposits and high barriers to entry. Nutrien, Mosaic, Uralkali, Belaruskali, K+S, EuroChem, ICL and Arab Potash form the core large-scale producer group. Nutrien remains the largest producer by capacity and expects potash sales volumes of 14.1-14.8 million tonnes in 2026. K+S is expanding Bethune in Canada, ICL expects 4.5-4.7 million tonnes of potash sales in 2026, and Arab Potash operates approximately 2.5 million tonnes of annual production capacity from Dead Sea brines.
Recent Developments
August 2026: Nutrien reported record first-half potash sales volumes and production and maintained its global 2026 shipment forecast of 74-77 million tonnes.
August 2026: ICL reported a second-quarter potash price of USD 376 per tonne and higher sales volumes to China, India and Brazil.
August 2026: K+S reported that capacity expansion at its Bethune potash operation in Canada continued according to plan.
June 2026: BHP increased the Stage 2 Jansen investment estimate to USD 6.9 billion and confirmed first production for that stage in late FY2031.
First quarter 2026: Arab Potash Company produced approximately 760 thousand tonnes and sold approximately 786 thousand tonnes of potash.
Global Potash Fertilizer Market Scope:
| Report Metric | Details |
|---|---|
| Total Market Size in 2026 | USD 31.08 billion |
| Total Market Size in 2031 | USD 40.30 billion |
| Forecast Unit | Billion |
| Growth Rate | 5.3% |
| Study Period | 2021 to 2031 |
| Historical Data | 2021 to 2024 |
| Base Year | 2025 |
| Forecast Period | 2026 – 2031 |
| Segmentation | Type, Form, Crop Type, Geography |
| Companies |
|
Market Segmentation
By Type
Muriate of Potash / Potassium Chloride
Sulfate of Potash
Potassium Nitrate
Sulfate of Potash Magnesia
Other Potassium Fertilizers
By Form
Solid
Liquid
By Crop Type
Cereals and Grains
Fruits and Vegetables
Oilseeds and Pulses
Plantation and Other Crops
By Geography
North America
United States
Canada
Mexico
South America
Brazil
Argentina
Others
Europe
Germany
United Kingdom
France
Spain
Italy
Others
Middle East & Africa
Jordan
Israel
South Africa
Others
Asia Pacific
China
India
Indonesia
Thailand
Vietnam
Malaysia
Others
Table of Contents
1. EXECUTIVE SUMMARY
2. MARKET SNAPSHOT
2.1. Market Overview
2.2. Market Definition
2.3. Scope of the Study
2.4. Market Segmentation
3. BUSINESS LANDSCAPE
3.1. Market Drivers
3.1.1. Crop Nutrient Replenishment Supports Potash Demand
3.1.2. Brazil, India and Other Agricultural Growth Markets Drive Incremental Consumption
3.1.3. High-Value Horticulture Expands Demand for Chloride-Free Potassium
3.2. Market Restraints
3.2.1. Concentrated Supply, Price Volatility and New Capacity Create Cyclical Risk
3.3. Market Opportunities
3.4. Porter's Five Forces Analysis
3.5. Industry Value Chain Analysis
3.6. Policies, Subsidies and Trade Environment
3.7. Strategic Recommendations
4. TECHNOLOGICAL OUTLOOK
4.1. Conventional Underground Potash Mining
4.2. Solution Mining
4.3. Brine and Solar Evaporation Processing
4.4. Granulation and Compaction
4.5. Water-Soluble and Fertigation-Grade Potassium Fertilizers
4.6. Mine Automation and Energy Efficiency
5. GLOBAL POTASH FERTILIZER MARKET BY TYPE
5.1. Introduction
5.2. Muriate of Potash / Potassium Chloride
5.3. Sulfate of Potash
5.4. Potassium Nitrate
5.5. Sulfate of Potash Magnesia
5.6. Other Potassium Fertilizers
6. GLOBAL POTASH FERTILIZER MARKET BY FORM
6.1. Introduction
6.2. Solid
6.3. Liquid
7. GLOBAL POTASH FERTILIZER MARKET BY CROP TYPE
7.1. Introduction
7.2. Cereals and Grains
7.3. Fruits and Vegetables
7.4. Oilseeds and Pulses
7.5. Plantation and Other Crops
8. GLOBAL POTASH FERTILIZER MARKET BY GEOGRAPHY
8.1. Introduction
8.2. North America
8.2.1. United States
8.2.2. Canada
8.2.3. Mexico
8.3. South America
8.3.1. Brazil
8.3.2. Argentina
8.3.3. Others
8.4. Europe
8.4.1. Germany
8.4.2. United Kingdom
8.4.3. France
8.4.4. Spain
8.4.5. Italy
8.4.6. Others
8.5. Middle East & Africa
8.5.1. Jordan
8.5.2. Israel
8.5.3. South Africa
8.5.4. Others
8.6. Asia Pacific
8.6.1. China
8.6.2. India
8.6.3. Indonesia
8.6.4. Thailand
8.6.5. Vietnam
8.6.6. Malaysia
8.6.7. Others
9. COMPETITIVE ENVIRONMENT AND ANALYSIS
9.1. Major Producers and Strategy Analysis
9.2. MOP versus Specialty Potassium Positioning
9.3. Production Capacity, Cost and Logistics Position
9.4. New Projects and Brownfield Expansion
9.5. Competitive Dashboard
10. COMPANY PROFILES
10.1. Nutrien Ltd.
10.2. The Mosaic Company
10.3. K+S Aktiengesellschaft
10.4. ICL Group Ltd.
10.5. Uralkali PJSC
10.6. Belaruskali JSC
10.7. EuroChem Group AG
10.8. Arab Potash Company
10.9. Compass Minerals International, Inc.
10.10. Intrepid Potash, Inc.
10.11. Sociedad Química y Minera de Chile S.A. (SQM)
10.12. Qinghai Salt Lake Industry Co., Ltd.
10.13. SDIC Luobupo Potash Co., Ltd.
10.14. Migao Group Holdings Limited
10.15. Haifa Group
11. APPENDIX
11.1. Currency
11.2. Assumptions
11.3. Base and Forecast Years Timeline
11.4. Key Benefits for Stakeholders
11.5. Research Methodology
11.6. Abbreviations
Navigate
Trusted by the world's leading organizations











