Report Overview
Surgery Tables Market Size:
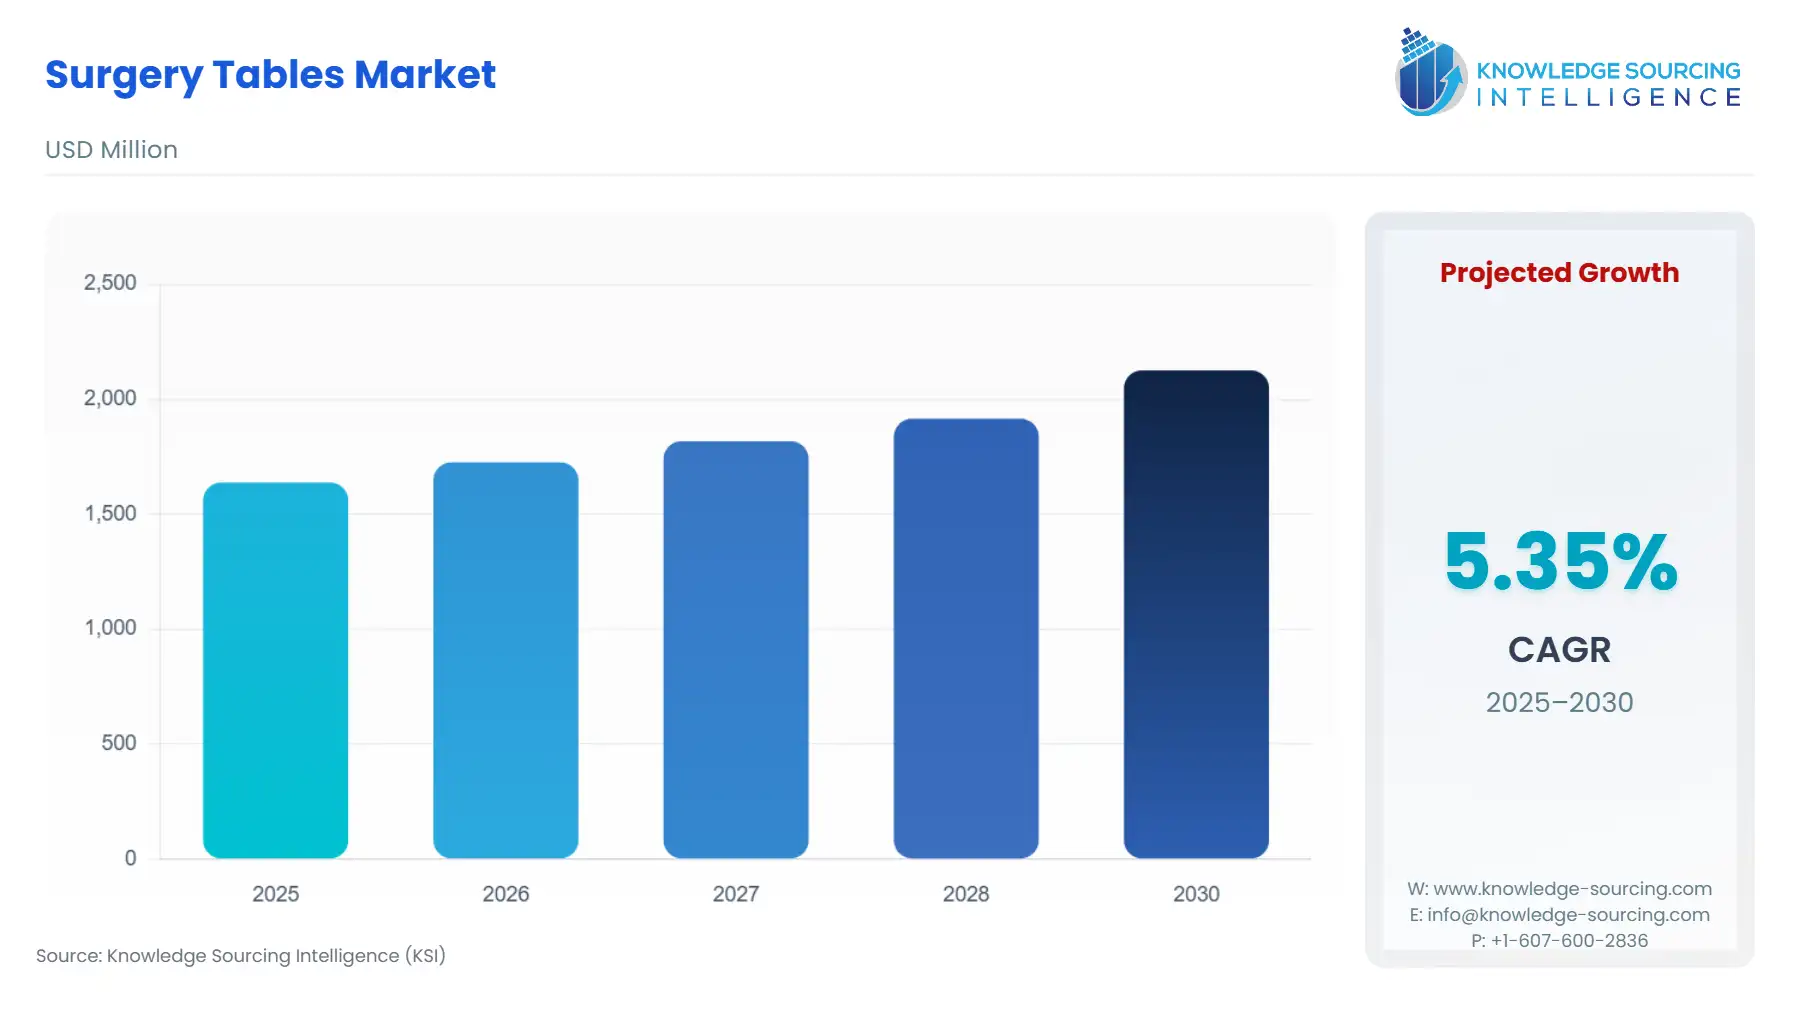
The Surgery Tables Market is projected to expand from USD 1.638 billion in 2025 to USD 2.126 billion in 2030, at a CAGR of 5.36%.
Highlights:
- 1Surging Surgical VolumesRising chronic diseases and trauma cases drive demand for surgical tables (American Heart Association, 2024).
- 2Technological InnovationsAdvanced powered and hybrid tables enhance precision and imaging compatibility (Stryker, 2023).
- 3Healthcare Infrastructure GrowthEmerging markets like India and China expand facilities, boosting table demand (India Ministry of Health, 2024).
- 4Cost and Skill BarriersHigh costs and workforce shortages limit adoption in developing regions (WHO, 2023).
The surgery tables market is a vital segment of the global healthcare equipment industry, providing essential infrastructure for operating rooms across hospitals, ambulatory surgery centers, and specialized clinics. These tables, also known as operating tables, are sophisticated medical devices designed to position patients optimally during surgical procedures, ensuring precision, safety, and accessibility for surgeons.
As healthcare systems worldwide evolve to meet the demands of growing populations, aging demographics, and advancements in surgical techniques, the surgery tables market has become a dynamic and rapidly expanding sector. This introduction provides an in-depth overview of the market, tailored for industry experts, focusing on key trends, drivers, restraints, and segment-specific insights, supported by recent developments and data from credible sources. The analysis also includes regional perspectives and detailed segmentation by type, material, technology, and end-user, reflecting the market’s complexity and growth potential.
Surgery Tables Market Overview:
Surgical tables are specialized platforms that support patients during a wide range of procedures, from routine general surgeries to complex interventions in neurology, urology, and imaging-guided operations. These tables are engineered for flexibility, stability, and compatibility with advanced medical technologies, such as imaging systems and robotic surgery platforms. The market encompasses a variety of table types, materials, and technologies, each tailored to specific surgical needs. In recent years, the global demand for surgical tables has surged, driven by an increase in surgical procedures, technological innovations, and the expansion of healthcare infrastructure in both developed and emerging economies. According to the World Health Organization (WHO), approximately 313 million surgical procedures are performed annually worldwide, underscoring the critical role of surgical tables in modern healthcare (WHO, 2024).
The market is characterized by rapid technological advancements, including the integration of motorized adjustments, radiolucent materials, and hybrid functionalities that support minimally invasive and image-guided surgeries. These innovations have transformed surgical tables from basic platforms into multifunctional systems that enhance surgical precision and patient outcomes. As healthcare providers prioritize efficiency, safety, and patient comfort, the demand for advanced surgical tables continues to grow, creating opportunities for manufacturers to innovate and capture market share.
Surgery Tables Market Growth Drivers:
- Rising Volume of Surgical Procedures
The global increase in surgical procedures is a primary driver of the surgery tables market. Factors such as the rising prevalence of chronic diseases, including cardiovascular conditions, cancer, and neurological disorders, have led to a higher demand for surgical interventions. For instance, the American Cancer Society reported an estimated 2 million new cancer cases in the United States alone in 2024, many requiring surgical treatment (American Cancer Society, 2024). Additionally, the growing incidence of trauma and injury cases, particularly in regions with high accident rates, further fuels the need for operating room equipment, including surgical tables.
- Technological Advancements in Surgical Tables
Innovations in surgical table design, such as powered and hybrid tables with imaging compatibility, are driving market growth. Manufacturers are incorporating features like motorized height adjustments, tilt capabilities, and carbon fiber tabletops that enable real-time imaging during procedures. For example, in April 2022, Hill-Rom Holdings, Inc. introduced the PST 500 precision surgical table, designed to support complex procedures with enhanced imaging capabilities (Hill-Rom, 2022). These advancements improve surgical precision, reduce procedure times, and enhance patient safety, making them highly sought after in modern operating rooms.
- Expansion of Healthcare Infrastructure
The global expansion of healthcare facilities, particularly in emerging economies, is a significant market driver. Governments and private sectors are investing heavily in building new hospitals and ambulatory surgery centers (ASCs) to address growing healthcare needs. For instance, China’s healthcare infrastructure expansion includes plans to add thousands of new hospital beds by 2027, increasing the demand for advanced surgical equipment (China National Health Commission, 2024). This trend is particularly pronounced in regions with rising medical tourism, such as Asia Pacific, where countries like India and Thailand are becoming hubs for affordable, high-quality surgical care.
Surgery Tables Market Restraints:
- High Cost of Advanced Surgical Tables
The high cost of technologically advanced surgical tables, particularly those made from composite materials or equipped with powered and hybrid functionalities, is a significant restraint. These tables require substantial investment, which can be a barrier for healthcare facilities in low- and middle-income countries. The cost of composite tables, often made from carbon fiber, is notably higher than traditional metal tables due to specialized manufacturing processes, limiting their adoption in resource-constrained settings.
- Shortage of Skilled Personnel
The operation of sophisticated surgical tables requires trained personnel, and a shortage of skilled professionals, particularly in emerging economies, poses a challenge. Advanced features like motorized adjustments and imaging integration demand technical expertise, and the lack of adequate training programs can hinder effective utilization. This issue is particularly acute in regions like Sub-Saharan Africa, where healthcare workforce shortages are well-documented (WHO, 2023).
Surgery Tables Market Segmentation Analysis:
Segmentation by Type
- General Surgery Tables
General surgery tables dominate the market due to their versatility and widespread use in procedures such as cardiovascular, gynecological, and ENT surgeries. These tables are designed to accommodate a broad range of surgical positions, making them essential in hospitals and ASCs. The high volume of general surgeries, which account for approximately 20% of all surgical procedures globally, drives demand for these tables (Australian Institute of Health and Welfare, 2023). Recent developments, such as the launch of ALVO Medical’s ALVO Rapsodia table in February 2022, highlight the focus on multifunctional designs that support multiple surgical disciplines (ALVO Medical, 2022).
- Neurology Tables
Neurology tables are specialized for procedures involving the brain and spinal cord, requiring precise patient positioning and compatibility with imaging systems like MRI and CT scanners. The increasing prevalence of neurological disorders, such as Parkinson’s disease and epilepsy, is driving demand for these tables. According to the World Health Organization, neurological conditions affect over 1 billion people globally, necessitating advanced surgical interventions (WHO, 2024). Innovations like Getinge’s Maquet Magnus table, designed for neurosurgery with integrated imaging, are gaining traction in this segment (Getinge, 2023).
- Imaging Tables
Imaging tables, often equipped with radiolucent materials like carbon fiber, are critical for procedures requiring real-time visualization, such as cardiovascular and orthopedic surgeries. The growing adoption of minimally invasive techniques, which rely heavily on imaging, is boosting demand for these tables. For instance, Siemens Healthineers introduced a radiolucent imaging table in 2023 that supports seamless integration with C-arm systems, enhancing procedural accuracy (Siemens Healthineers, 2023). This segment is expected to see significant growth due to the rising emphasis on precision surgery.
Segmentation by Material
- Metal Surgical Tables
Metal surgical tables, typically made from stainless steel, are valued for their durability and stability. They are widely used in hospitals and ASCs due to their cost-effectiveness and ease of maintenance. Metal tables accounted for a significant market share in 2023, driven by their widespread adoption in general surgery settings. Their robust construction ensures patient safety during complex procedures, making them a preferred choice in high-volume surgical environments.
- Composite Surgical Tables
Composite surgical tables, often constructed from carbon fiber, offer superior radiolucent properties, making them ideal for imaging-guided procedures. These tables are lighter and more flexible than metal tables but come with a higher price tag, limiting their adoption in budget-constrained facilities. The demand for composite tables is growing in developed markets like North America, where advanced imaging technologies are prevalent.
Segmentation by Technology
- Powered Surgical Tables
Powered surgical tables, which include electric and hydraulic models, dominate the market due to their flexibility and ease of use. These tables allow precise adjustments through motor-driven functions, reducing the physical burden on surgical teams. In 2023, powered tables accounted for over 60% of the market share, driven by their adoption in advanced healthcare facilities (Grand View Research, 2023). Battery-operated models, which eliminate the need for electrical cords, are particularly popular in ASCs.
- Hybrid Surgical Tables
Hybrid surgical tables, combining powered adjustments with imaging compatibility, are gaining popularity in advanced surgical settings. These tables support complex procedures like neurosurgery and cardiovascular interventions by integrating with imaging devices such as C-arms and CT scanners. The increasing focus on minimally invasive and image-guided surgeries is driving growth in this segment, with companies like Getinge leading innovation (Getinge, 2023).
Segmentation by End-User
- Hospitals
Hospitals are the largest end-user segment, driven by the high volume of surgical procedures performed in these settings. The expansion of hospital infrastructure, particularly in emerging markets, is fueling demand for surgical tables. For example, India’s hospital sector is projected to grow significantly by 2026, driven by government initiatives like Ayushman Bharat (India Ministry of Health, 2024).
- Ambulatory Surgery Centers (ASCs)
ASCs are experiencing rapid growth due to the rising preference for same-day surgeries, which offer cost savings and reduced wait times. In the U.S., the number of ASCs exceeded 5,500 in 2021, and this trend is continuing, driving demand for compact, versatile surgical tables (Medicare Payment Advisory Commission, 2021). Powered and hybrid tables are particularly popular in ASCs due to their efficiency.
Surgery Tables Market Regional Analysis:
- North America
North America, led by the United States, holds the largest share of the surgical tables market, driven by advanced healthcare infrastructure and high surgical volumes. The region’s aging population and high prevalence of chronic diseases, such as cardiovascular disorders (affecting over 120 million Americans), contribute to market growth (CDC, 2024). The adoption of advanced technologies, such as hybrid and imaging tables, is widespread, supported by significant investments in healthcare facilities. Canada and Mexico are also seeing growth, particularly in ASCs and medical tourism, respectively.
- Asia Pacific
Asia Pacific is the fastest-growing region, driven by rapid healthcare infrastructure development in countries like China, India, and Thailand. China’s healthcare reforms, including the addition of new hospitals, are boosting demand for surgical tables (China National Health Commission, 2024). India’s medical tourism sector, valued at over $9 billion in 2023, is driving investments in advanced surgical equipment (India Tourism Ministry, 2023). The region’s large patient pool and rising disposable incomes further accelerate market growth.
- Europe
Europe’s market is characterized by steady growth, driven by the adoption of advanced surgical tables in countries like Germany, the UK, and France. The region’s aging population and high prevalence of chronic diseases, such as cancer (4 million new cases annually), fuel demand (European Cancer Organization, 2024). However, a decline in the number of hospitals in some countries, like Germany, may temper growth compared to Asia Pacific. Innovations in hybrid tables and regulatory support from bodies like the European Medicines Agency are key growth drivers.
Surgery Tables Market Key Developments:
- Hill-Rom’s PST 500 Launch (2022): Hill-Rom introduced the PST 500 precision surgical table, designed for complex procedures with enhanced imaging capabilities, strengthening its market position (Hill-Rom, 2022).
- Getinge’s Partnership with IFC (2022): Getinge collaborated with the International Finance Corporation to improve access to medical supplies, including surgical tables, in Africa, expanding its global reach (Getinge, 2022).
- Siemens Healthineers’ Imaging Table (2023): Siemens launched a radiolucent imaging table compatible with C-arm systems, catering to the growing demand for minimally invasive surgeries (Siemens Healthineers, 2023).
List of Top Surgery Table Companies:
- Stryker
- Steris plc
- Getinge AB
- Hill-Rom Services Inc.
- Surgical Tables Inc.
Surgery Tables Market Scope:
| Report Metric | Details |
|---|---|
| Study Period | 2021 to 2031 |
| Historical Data | 2021 to 2024 |
| Base Year | 2025 |
| Forecast Period | 2026 – 2031 |
| Report Metric | Details |
| Surgery Tables Market Size in 2025 | US$1,191.196 million |
| Surgery Tables Market Size in 2030 | US$1,452.061 million |
| Growth Rate | CAGR of 4.04% |
| Study Period | 2020 to 2030 |
| Historical Data | 2020 to 2023 |
| Base Year | 2024 |
| Forecast Period | 2025 – 2030 |
| Forecast Unit (Value) | USD Million |
| Segmentation |
|
| Geographical Segmentation | North America, South America, Europe, Middle East and Africa, Asia Pacific |
| List of Major Companies in the Surgery Tables Market |
|
| Customization Scope | Free report customization with purchase |
Segmentation
- By Type
- General Surgery Tables
- Neurosurgery Tables
- Orthopedic Surgery Tables
- Urology and Cysto Tables
- Imaging Tables
- Cardiovascular Surgery Tables
- Radiolucent Tables
- Others
- By Material
- Stainless Steel
- Carbon Fiber
- By Technology
- Powered Surgical Tables
- Non-Powered Surgical Tables
- Hybrid Surgical Tables
- By End-User
- Hospitals
- Ambulatory Surgery Centres
- Specialty Clinics
- Others
- By Geography
- North America
- USA
- Canada
- Mexico
- South America
- Brazil
- Argentina
- Others
- Europe
- United Kingdom
- Germany
- France
- Italy
- Spain
- Others
- Middle East and Africa
- Saudi Arabia
- UAE
- Others
- Asia Pacific
- China
- Japan
- India
- South Korea
- Taiwan
- Thailand
- Indonesia
- Others
- North America
Our Best-Performing Industry Reports:
Navigation:
- Surgery Tables Market Size:
- Surgery Tables Market Key Highlights:
- Surgery Tables Market Overview:
- Surgery Tables Market Growth Drivers:
- Surgery Tables Market Restraints:
- Surgery Tables Market Segmentation Analysis:
- Surgery Tables Market Regional Analysis:
- Surgery Tables Market Key Developments:
- List of Top Surgery Table Companies:
- Surgery Tables Market Scope:
- Surgery Tables Market Segmentations:
- Our Best-Performing Industry Reports:
Page last updated on: September 11, 2025
Market Segmentation
By Type
By Material
By Technology
By End-user
By Geography
Table of Contents
1. EXECUTIVE SUMMARY
2. MARKET SNAPSHOT
2.1. Market Overview
2.2. Market Definition
2.3. Scope of the Study
2.4. Market Segmentation
3. BUSINESS LANDSCAPE
3.1. Market Drivers
3.2. Market Restraints
3.3. Market Opportunities
3.4. Porter’s Five Forces Analysis
3.5. Industry Value Chain Analysis
3.6. Policies and Regulations
3.7. Strategic Recommendations
4. TECHNOLOGICAL OUTLOOK
5. SURGICAL TABLES MARKET BY TYPE
5.1. Introduction
5.2. General Surgery Tables
5.3. Neurosurgery Tables
5.4. Orthopedic Surgery Tables
5.5. Urology and Cysto Tables
5.6. Imaging Tables
5.7. Cardiovascular Surgery Tables
5.8. Radiolucent Tables
5.9. Others
6. SURGICAL TABLES MARKET BY MATERIAL
6.1. Introduction
6.2. Stainless Steel
6.3. Carbon Fiber
7. SURGICAL TABLES MARKET BY TECHNOLOGY
7.1. Introduction
7.2. Powered Surgical Tables
7.3. Non-Powered Surgical Tables
7.4. Hybrid Surgical Tables
8. SURGICAL TABLES MARKET BY END-USER
8.1. Introduction
8.2. Hospitals
8.3. Ambulatory Surgery Centres
8.4. Specialty Clinics
8.5. Others
9. SURGICAL TABLES MARKET BY GEOGRAPHY
9.1. Introduction
9.2. North America
9.2.1. USA
9.2.2. Canada
9.2.3. Mexico
9.3. South America
9.3.1. Brazil
9.3.2. Argentina
9.3.3. Others
9.4. Europe
9.4.1. United Kingdom
9.4.2. Germany
9.4.3. France
9.4.4. Italy
9.4.5. Spain
9.4.6. Others
9.5. Middle East and Africa
9.5.1. Saudi Arabia
9.5.2. UAE
9.5.3. Others
9.6. Asia Pacific
9.6.1. China
9.6.2. Japan
9.6.3. India
9.6.4. South Korea
9.6.5. Taiwan
9.6.6. Thailand
9.6.7. Indosneisa
9.6.8. Others
10. COMPETITIVE ENVIRONMENT AND ANALYSIS
10.1. Major Players and Strategy Analysis
10.2. Market Share Analysis
10.3. Mergers, Acquisitions, Agreements, and Collaborations
10.4. Competitive Dashboard
11. COMPANY PROFILES
11.1. Stryker Corporation
11.2. Steris plc
11.3. Getinge AB
11.4. Hill-Rom Services Inc. (Baxter International Inc.)
11.5. Surgical Tables Inc.
11.6. Mizuho OSI
11.7. Barrfab
11.8. Lojer Oy
11.9. AMTAI Medical Equipment Inc.
11.10. Skytron LLC
11.11. ALVO Medical Sp. z.o.o.
11.12. Schaerer Medical USA, Inc.
11.13. Stille AB
11.14. Shenzhen Mindray Bio-Medical Electronics Co., Ltd.
12. RESEARCH METHODOLOGY
LIST OF FIGURES
LIST OF TABLES
Navigate
Trusted by the world's leading organizations


