
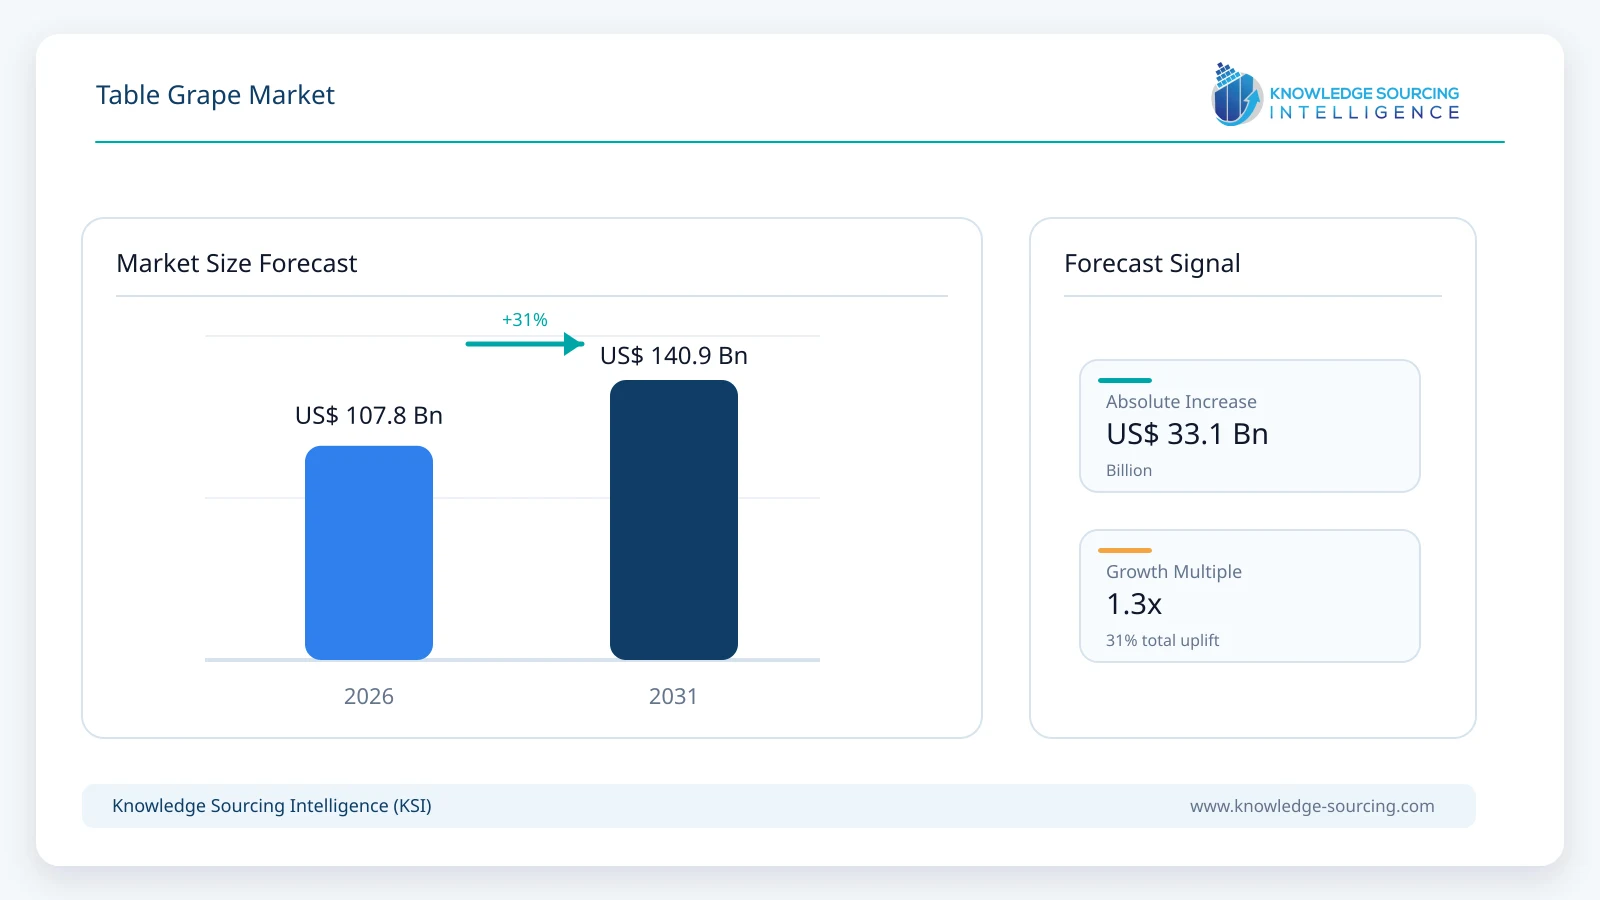
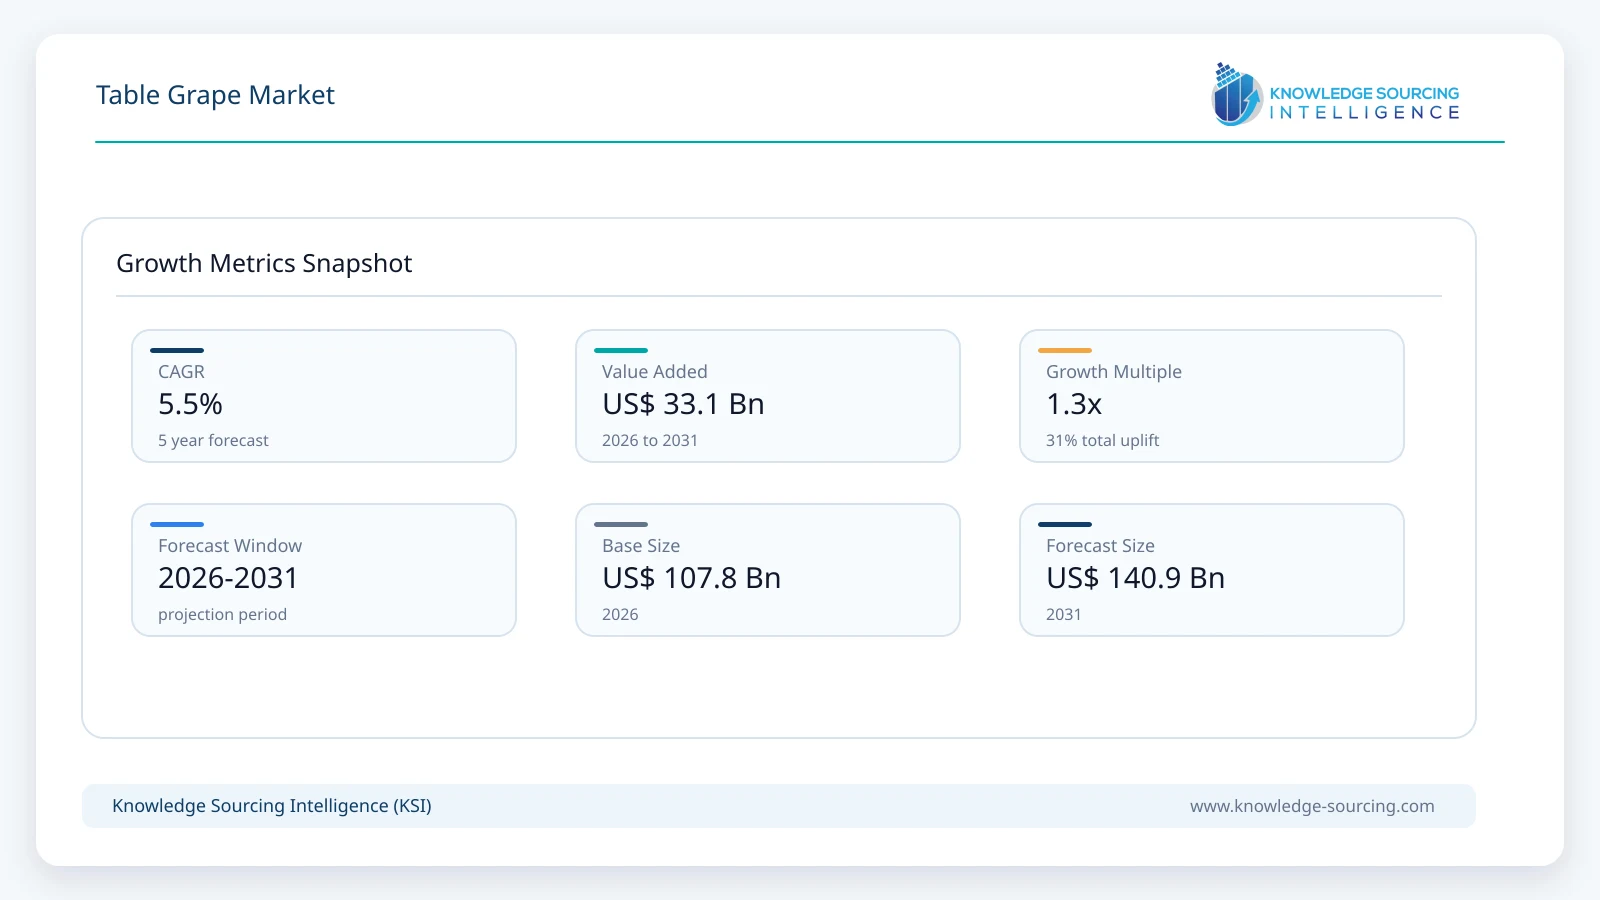
The Table Grape market is forecast to grow at a CAGR of 5.5%, reaching USD 140.9 billion in 2031 from USD 107.8 billion in 2026.
Highlights:
- 1Seedless grapes account for approximately 67.5% of global market value in 2026, supported by strong consumer preference and increasing adoption of premium proprietary varieties.
- 2Offline distribution accounts for approximately 91.2% of global market value in 2026, with supermarkets, fresh-produce retailers, wholesalers and traditional markets remaining central to table grape sales.
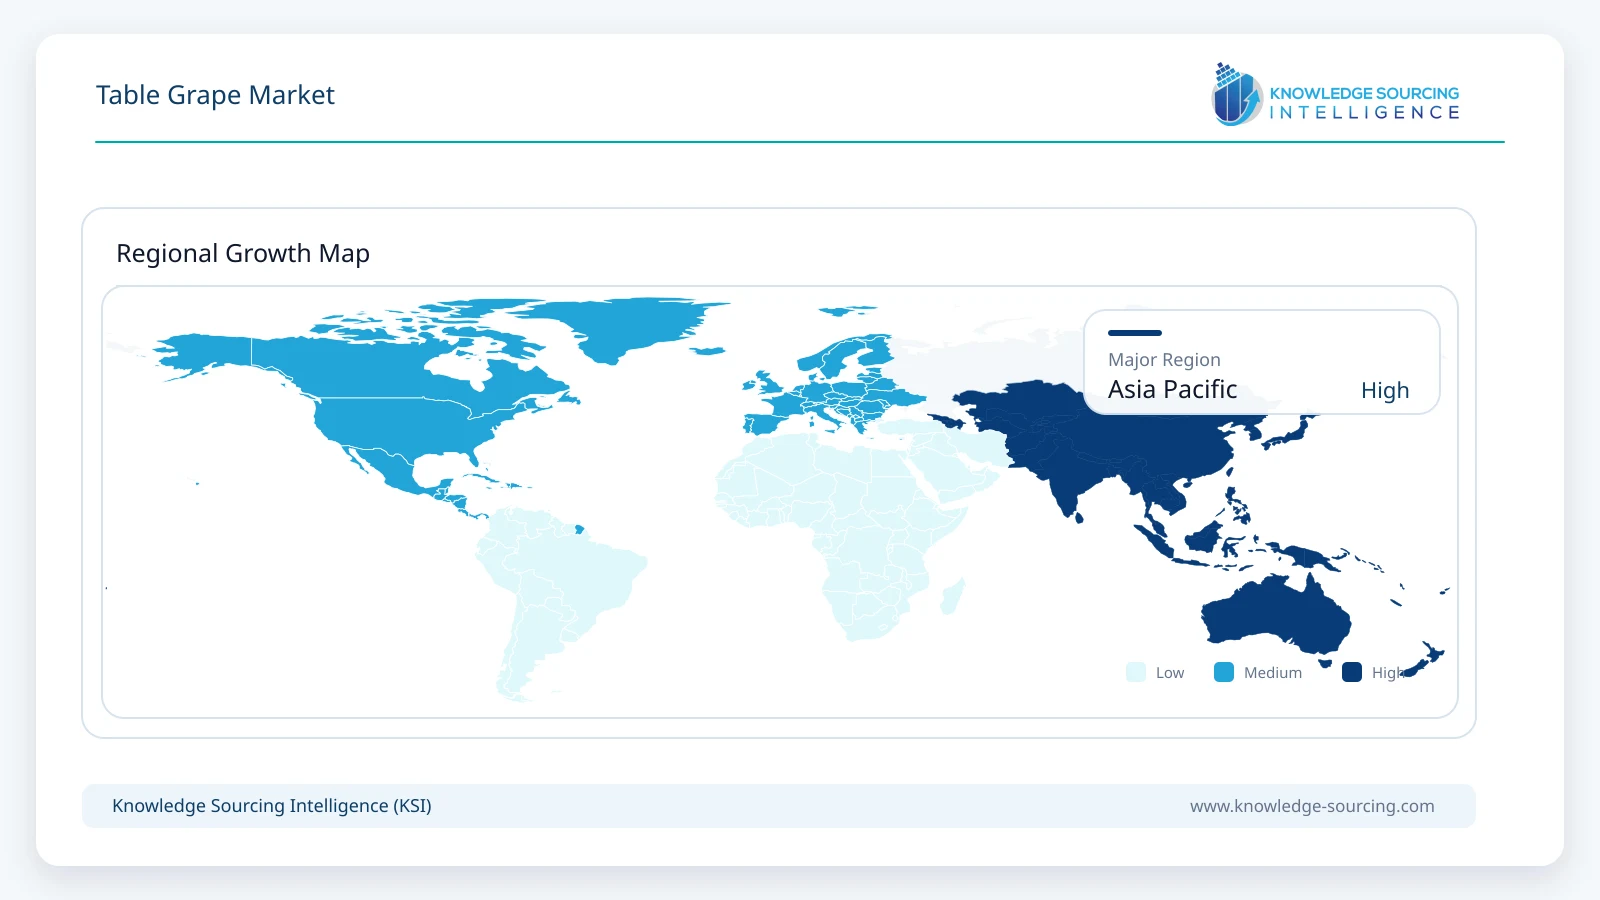
- 3Asia Pacific represents approximately 69.8% of global market value in 2026, supported by the scale of table grape consumption and production in China and India.
- 4Global table grape production reached 33.3 million tonnes in 2024, while consumption stood at 32.5 million tonnes.
- 5China and Peru are each forecast by the USDA to export approximately 770,000 tonnes in 2025/26, reflecting a changing global export landscape.
- 6Licensed varieties represented approximately 75% of Peru’s table grape exports in 2025/26, demonstrating the increasing commercial importance of varietal genetics.
Market Overview
Table grapes are fresh grapes cultivated primarily for direct human consumption rather than wine production or drying. The market covers conventional and proprietary cultivars supplied through domestic production, international trade, modern grocery retail, wholesale markets, and traditional fresh-produce channels.
Commercial requirements for table grapes are becoming more demanding. Berry size, firmness, sweetness, color consistency, seedlessness, bunch appearance, shelf life and transport performance increasingly influence grower and retailer decisions. Variety selection is consequently becoming more closely connected with packout rates, harvest timing, labour requirements and the ability to maintain quality during long-distance transportation.
The International Organisation of Vine and Wine estimated global table grape production at 33.3 million tonnes in 2024, an increase of 3.4% from 2023, while consumption reached 32.5 million tonnes. China accounted for the largest portion of consumption, followed by India and Egypt.
International trade represents a smaller proportion of total consumption but plays a disproportionate role in the commercial market by connecting counter-seasonal production regions with major importing countries. OIV estimated global fresh grape trade at approximately 5.0 million tonnes and EUR 9.9 billion in 2024. The average export value reached EUR 1.96 per kilogram after increasing for four consecutive years.
Market value is expected to grow faster than physical consumption as the varietal mix shifts toward premium seedless grapes, licensed genetics, stronger retail specifications and products capable of maintaining quality across increasingly long supply chains. Year-round sourcing is also reducing the traditional seasonality of the category in major consumer markets.
Major Market Drivers
Proprietary Seedless Genetics Are Changing Vineyard Economics
Varietal replacement is becoming one of the most important commercial drivers of the table grape industry. Older open varieties such as Thompson Seedless, Flame Seedless, Crimson Seedless and Red Globe remain widely cultivated, but new vineyard investment increasingly considers packout, berry size, labour requirements, yield stability, disease exposure, storage performance and retailer acceptance.
Modern breeding programs are therefore being developed around characteristics that create value throughout the supply chain. Growers benefit from cultivars capable of reducing thinning or harvesting requirements, exporters benefit from improved storage and transport performance, and retailers obtain greater consistency in appearance and eating quality.
Peru demonstrates the scale of this transition. USDA reporting for 2025/26 indicates that licensed varieties represented around 75% of Peruvian table grape exports, compared with 25% for traditional varieties. California’s current commercial portfolio similarly includes a substantial number of seedless cultivars developed through proprietary breeding programs.
Sun World reports that its table grape genetics are planted across more than 70,000 acres in 17 countries, while BLOOM FRESH combines the former IFG and SNFL breeding platforms. Varietal development is consequently becoming an important source of differentiation within a market that was historically more dependent on color and seed status.
Yield Improvement Is Expanding Supply Without Equivalent Acreage Growth
Table grape production is increasingly benefiting from improved yields rather than depending exclusively on vineyard expansion. USDA forecasts Chinese production at 15.0 million tonnes in 2025/26, supported by better cultivation methods, rain shelters, irrigation systems and varieties that extend regional harvesting periods.
The development is commercially important because China already represents the world’s largest table grape production and consumption base and is becoming increasingly significant in regional exports.
India is also increasing production. USDA forecasts approximately 3.15 million tonnes in 2025/26, while APEDA reports 172,580 hectares under grapes in FY2024/25. Maharashtra and Karnataka account for most Indian production.
Export-oriented production is becoming more technically intensive. Irrigation management, residue monitoring, packhouse infrastructure, traceability and crop protection increasingly determine whether fruit can be supplied to higher-value international markets. Productivity improvement therefore supports market expansion while helping growers manage constraints related to land, water and labour availability.
Counter-Seasonal Sourcing Is Turning Grapes Into a Year-Round Category
Table grapes benefit from production across both the Northern and Southern Hemispheres. California supplies important North American and international markets from late spring into winter, while Peru, Chile and South Africa occupy major Southern Hemisphere supply windows.
China, India, Egypt, Italy, Spain, Brazil, Mexico and other producing countries add further seasonal coverage. The interaction between these production windows allows retailers in major consuming markets to maintain grape availability for most of the year.
This changes the commercial importance of harvest timing. A cultivar capable of reaching the market slightly earlier, maintaining firmness for longer or filling a temporary supply gap can achieve a stronger market position even when its agricultural yield is similar to competing varieties.
The expansion of multi-origin sourcing is consequently encouraging closer coordination between breeders, growers, exporters, logistics providers and large retailers. Year-round availability also supports more consistent merchandising and promotional activity, helping table grapes operate as a recurring fresh-fruit category rather than a seasonal product.
New Market Access Is Broadening Export Opportunities
Export-market diversification is becoming increasingly important as growers face stronger competition during overlapping production windows. India received phytosanitary market access for fresh grapes to Vietnam in May 2026, providing exporters with an additional Southeast Asian destination.
South Africa completed its first official table grape shipment to the Philippines during the 2025/26 season and has also progressed market access to South Korea. These destinations are smaller than established markets such as Europe or the United States but provide exporters with additional channels when traditional destinations experience oversupply or weaker pricing.
Trade concentration illustrates the importance of diversification. Europe and the United Kingdom together accounted for the majority of South African table grape exports during 2025/26. China has developed a different export structure, benefiting from proximity to Vietnam, Thailand, Indonesia and other Asian markets.
Expanding market access therefore improves commercial flexibility and reduces dependence on a limited number of destination markets.
Major Market Restraints
Weather and Water Risk Affect Both Yield and Export Packout
Table grapes are particularly sensitive to weather because commercial value depends on fruit quality as well as total harvested volume. Frost, excessive heat, unseasonal rainfall, hail, humidity and water stress can affect berry size, coloration, sugar development, bunch condition, firmness and storage life.
The effect can be more significant for export-oriented production because retailers and importers typically specify minimum standards for berry size, color, condition and residue compliance. Fruit that remains suitable for domestic consumption may therefore fail to meet export requirements.
Türkiye experienced significant production disruption following severe spring frost in 2025, while growers in India have also faced unseasonal rainfall during important crop-development periods. Climate variability is consequently increasing interest in protected cultivation, improved irrigation management and varieties capable of maintaining commercial quality under more variable growing conditions.
Logistics Disruption Can Reduce Realized Value After Harvest
Table grapes depend on an uninterrupted post-harvest chain extending from vineyard cooling and packing through refrigerated storage, container transportation and retail distribution. Delays can reduce firmness, increase dehydration and shorten the remaining retail shelf life of the product.
South Africa’s 2025/26 season demonstrated the importance of logistics resilience. Exporters redirected substantial volumes through alternative ports when operational difficulties affected Cape Town, allowing shipments to continue but increasing logistical complexity and transportation costs.
The commercial impact of logistics disruption is particularly significant during periods when several producing countries are supplying the same destination. Delayed fruit can arrive into a weaker pricing environment while also carrying higher freight or storage costs.
Cold-chain management, route flexibility and port diversification are therefore becoming increasingly important competitive capabilities for exporters.
Residue, Phytosanitary and Tariff Requirements Raise Market-Access Costs
Premium export markets impose increasingly detailed requirements covering pesticide residues, traceability, phytosanitary treatment, packhouse approval and documentation.
India’s GrapeNet system supports traceability and residue monitoring for export grapes, while APEDA maintains specific procedures for shipments to the European Union. Comparable protocols operate across other major exporting countries.
These requirements improve product safety and traceability but increase the technical and administrative cost of serving international markets. Smaller producers can face particular difficulty because testing, documentation and certification require investment throughout the production and packing chain.
Trade policy can create additional uncertainty. Changes in phytosanitary treatment requirements or tariffs can alter the competitiveness of an exporting country even when farm-level production costs remain unchanged.
Market Trends
China and Peru Are Reshaping Global Export Leadership
Global table grape export leadership is becoming more geographically diversified. USDA forecasts China and Peru to each export approximately 770,000 tonnes in 2025/26.
China’s exports have expanded as production and yields improved, while the country’s own import requirement has weakened. Geographic proximity gives Chinese suppliers an important advantage in Southeast Asian destinations, particularly where short transport times help preserve freshness and reduce logistics costs.
Peru has developed through a different model. Irrigated coastal production, investment in modern packhouses and rapid adoption of proprietary varieties have strengthened its position in North America, Europe and other international markets.
Chile remains one of the world’s major exporters but is operating in a more competitive environment as Peruvian supply expands and new varieties alter retailer sourcing programs.
Retailers Are Merchandising Eating Experience, Not Only Color
Retail table grape programs are increasingly moving beyond traditional classifications such as green, red and black grapes. Crunch, sweetness, aroma, berry size, shape and varietal branding are becoming more visible elements of merchandising.
This development creates opportunities for breeders and growers to differentiate products that would otherwise compete primarily on appearance and price. Proprietary cultivars such as AutumnCrisp, Sweet Globe and Sweet Celebration demonstrate how variety identity can become part of the commercial proposition.
Retail adoption remains critical because varieties must deliver consistent quality across multiple seasons and production locations. Successful cultivars therefore combine consumer appeal with agronomic performance and the ability to maintain condition through packing, transportation and retail handling.
Traceability Is Becoming Part of Commercial Eligibility
Traceability is increasingly moving from a compliance function to a condition of market participation. Export grape programs require growers and packhouses to maintain detailed records of crop-protection treatments, residue testing, packing operations and shipment identity.
European buyers have long imposed stringent requirements, while major retailers increasingly maintain specifications that can exceed statutory limits.
Digital traceability systems also improve the ability to identify the origin of quality or compliance issues. This becomes more important as proprietary varieties are produced across several countries and supplied through long international chains.
Growers and exporters with established traceability, testing and quality-management systems are therefore better positioned to participate in premium retail and export programs.
Segment Analysis
By Variety
Seedless Table Grapes
Seedless grapes represent the largest variety category in the global table grape market. Demand is supported by consumer convenience, retailer preference and the rapid expansion of proprietary varieties developed around berry size, firmness, crunch, flavor and shelf life.
The segment includes established cultivars such as Thompson Seedless, Flame Seedless and Crimson Seedless as well as a growing portfolio of licensed varieties. New export-oriented vineyard investment in Peru, South Africa, California, Mexico, Australia and parts of Europe increasingly favors seedless genetics.
The commercial advantage extends beyond the absence of seeds. Modern cultivars are designed to improve packout, travel performance, harvest timing and labour efficiency, helping growers and exporters address several cost and quality constraints simultaneously.
Seedless grapes are expected to remain the dominant variety category through 2031 as proprietary genetics capture a larger role in premium retail and international trade.
By Distribution Channel
Offline Retail and Traditional Trade
Offline channels remain the principal distribution route for table grapes globally. The category includes supermarkets and hypermarkets, independent grocery stores, fresh-produce retailers, wholesale markets and traditional fruit markets.
Supermarkets are particularly important in North America and Europe because they coordinate year-round procurement across several producing regions and increasingly specify variety, berry size, packaging, residue standards and delivery windows.
Traditional and wholesale channels retain greater importance across large parts of Asia, the Middle East, Africa and Latin America, where domestic grape production passes through regional wholesale markets before reaching consumers.
The channel is also adapting rather than remaining static. Retailers increasingly use branded packaging, variety identification, promotional programs and category-management systems to differentiate table grapes and maintain consumer interest across the season. Offline channels are therefore expected to retain the largest market position through 2031 even as online fresh-food purchasing expands.
By Geography
Asia Pacific
Asia Pacific represents the largest regional table grape market, supported principally by China and India. China combines the world’s largest production and consumption base with a rapidly developing export industry, while India represents another major consumption market with an increasingly organized export supply chain.
China’s production system is becoming more productive as growers adopt improved cultivation methods, protected production and varieties capable of extending regional harvest windows. The country is also increasing exports into neighboring Asian markets, supported by relatively short transportation distances.
India’s commercial structure differs because a large domestic market coexists with a concentrated export industry centered primarily in Maharashtra. Traceability systems, residue monitoring and packhouse development are important for expanding access to international markets.
Japan and South Korea provide demand for premium grapes, while Southeast Asian countries are becoming increasingly relevant destinations for regional exporters. Rising production efficiency, premium variety adoption and expanding intra-regional trade are expected to maintain Asia Pacific’s leading position through 2031.
Competitive Landscape
The table grape market remains fragmented at the grower level but is becoming more concentrated around genetics, licensing, integrated marketing and large retailer programs.
Breeding and variety-rights companies such as Sun World International, BLOOM FRESH and Grapa Global influence future cultivar adoption through proprietary genetics and international grower-licensing networks. Their competitive position depends on whether individual varieties can perform successfully across multiple climates, production windows and retail markets.
Large growers, exporters and integrated fresh-produce companies compete through production scale, geographic diversification, packhouse infrastructure, retailer relationships and access to proprietary varieties. El Ciruelo, Fresh Farms, Divine Flavor, Four Star Fruit, Sun Pacific, Ingleby Farms and SAT Moyca are among the companies with established table grape operations.
Competition is increasingly determined by the ability to combine genetics with reliable supply. Retailers require consistent fruit across long selling seasons, making multi-origin production and relationships with licensed growers increasingly valuable.
BLOOM FRESH represents the combined breeding platform of IFG and SNFL and is therefore treated as a single competitive participant rather than listing the former businesses independently.
Recent Developments
July 2026: Grapa Global continued the development and commercialization of early-, mid- and late-season table grape varieties as part of its international breeding and licensing program.
May 2026: APEDA announced phytosanitary market access for Indian fresh grapes to Vietnam, expanding the potential destination base for Indian exporters.
May 2026: The South African Table Grape Industry reported its largest harvest to date for the 2025/26 season. South Africa also completed its first official table grape shipment to the Philippines and progressed market access to South Korea.
April 2026: The California Table Grape Commission launched its 2026 global marketing campaign as the California season began earlier than usual.
February 2026: Fresh Farms joined Sun World’s licensed marketer network to produce, pack and market proprietary table grape varieties across Mexico, the United States and South America.
October 2025: AMFRESH acquired TERRAMARA FRESH in Mexico, expanding its farming presence and production of patented table grape varieties.
Market Outlook
The table grape market is expected to expand steadily through 2031 as increasing production is accompanied by continued improvement in varietal quality, supply-chain capability and year-round availability.
Physical consumption remains an important foundation for growth, particularly in China and India. However, commercial value is increasingly influenced by the type of grapes being produced and the markets they can reach. Proprietary seedless varieties, premium retail programs, improved post-harvest performance and access to counter-seasonal supply are increasing the value generated from each stage of the supply chain.
International competition will remain intense. Peru and China are strengthening their export positions, while established suppliers including Chile, South Africa, California, India, Spain and Italy continue to adapt their varietal portfolios and destination strategies.
Weather volatility, water availability, logistics disruption and phytosanitary requirements remain important risks. These pressures favor growers and exporters with diversified varieties, strong packhouse systems, established cold chains and access to several destination markets.
The competitive structure of the industry is consequently expected to become more differentiated through 2031, with genetics, harvest timing, quality consistency and supply-chain execution playing a greater role alongside production volume.
Table Grape Market Scope
| Report Metric | Details |
|---|---|
| Total Market Size in 2026 | USD 107.8 billion |
| Total Market Size in 2031 | USD 140.9 billion |
| Forecast Unit | Billion |
| Growth Rate | 5.5% |
| Study Period | 2021 to 2031 |
| Historical Data | 2021 to 2024 |
| Base Year | 2025 |
| Forecast Period | 2026 – 2031 |
| Segmentation | Variety, Distribution Channel, Geography |
| Companies |
|
Market Segmentation
BY VARIETY
Seeded
Red Globe
Kyoho and Related Varieties
Others
Seedless
Thompson Seedless / Sultana
Flame Seedless and Crimson Seedless
Premium and Proprietary Seedless Varieties
Others
BY DISTRIBUTION CHANNEL
Offline
Supermarkets and Hypermarkets
Grocery and Independent Retailers
Traditional Fresh Produce and Wholesale Markets
Others
Online
Retailer-Owned E-commerce
Marketplaces and Quick-Commerce Platforms
Others
BY GEOGRAPHY
North America
United States
Canada
Mexico
South America
Brazil
Argentina
Chile
Peru
Others
Europe
United Kingdom
Germany
France
Italy
Spain
Netherlands
Others
Middle East and Africa
Türkiye
Egypt
South Africa
Saudi Arabia
UAE
Israel
Others
Asia Pacific
China
India
Japan
South Korea
Australia
Indonesia
Vietnam
Others
Table of Contents
Table of Contents
1. INTRODUCTION
1.1. Market Overview
1.2. Market Definition
1.3. Scope of the Study
1.4. Market Segmentation
1.5. Currency
1.6. Assumptions
1.7. Base and Forecast Years Timeline
1.8. Key Benefits for Stakeholders
2. RESEARCH METHODOLOGY
2.1. Research Design
2.2. Research Process
2.3. Primary Research Framework
2.4. Secondary Research Framework
2.5. Market Estimation
2.6. Volume and Value Reconciliation
2.7. Data Triangulation
2.8. Forecast Methodology
3. EXECUTIVE SUMMARY
3.1. Key Findings
3.2. Analyst View
4. MARKET DYNAMICS
4.1. Market Drivers
4.1.1. Shift Toward Proprietary Seedless Genetics
4.1.2. Yield Improvement and Protected Cultivation
4.1.3. Expansion of Counter-Seasonal and Year-Round Supply
4.1.4. New Export Corridors and Market Access
4.2. Market Restraints
4.2.1. Weather Volatility, Water Stress and Packout Risk
4.2.2. Port Congestion, Freight Risk and Overlapping Supply Windows
4.2.3. Residue, Phytosanitary and Tariff Requirements
4.3. Market Opportunities
4.4. Porter’s Five Forces Analysis
4.5. Industry Value Chain Analysis
4.6. Global Production and Consumption Outlook
4.7. International Trade and Harvest-Window Analysis
4.8. Pricing and Export Unit Value Analysis
4.9. Varietal Licensing and Breeding Landscape
4.10. Strategic Recommendations
5. TABLE GRAPE MARKET BY VARIETY
5.1. Seeded
5.1.1. Red Globe
5.1.2. Kyoho and Related Varieties
5.1.3. Others
5.2. Seedless
5.2.1. Thompson Seedless / Sultana
5.2.2. Flame Seedless and Crimson Seedless
5.2.3. Premium and Proprietary Seedless Varieties
5.2.4. Others
6. TABLE GRAPE MARKET BY DISTRIBUTION CHANNEL
6.1. Offline
6.1.1. Supermarkets and Hypermarkets
6.1.2. Grocery and Independent Retailers
6.1.3. Traditional Fresh Produce and Wholesale Markets
6.1.4. Others
6.2. Online
6.2.1. Retailer-Owned E-commerce
6.2.2. Marketplaces and Quick-Commerce Platforms
6.2.3. Others
7. TABLE GRAPE MARKET BY GEOGRAPHY
7.1. North America
7.1.1. United States
7.1.2. Canada
7.1.3. Mexico
7.2. South America
7.2.1. Brazil
7.2.2. Argentina
7.2.3. Chile
7.2.4. Peru
7.2.5. Others
7.3. Europe
7.3.1. United Kingdom
7.3.2. Germany
7.3.3. France
7.3.4. Italy
7.3.5. Spain
7.3.6. Netherlands
7.3.7. Others
7.4. Middle East and Africa
7.4.1. Türkiye
7.4.2. Egypt
7.4.3. South Africa
7.4.4. Saudi Arabia
7.4.5. UAE
7.4.6. Israel
7.4.7. Others
7.5. Asia Pacific
7.5.1. China
7.5.2. India
7.5.3. Japan
7.5.4. South Korea
7.5.5. Australia
7.5.6. Indonesia
7.5.7. Vietnam
7.5.8. Others
8. GLOBAL TRADE AND SUPPLY CHAIN ANALYSIS
8.1. Major Exporting Countries
8.2. Major Importing Countries
8.3. Export Season and Supply-Window Comparison
8.4. Cold-Chain and Port Infrastructure
8.5. Phytosanitary and Residue Compliance
8.6. Market Access Developments
9. COMPETITIVE ENVIRONMENT AND ANALYSIS
9.1. Major Players and Strategy Analysis
9.2. Genetics and Variety-Rights Competition
9.3. Grower and Exporter Competitive Positioning
9.4. Mergers, Acquisitions, Agreements and Collaborations
9.5. New Variety and Brand Development
9.6. Competitive Dashboard
10. COMPANY PROFILES
10.1. Sun World International, LLC
10.2. BLOOM FRESH International
10.3. Grapa Global
10.4. El Ciruelo, S.L.
10.5. Fresh Farms
10.6. Divine Flavor, LLC
10.7. Four Star Fruit, Inc.
10.8. Sun Pacific
10.9. Ingleby Farms & Forests
10.10. SAT Moyca
11. APPENDIX
Navigate
Trusted by the world's leading organizations











