Report Overview
Wind Monitoring Instruments Market Size:
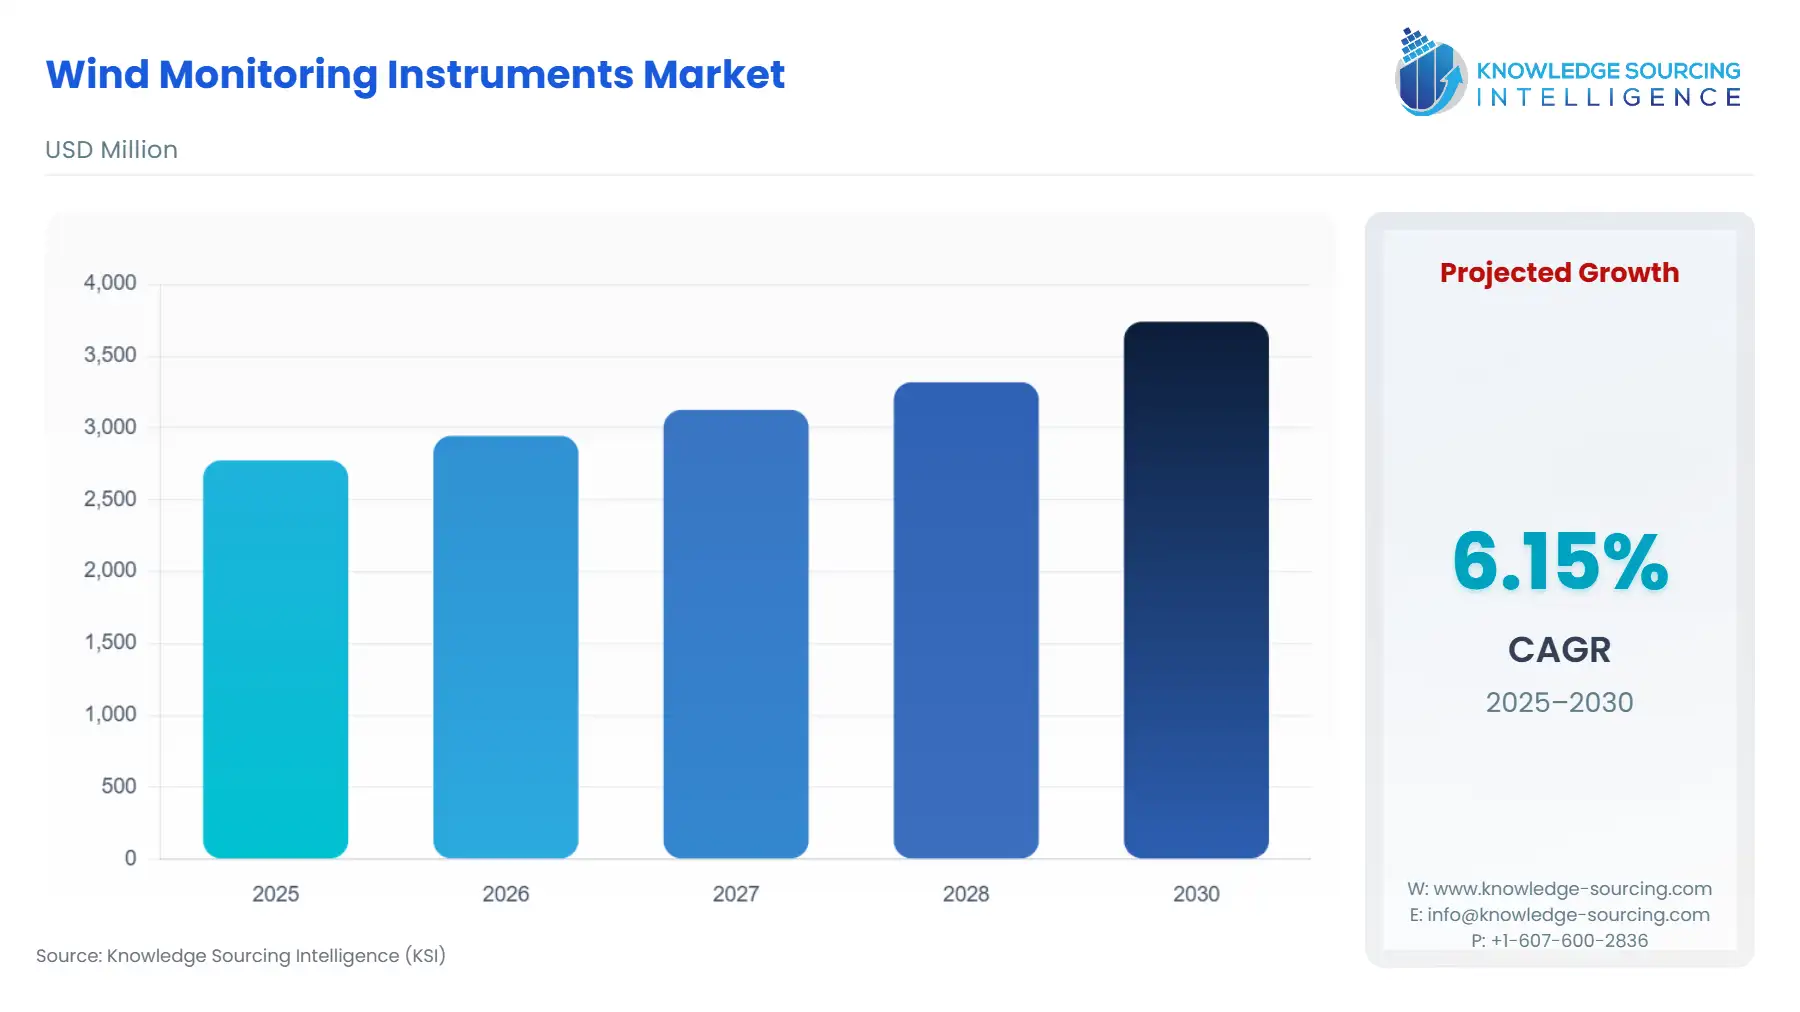
Wind Monitoring Instruments Market is projected to expand at a 6.15% CAGR, attaining USD 3.740 billion by 2030 from USD 2.775 billion in 2025.
Highlights:
- 1The global proliferation of utility-scale and distributed wind energy projects creates a direct, consistent imperative for pre-construction wind resource assessment (WRA) and operational performance monitoring, fueling the demand for precision instruments like cup anemometers and SoDAR/LiDAR systems.
- 2Government mandates, such as the Indian Ministry of New and Renewable Energy's declaration of a Wind Renewable Purchase Obligation (RPO) trajectory, directly translate into mandated procurement of verified wind monitoring hardware to ensure regulatory compliance for grid-connected projects.
- 3The escalating development of offshore wind farms, particularly in Europe and Asia-Pacific, drives an increased demand for specialized, ruggedized ultrasonic sensors and buoy-mounted LiDAR systems capable of reliable operation in harsh maritime environments.
- 4Supply chain volatility in key electronic components, including microcontrollers and magnetic position sensors, introduces pricing pressure and lead-time risks for manufacturers, potentially constraining the supply of advanced digital wind monitoring instruments.
The Wind Monitoring Instruments market serves as a foundational layer for the global transition to renewable energy, providing the critical data necessary for commercial viability, regulatory compliance, and operational efficiency across the wind power generation lifecycle.
This market encompasses a spectrum of hardware—from traditional mechanical sensors like wind vanes and cup anemometers to advanced remote sensing technologies such as Light Detection and Ranging (LiDAR)—all essential for measuring atmospheric parameters. The instruments’ role transcends simple weather reporting; they are the primary tools for resource validation, crucial for securing project financing, and integral to continuous turbine performance optimization, which directly impacts the Levelized Cost of Energy (LCoE) for wind assets. As wind farm capacity additions continue globally, the underlying demand for high-accuracy, reliable, and network-integrated monitoring solutions accelerates, shifting the market emphasis toward digital, low-maintenance systems.
Wind Monitoring Instruments Market Analysis
- Growth Drivers
The aggressive global deployment of new wind capacity, driven by national decarbonization strategies, is the primary catalyst. New wind farm construction necessitates a comprehensive wind resource assessment (WRA) using monitoring instruments to validate the site’s commercial viability and energy yield, which directly drives demand for high-accuracy systems. Simultaneously, the repowering trend, where older, smaller turbines are replaced with modern, higher-capacity models, requires extensive pre- and post-installation power performance testing (PPT) mandated by standards like IEC 61400-12-1, creating specific, recurring demand for calibrated anemometers and nacelle-mounted LiDAR. Furthermore, the increasing complexity of grid integration compels wind farm operators to deploy advanced sensors for real-time wind data to improve short-term forecasting and ensure grid stability, thus escalating the procurement of connected digital monitoring systems.
- Expansion of Global Wind Energy Capacity
The surge in wind power installations worldwide is a cornerstone driver, as accurate wind monitoring is essential for site assessment, turbine optimization, safety, and maximizing energy output. Without precise data on wind patterns, turbine efficiency drops, making these instruments indispensable. This growth directly correlates with demand, particularly in offshore and onshore wind farms, where instruments help mitigate risks like structural fatigue from variable winds. Additionally, beyond traditional uses, demand is rising in agriculture (e.g., wind impact on crop yields), building/construction (e.g., crane operations in windy conditions), and marine sectors (e.g., vessel navigation). These niche applications broaden the market base. For instance, the integration of IoT-enabled sensors allows real-time data sharing, appealing to smart city projects and precision farming.
- Boom in the Aviation Sector
Wind monitoring instruments, especially anemometers, play a critical role in aviation safety and operations, providing real-time data for takeoff/landing decisions, turbulence prediction, and flight routing. As air travel rebounds and expands, the need for reliable ground-based and airborne wind sensors intensifies. This driver is amplified in regions with high air traffic density, such as North America and Asia-Pacific, where airports invest in advanced monitoring to comply with safety regulations. Moreover, ongoing innovations in sensor technology—such as sonic anemometers and LiDAR systems—enhance accuracy, reduce maintenance, and enable 3D wind profiling, making instruments more appealing for diverse applications including aviation industry.
- Challenges and Opportunities
A significant market challenge is the cost and complexity associated with advanced remote sensing technologies, specifically LiDAR, which creates a barrier to entry for smaller developers in emerging markets and constrains demand to capital-intensive projects. Furthermore, a sustained headwind exists from intense competition among Original Equipment Manufacturers (OEMs), which drives down the price of established mechanical sensors and compresses profit margins across the value chain. However, a key opportunity is the expanding regulatory framework for green hydrogen, such as India's National Green Hydrogen Mission, which requires verifiable, reliable wind data for the mandated 125 GW of new renewable energy capacity by 2030. This new, high-standard application generates fresh demand for rugged, certified monitoring instruments specifically integrated with renewable-to-hydrogen plant control systems.
- Raw Material and Pricing Analysis
The Wind Monitoring Instruments Market, as a physical product domain, exhibits dependency on the electronics and specialized materials supply chain. Core components include high-precision integrated circuits (ICs), microcontrollers, and specialized magnetic position sensors necessary for digital processing and movement tracking in ultrasonic and cup anemometers. The pricing dynamics are significantly influenced by the global semiconductor market, where capacity constraints and geopolitical pressures on key fabrication hubs can increase component cost and extend lead times. Specialized, high-strength plastics and corrosion-resistant alloys, crucial for instrument housings, particularly in marine-grade sensors, are also subject to fluctuating commodity prices. This exposure to electronics and metal market volatility directly impacts the final equipment price, creating procurement planning challenges for large-scale wind developers.
- Supply Chain Analysis
The global supply chain for wind monitoring instruments is vertically integrated but geographically concentrated. The production of the most sophisticated components, such as lidar optical modules and high-speed data loggers, centers predominantly in North America and select European and East Asian hubs. This creates logistical complexity and dependency, with significant lead times for advanced inventory. The reliance on a limited number of specialized sensor manufacturers makes the supply chain vulnerable to single-point failures, component shortages, and trade tariff impacts, which can delay wind resource assessment timelines. The imposition of tariffs on imported electronic and metallic components for manufacturing, which has been observed in various global trade contexts, raises the end cost for developers, impacting project economics and potentially softening the price-sensitive demand for monitoring systems.
Wind Monitoring Instruments Market Government Regulations
Key governmental and institutional regulations globally directly shape the demand for wind monitoring instruments.
|
Jurisdiction |
Key Regulation / Agency |
Market Impact Analysis |
|
India |
Ministry of New and Renewable Energy (MNRE) - Wind RPO Trajectory |
The declaration of a trajectory for the Wind Renewable Purchase Obligation (RPO) up to 2030 compels power distribution licensees to procure a minimum amount of wind power, generating immediate, mandated demand for WRA and operational performance monitoring instrumentation for all new and existing grid-connected projects. |
|
Germany / European Union |
German Offshore Wind Energy Act; Ostende Declaration (2023) |
Germany's legal demand to increase offshore capacity to at least 30 GW by 2030 necessitates extensive, multi-year, and highly reliable environmental and wind measurement campaigns using advanced ocean-observing platforms and ruggedized offshore sensors, driving high-value demand for specialized maritime instruments. |
|
Global |
IEC 61400-12-1 (Power Performance Measurement) |
This technical standard mandates a specific, rigorous procedure for measuring wind turbine power performance, requiring certified, traceable, and regularly calibrated wind monitoring instruments (e.g., Class 1 cup anemometers) to ensure commercial compliance, thereby standardizing and guaranteeing a baseline demand for high-quality instruments in operational wind farms. |
Wind Monitoring Instruments Market In-Depth Segment Analysis
- By Type: Anemometer
The anemometer segment, which includes mechanical (cup and propeller) and solid-state (ultrasonic) instruments, remains the foundational and highest-volume market driver due to its mandatory role in both Wind Resource Assessment (WRA) and Power Performance Testing (PPT). The demand for traditional cup anemometers is sustained by the International Electrotechnical Commission's (IEC) 61400-12-1 standard, which designates these devices as the primary, reference-grade instrument for certifying turbine power curves, creating non-negotiable demand for high-calibration models. Concurrently, the proliferation of utility-scale turbines with increasing hub heights drives demand for advanced ultrasonic anemometers. These solid-state devices offer high-frequency data collection, no moving parts for reduced maintenance, and superior performance in severe weather, making them the preferred choice for real-time turbine control and high-altitude monitoring where mechanical wear is a significant constraint. The clear, verifiable correlation between instrument accuracy and a project's financial validation ensures this segment's robust, non-cyclical demand.
- By End-User: Power & Energy
The Power & Energy end-user segment, comprising utility-scale wind farm developers, independent power producers (IPPs), and asset operators, generates the overwhelming majority of market demand. The demand imperative here is twofold: Risk Mitigation and Asset Optimization. Pre-construction, developers require comprehensive monitoring data over a multi-year period to secure financing and insurance, a process that necessitates a fleet of reliable instruments for WRA. Post-commissioning, the continuous drive for operational efficiency is the key demand engine. Monitoring instruments enable precise yaw and pitch control to maximize energy capture and provide the data for predictive maintenance algorithms, allowing operators to transition from reactive to proactive upkeep. This capability to minimize downtime and increase the Capacity Factor (CF) directly impacts the LCoE, tying the demand for advanced monitoring hardware directly to the economic performance of every installed wind asset. Furthermore, the requirement for real-time wind data is increasing due to the need to comply with grid codes that mandate accurate power output forecasting for system stability.
Wind Monitoring Instruments Market Geographical Analysis
- US Market Analysis (North America)
The US market for wind monitoring instruments is primarily driven by the federal extension and implementation of tax credits that catalyze onshore and emerging offshore wind projects. The strong, established onshore wind market creates a sustained, mature demand for post-installation performance monitoring to validate turbine warranties and ensure compliance with regional power purchase agreements. Crucially, the US Department of Energy's focus on deep-water and floating offshore wind technology is pioneering new, highly specialized demand for advanced, American-manufactured LiDAR and SoDAR systems ruggedized for deep-sea environments and sophisticated data telemetry, pushing the technological boundary of the market.
- Brazil Market Analysis (South America)
Brazil's market dynamics are dictated by its robust onshore wind resource, particularly in the Northeast region. The primary local factor driving demand for wind monitoring instruments is the rapid scale-up of the country's free-market power contracts (ACL) for wind power, which is boosting Power Purchase Agreements (PPAs) and accelerating wind park development. This expansion of the addressable market necessitates substantial new resource assessment campaigns, creating immediate demand for meteorological masts, dataloggers, and anemometers to qualify the new sites, particularly those optimized for 4-6 MW turbines now dominating the local order books.
- Germany Market Analysis (Europe)
Germany's market demand is centered on its ambitious offshore wind targets, as stipulated by the German Offshore Wind Energy Act, demanding 30 GW by 2030. This creates a specific, high-value demand for complex, integrated monitoring solutions like the FINO (Forschungsplattformen in Nord- und Ostsee) research platforms, which observe meteorological parameters, wind direction, and air pressure. The regulatory requirement for long-term, dependable data for strategic planning, load calculation, and turbine fatigue estimation drives sustained, high-specification demand for ruggedized, high-calibration sensors capable of operating in the North Sea's demanding conditions.
- Saudi Arabia Market Analysis (Middle East & Africa)
Saudi Arabia’s Vision 2030 renewable energy targets are the core market driver, initiating large-scale greenfield wind projects, such as the Dumat Al Jandal wind farm. The local factor impacting demand is the necessity for instruments that can reliably operate under extreme desert conditions, including high temperatures and particulate matter, which necessitates the procurement of non-mechanical, low-maintenance sensors like heated ultrasonic anemometers and remote-sensing technologies resistant to sand abrasion, creating a distinct, quality-focused demand segment.
- China Market Analysis (Asia-Pacific)
China’s market size and unprecedented installation rate are the dominant demand factors. With a record 74.7 GW of new capacity installed in 2023, the sheer volume of turbine deployment creates an overwhelming, sustained demand for bulk procurement of standardized wind monitoring instruments. Furthermore, the rapid expansion of offshore wind installations drives a separate, specialized demand for maritime-grade monitoring, including both fixed and floating measurement stations. The intense domestic competition, however, creates strong downward pressure on the pricing of standardized instruments.
Wind Monitoring Instruments Market Competitive Environment and Analysis
The Wind Monitoring Instruments market exhibits a bifurcated competitive structure, with established global firms dominating the high-margin, advanced technology segments (LiDAR/SoDAR and certified sensors) and regional players competing heavily in the volume-driven mechanical sensor and data logging segments. Competition is primarily based on instrument accuracy, data communication protocols, and certification traceability. The strategic positioning of key players revolves around integrating hardware with proprietary data platforms to offer an end-to-end solution.
- Vaisala- Vaisala, headquartered in Finland, maintains a formidable strategic position, particularly in the high-value, critical measurement space, by focusing on robust, high-precision instrumentation for meteorology and the demanding offshore wind sector. The company’s key product portfolio is anchored by the WindCube® lidar suite, which includes the WindCube Offshore model, specifically ruggedized for maritime deployment on buoys.
- Campbell Scientific, Inc.- Freudenberg Medical, a subsidiary of the global technology group Freudenberg, is strategically positioned as a dedicated contract manufacturing and components partner to the medical device industry. Their core offering lies in precision extrusion and molding, with a strong focus on advanced silicone, thermoplastic, and composite tubing.
Wind Monitoring Instruments Market Recent Developments
- June 2025: The Fraunhofer Institute for Wind Energy Systems IWES launched an innovative Dual Doppler Wind Radar system, which facilitates three-dimensional wind field measurements with high precision over considerable distances. Installed near the DLR research wind farm WiValdi in Stade, Lower Saxony, this system, developed by SmartWind Technologies from Texas, has been providing measurement data since early June. The system's introduction is part of the "Wind farm RADAR" project, funded by the German Federal Ministry for Economic Affairs and Energy, and is being scientifically validated by Fraunhofer IWES in collaboration with ForWind - Carl von Ossietzky University of Oldenburg.
- December 2024: Vaisala introduced the WM80, a robust ultrasonic wind sensor specifically engineered for the challenging environments encountered in onshore and offshore wind farms, as well as maritime applications. This sensor is designed to provide accurate and reliable wind data, maintaining performance even in severe weather conditions. The WM80 plays a crucial role in enhancing the efficiency and safety of wind turbine operations, as well as improving the dynamic positioning and navigation systems of offshore vessels. Its ability to deliver precise wind information helps optimize performance in both wind energy and maritime settings, addressing the unique challenges presented by these sectors.
Wind Monitoring Instruments Market Scope:
| Report Metric | Details |
|---|---|
| Total Market Size in 2026 | USD 2.775 billion |
| Total Market Size in 2031 | USD 3.740 billion |
| Growth Rate | 6.15% |
| Study Period | 2021 to 2031 |
| Historical Data | 2021 to 2024 |
| Base Year | 2025 |
| Forecast Period | 2026 – 2031 |
| Segmentation | Type, Application, End-User, Geography |
| Geographical Segmentation | North America, South America, Europe, Middle East and Africa, Asia Pacific |
| Companies |
|
Wind Monitoring Instruments Market Segmentation:
- WIND MONITORING INSTRUMENTS MARKET BY TYPE
- Anemometer
- Wind Vane
- Others
- WIND MONITORING INSTRUMENTS MARKET BY APPLICATION
- Wind Speed
- Wind Direction
- Wind Temperature & Humidity
- Wind Pressure
- WIND MONITORING INSTRUMENTS MARKET BY END-USER
- Aviation
- Meteorology
- Power & Energy
- Agriculture
- Building & Construction
- Others
- WIND MONITORING INSTRUMENTS MARKET BY GEOGRAPHY
- North America
- USA
- Canada
- Mexico
- South America
- Brazil
- Argentina
- Others
- Europe
- Germany
- France
- United Kingdom
- Spain
- Others
- Middle East and Africa
- Saudi Arabia
- UAE
- Israel
- Others
- Asia Pacific
- China
- India
- Japan
- South Korea
- Indonesia
- Taiwan
- Others
- North America
Market Segmentation
By Type
By Application
By End-user
By Geography
Table of Contents
1. EXECUTIVE SUMMARY
2. MARKET SNAPSHOT
2.1. Market Overview
2.2. Market Definition
2.3. Scope of the Study
2.4. Market Segmentation
3. BUSINESS LANDSCAPE
3.1. Market Drivers
3.2. Market Restraints
3.3. Market Opportunities
3.4. Porter’s Five Forces Analysis
3.5. Industry Value Chain Analysis
3.6. Policies and Regulations
3.7. Strategic Recommendations
4. TECHNOLOGICAL OUTLOOK
5. Wind Monitoring Instruments Market by TYPE
5.1. Introduction
5.2. Anemometer
5.3. Wind Vane
5.4. Others
6. Wind Monitoring Instruments Market by APPLICATION
6.1. Introduction
6.2. Wind Speed
6.3. Wind Direction
6.4. Wind Temperature & Humidity
6.5. Wind Pressure
7. Wind Monitoring Instruments Market by END-USER
7.1. Introduction
7.2. Aviation
7.3. Meteorology
7.4. Power & Energy
7.5. Agriculture
7.6. Building & Construction
7.7. Others
8. Wind Monitoring Instruments Market by geography
8.1. Introduction
8.2. North America
8.2.1. USA
8.2.2. Canada
8.2.3. Mexico
8.3. South America
8.3.1. Brazil
8.3.2. Argentina
8.3.3. Others
8.4. Europe
8.4.1. Germany
8.4.2. France
8.4.3. United Kingdom
8.4.4. Spain
8.4.5. Others
8.5. Middle East and Africa
8.5.1. Saudi Arabia
8.5.2. UAE
8.5.3. Israel
8.5.4. Others
8.6. Asia Pacific
8.6.1. China
8.6.2. India
8.6.3. Japan
8.6.4. South Korea
8.6.5. Indonesia
8.6.6. Taiwan
8.6.7. Others
9. COMPETITIVE ENVIRONMENT AND ANALYSIS
9.1. Major Players and Strategy Analysis
9.2. Market Share Analysis
9.3. Mergers, Acquisitions, Agreements, and Collaborations
9.4. Competitive Dashboard
10. COMPANY PROFILES
10.1. Maximum Weather Instruments
10.2. Comptus
10.3. Shandong Renke Control Technology Co., Ltd
10.4. Observator Group
10.5. Testo SE & Co. KGaA
10.6. Vaisala
10.7. FT Technologies
10.8. ESCO Technologies
10.9. Met One Instruments
10.10. Inspeed, LLC
10.11. Campbell Scientific, Inc.
11. APPENDIX
11.1. Currency
11.2. Assumptions
11.3. Base and Forecast Years Timeline
11.4. Key benefits for the stakeholders
11.5. Research Methodology
11.6. Abbreviations
LIST OF FIGURES
LIST OF TABLES
Navigate
Trusted by the world's leading organizations


