
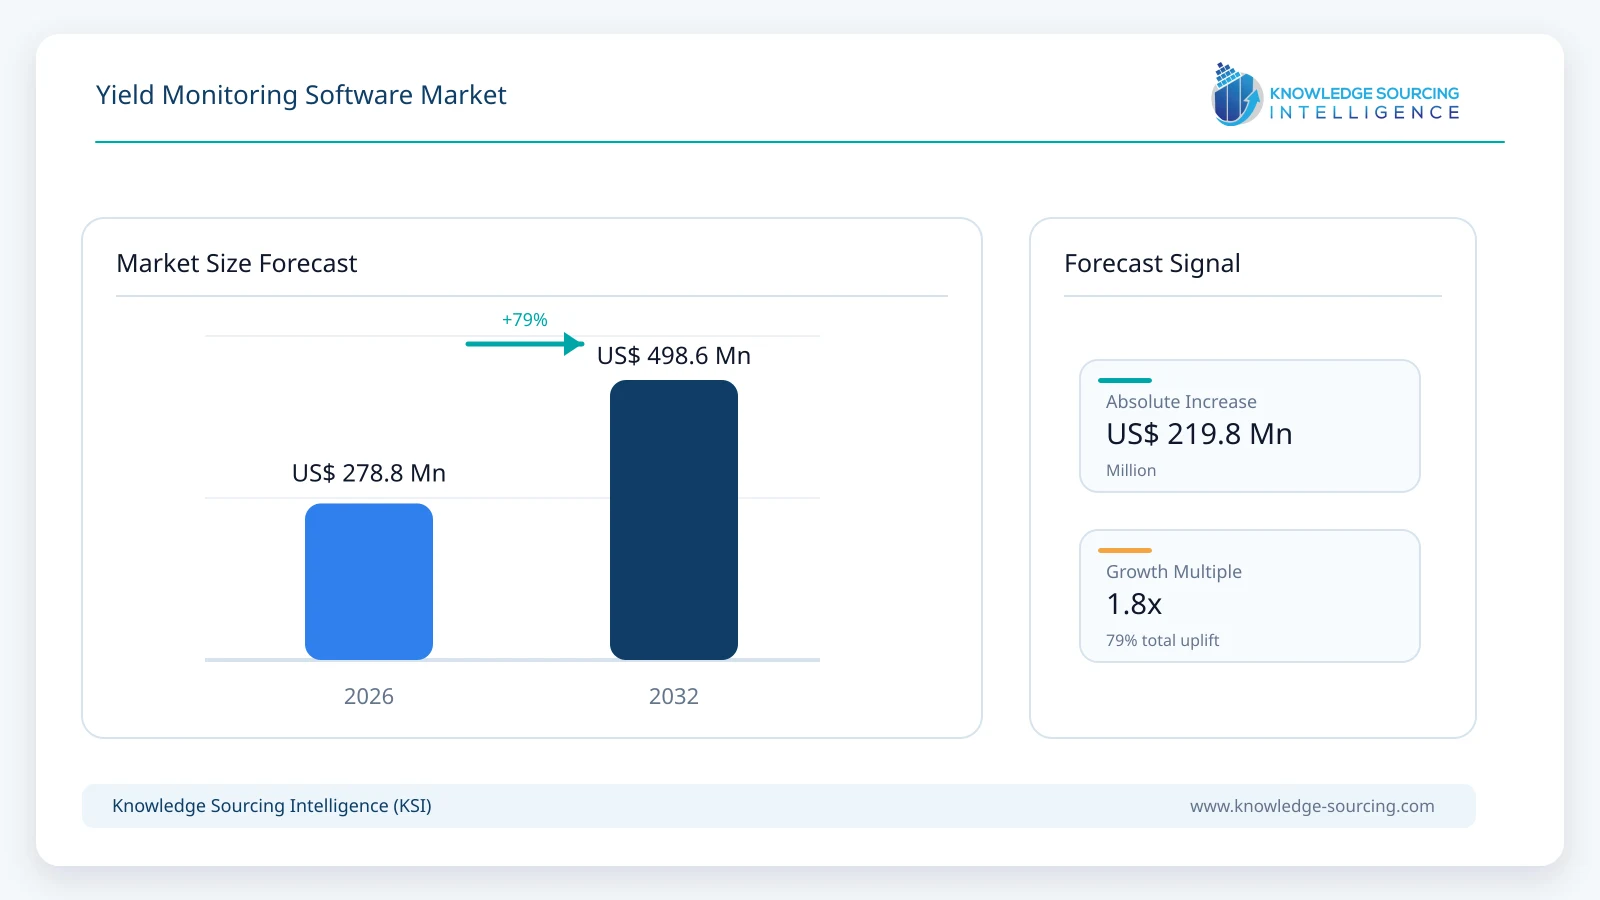
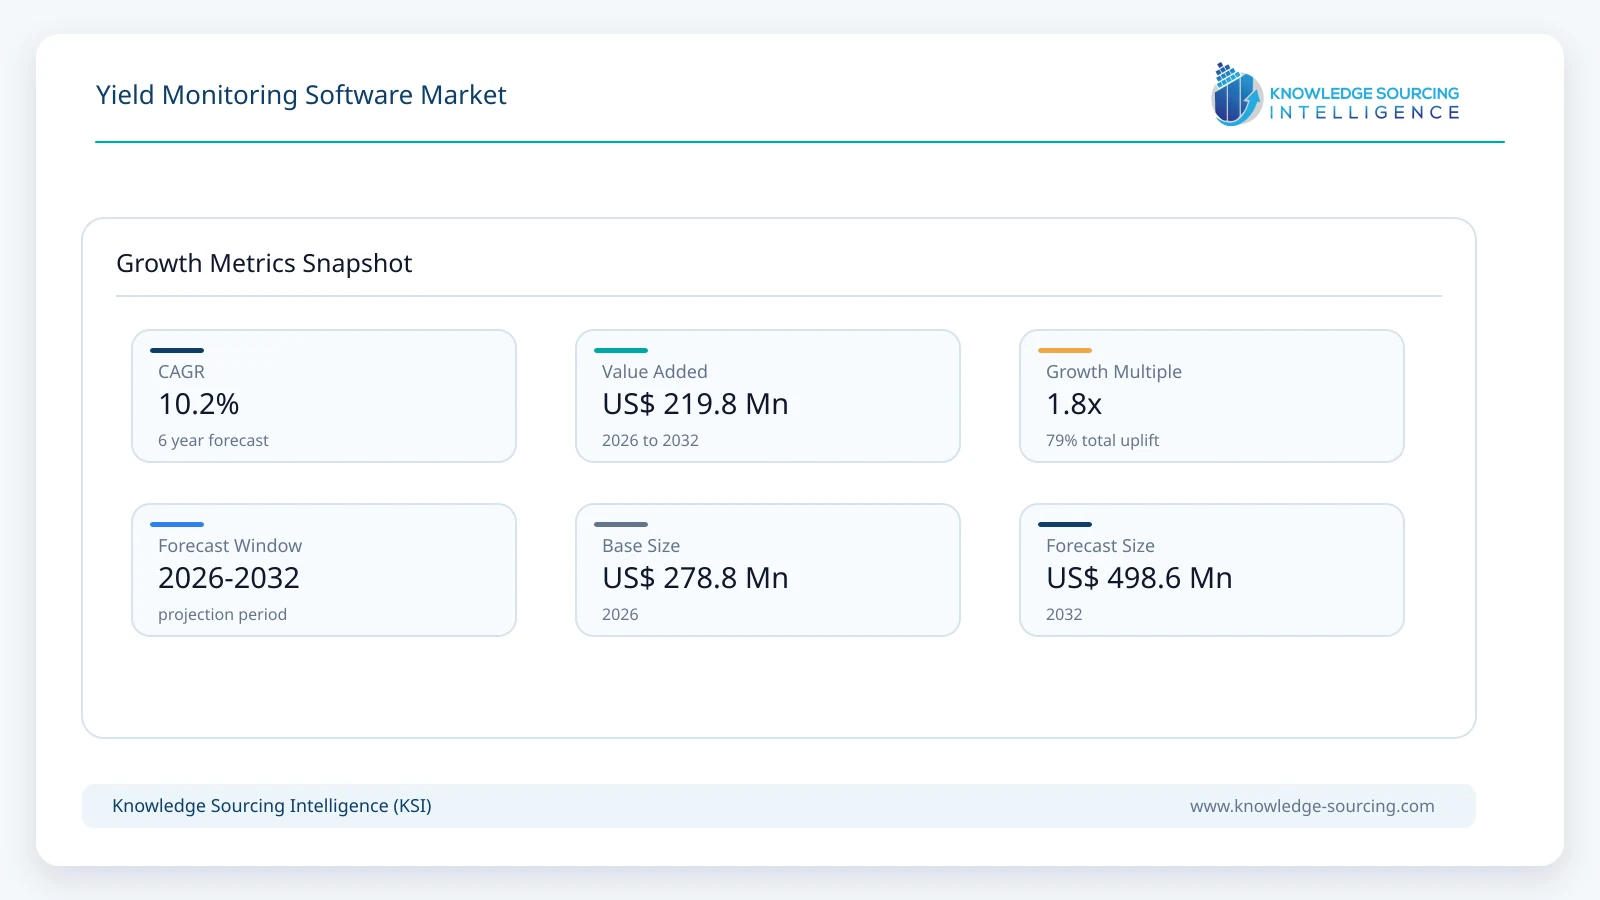
The yield monitoring software market is estimated at USD 278.8 million in 2026 and is projected to reach USD 498.6 million by 2032, representing a 10.2% CAGR during the forecast period.
Highlights:
- 1Broadacre crops account for an estimated 52.2% of 2026 yield monitoring software revenue, supported by established grain-harvest data workflows and high commercial relevance of hybrid and input-performance comparisons.
- 2The market is projected to expand at 10.17% CAGR during 2026–2032, reflecting increased monetization of yield-analysis tools rather than an assumption that every connected farm becomes a paying account.
- 3Europe contributes an estimated US$105.60 million in 2026, reflecting an established adviser channel, larger data-rich field-crop businesses and higher-priced specialty-crop analytical workflows.
- 4Cloud-based deployments represent approximately 85.7% of estimated 2026 revenue, as growers and agronomists increasingly exchange data across machinery brands, mobile devices and advisory organizations.
- 5Yield forecasting and benchmarking is projected to outgrow basic harvest mapping, because the next buying decision concerns explaining yield variation and measuring treatment payback, not simply displaying colored field maps.
The market comprises revenue attributable to paid software that imports, cleans, maps, reconciles, predicts or evaluates crop-yield data. It includes identifiable yield-analysis modules and the attributable portion of integrated farm-management subscriptions, together with specialist orchard crop-load and harvest-forecasting analytics. It excludes combine-mounted sensors, grain-flow monitors, telematics hardware, entire agricultural equipment purchases, free software access, standalone weather applications and unrelated farm accounting or crop-protection subscriptions.
The commercial opportunity is narrower than the installed base of digitally connected fields. A harvest monitor may capture crop weight and moisture, yet its owner may use a no-charge machinery portal and purchase no separately identifiable yield-analytics service. Conversely, one agronomic adviser may operate a paid analysis platform across many growers. Revenue therefore depends on the number of monetized hectares, software functionality attributable to yield analysis and the realized software fee, rather than a count of monitored acres or connected machines alone.
Data quality determines the value proposition. Combine-flow sensor lag, header position, overlapping passes, moisture adjustment and calibration errors can make an apparently detailed yield map unsuitable for estimating within-field profit. Yield-analysis software earns its fee when it converts imperfect harvest records into defensible comparisons of hybrids, fields, management zones and applied inputs. This is particularly important as seed, fertilizer and machinery costs force growers to justify variable-rate decisions against realized yield responses.
Market Dynamics
Harvest data integration, not sensor ownership, sets the addressable software market
Agricultural equipment manufacturers have materially expanded the amount of field data available for analysis. John Deere reported more than 520 million engaged acres and nearly 1.2 million connected machines in 2026, while Bayer describes FieldView as operating across more than 280 million subscribed acres. These figures establish a substantial distribution channel for yield-analysis services. They cannot be added together because farms may use multiple platforms, and neither indicator is a disclosure of paid yield-monitoring subscriptions.
The critical conversion occurs after the harvester leaves the field. Growers need consistent field boundaries, calibration and mass-flow adjustments, data cleaning and multi-season comparability before yield records can guide a seed-rate or fertilizer decision. A disconnected harvest map often remains an archived image. A cleaned and georeferenced dataset can become a repeatable management baseline, particularly when linked to planting and application records. Accordingly, software vendors compete on compatibility, automated correction and the usefulness of post-harvest reports rather than map generation alone.
The monetization constraint is visible in current product pricing. FieldView offers a no-cost Basic tier and advertises Plus from US$649 per year, while GeoPard lists an annual plan starting at US$0.59 per acre with multiple agronomic functions included. Charging all subscribed acres the full annual price, or assigning an entire multifunction package to yield analytics, would exaggerate this market. Suppliers are increasingly positioning paid analytics around specific decisions: comparing varieties, evaluating input treatments and establishing where the next year's prescription can be improved.
Agronomic economics increasingly favor accountable, field-level decisions
Input costs make within-field profitability more important than a farm's average harvested yield. A grower may record acceptable overall corn production while repeated low-return zones absorb an unjustified share of fertilizer, seed or crop-protection spending. The relevant analytical task is to compare yield, applied rates, crop prices and operating conditions on the same spatial grid. This changes the supplier's value proposition from viewing maps to documenting whether extra agronomic spending pays for itself.
GeoPard's 2026 product developments illustrate this transition. Its automated Yield Report compares cleaned harvest data with variable-rate prescriptions and actual application records, presenting crop-response and rate-level economics by zone. Such tools can support subscriptions even when the original yield map is readily available through a machinery portal. However, a reported response is not automatically causal. Soil differences, rainfall, hybrid choice, missing harvest passes and calibration errors must be considered before a grower attributes a better yield to one input decision.
Commercial adoption therefore depends on analytical credibility and the ability to explain uncertainty. Tools providing transparent corrections and comparisons can sustain specialist pricing among advisers and large growers. Products that merely duplicate free visualization compete against a substantially lower willingness to pay. The result is a split market: broad low-cost distribution through equipment ecosystems and narrower premium demand for agronomic evaluation, trials, multi-farm benchmarking and specialist crop analytics.
Multi-brand connectivity increases value but raises implementation costs
Mixed machinery fleets generate yield files with different formats, field identifiers, moisture conventions and coordinate systems. Even where exports are technically available, manual joining can create significant agronomist labor costs. Software that normalizes these data can improve workflow economics because the same adviser can serve more hectares without reproducing data preparation for each brand or harvest season.
PTx Trimble's yield-monitoring workflow combines live measurement and moisture data with subsequent office analysis of varieties, field performance and load-ticket reconciliation. Ag Leader's SMS software also emphasizes multi-year yield analysis, while GeoPard supports machine-file imports and connectivity with operations platforms. These are commercially relevant capabilities because the buyer often already owns a yield-capable harvester. The additional software purchase must remove a measurable data-handling or decision-making burden.
Interoperability also creates platform risk. Equipment providers may make basic mapping and farm-data storage available without a separate subscription to retain customer engagement. Independent vendors must therefore demonstrate differentiated cleaning, statistical comparisons, open file support, advanced reporting or multi-brand operation. Price increases will be limited where a customer can complete the essential workflow with tools already included in the machinery relationship.
Market Restraints
Free and bundled software compresses the addressable paid revenue pool
The largest commercial restraint is not a lack of agricultural data. It is that data recording, basic mapping and sometimes substantial analytics are included in broader equipment or platform offerings. New Holland states that FieldOps connectivity is included for life on its 2026 Speedrower 1 Series, illustrating how equipment manufacturers use software access to support hardware differentiation rather than charging separately for every digital function. FieldView similarly maintains a free entry tier.
This makes counting connected accounts as recurring yield-monitoring revenue unreliable. A paying customer's subscription may include scouting, imagery, prescriptions, compliance and agronomic support. Only the portion attributable to yield monitoring should enter a narrowly defined market. Suppliers can improve monetization through advanced reports, specialist support and enterprise integrations, but the basic software layer faces persistent price competition from bundled alternatives.
Yield-data integrity and evidence quality limit renewal value
Software cannot reliably recover information that a poorly configured harvest system never recorded. Header-width errors, flow-sensor response lags, wet-weight conversion, harvest moisture adjustments and overlaps can contaminate yield datasets. A flawed map may lead a grower to reduce fertilizer in an area that merely appears unproductive because of harvesting artifacts. Once such recommendations produce questionable field results, subscription renewal becomes harder to justify.
The commercial consequence is increased investment in cleaning, calibration, exception handling and audit trails. Vendors that automate these steps can reduce adviser labor and improve retention, but suppliers also carry greater support obligations. Adoption may remain lower among growers whose machinery lacks calibrated yield acquisition or whose operations cannot collect stable data across several seasons. Remote sensing estimates can partly fill spatial gaps, but they do not replace calibrated harvested-output measurements without additional assumptions.
Segment Analysis
By Crop Type: Broadacre crops
Broadacre farming represents the leading application base for paid yield-analysis software because grain harvesters have established yield and moisture acquisition workflows, and agronomic decisions are frequently repeated over large acreages. The broadacre segment is projected to reach US$251.39 million by 2032. Corn, soybean, wheat and other field crops are particularly suited to multi-year maps of yield response, cultivar performance and variable-rate management because field boundaries and management actions can be recorded spatially from planting through harvest.
The distinction between a yield monitor and paid yield-monitoring software is especially important in this segment. USDA research indicates that yield monitoring and maps are widely used among large American crop farms, while earlier crop-level studies document substantial differences between raw yield monitor ownership and adoption of more advanced yield-map workflows. A harvester operator may already have a monitor, guidance display and manufacturer data account. For a standalone software provider, the real addressable customer is the user willing to pay for better analysis or lower data-processing costs, not everyone who has generated harvest data.
Supplier economics reflect this. A grower paying US$649 annually for FieldView Plus may have access to yield comparisons, prescription capabilities, imagery and additional decision-support functions. A grower subscribing to GeoPard can use yield reports, data cleaning and field-zone analytics alongside a broader agronomic platform. Neither case justifies attributing the full package fee to yield analysis. Revenue is therefore estimated from the treated area using paid, yield-relevant features and the attributable annual price, with separately identifiable add-on modules considered only when actually charged.
Field-level comparative analysis has the strongest potential to convert existing data users into paying customers. Hybrid and seed-treatment performance must be evaluated across soil variation, timing and field-management conditions. At the same time, reconciliation between harvested grain, moisture and scale tickets is needed before yields can support credible operational decisions. A system that compares uncorrected mass-flow data across machines can generate visually convincing maps without producing reliable management evidence.
This creates room for independent platforms that clean raw yield files, reconcile field boundaries and compare historical productivity zones. An adviser serving multiple mixed-brand farms can justify the software fee if automated processing reduces manual intervention and helps retain customers. By contrast, a single small grower may find that the basic functionality included with existing machinery is sufficient. Market expansion therefore depends on scalable adviser workflows and quantified agronomic value, rather than simply the sale of more harvest monitors.
Europe and North America anchor much of the present broadacre monetization, while South American cereal and oilseed producers offer additional opportunities as precision application expands. Expansion in Asia Pacific remains more sensitive to farm fragmentation, digital support costs, grower organization and the adoption of compatible mechanized harvesting. The competitive advantage will increasingly rest with platforms that translate harvest history into economically defendable prescriptions across varied field conditions.
By Crop Type: Specialty crops
Specialty-crop software serves a different operating problem. Orchards and vegetable growers may need crop-load estimation, predicted harvest volumes, block-level yield comparisons, picking records and packhouse reconciliation rather than conventional combine maps. This segment is estimated at US$133.38 million in 2026. Per-hectare spending can be higher than for grain farms because fruit value, labor planning, harvest scheduling and the financial cost of forecasting errors are greater. Yet the tools must accommodate irregular canopies, changing fruit visibility and more complex links between field output and marketable packout.
Croptracker's fruit harvest software illustrates the connection between harvest records, traceability and yield reporting. These applications can be commercially valuable, but the entire packhouse or traceability subscription should not automatically be counted as yield-monitoring revenue. Only the identifiable crop-load, estimate and yield-analysis component belongs within the market boundary.
By Application
Harvest yield mapping, correction and multi-season analysis remains the principal foundational workflow, with an estimated US$102.28 million in 2026. Variety and treatment performance tools derive value from linking harvest results to seed, management and application records. Moisture and load reconciliation supports consistency between observed grain flow and commercial deliveries. Yield prediction, crop-load estimation and profitability benchmarking are an expanding layer, particularly in specialist crops and advisers' analytics businesses.
The segmentation is based on attributable software revenue for the primary purchased functionality. It is not an additive count of every feature available within one subscription, which would overstate market revenue for multifunction platforms.
By Deployment
Cloud platforms account for the majority of revenue because georeferenced harvest datasets increasingly need to be shared among growers, contractors, advisers and equipment systems. Cloud access supports near-real-time uploads, organization-wide comparisons and integration with third-party data. However, desktop and locally processed products remain useful when connectivity is unreliable, data-handling policies restrict cloud sharing, or customers rely on established analysis workflows.
Geographical Outlook
Europe: Advisory density supports yield analytics monetization
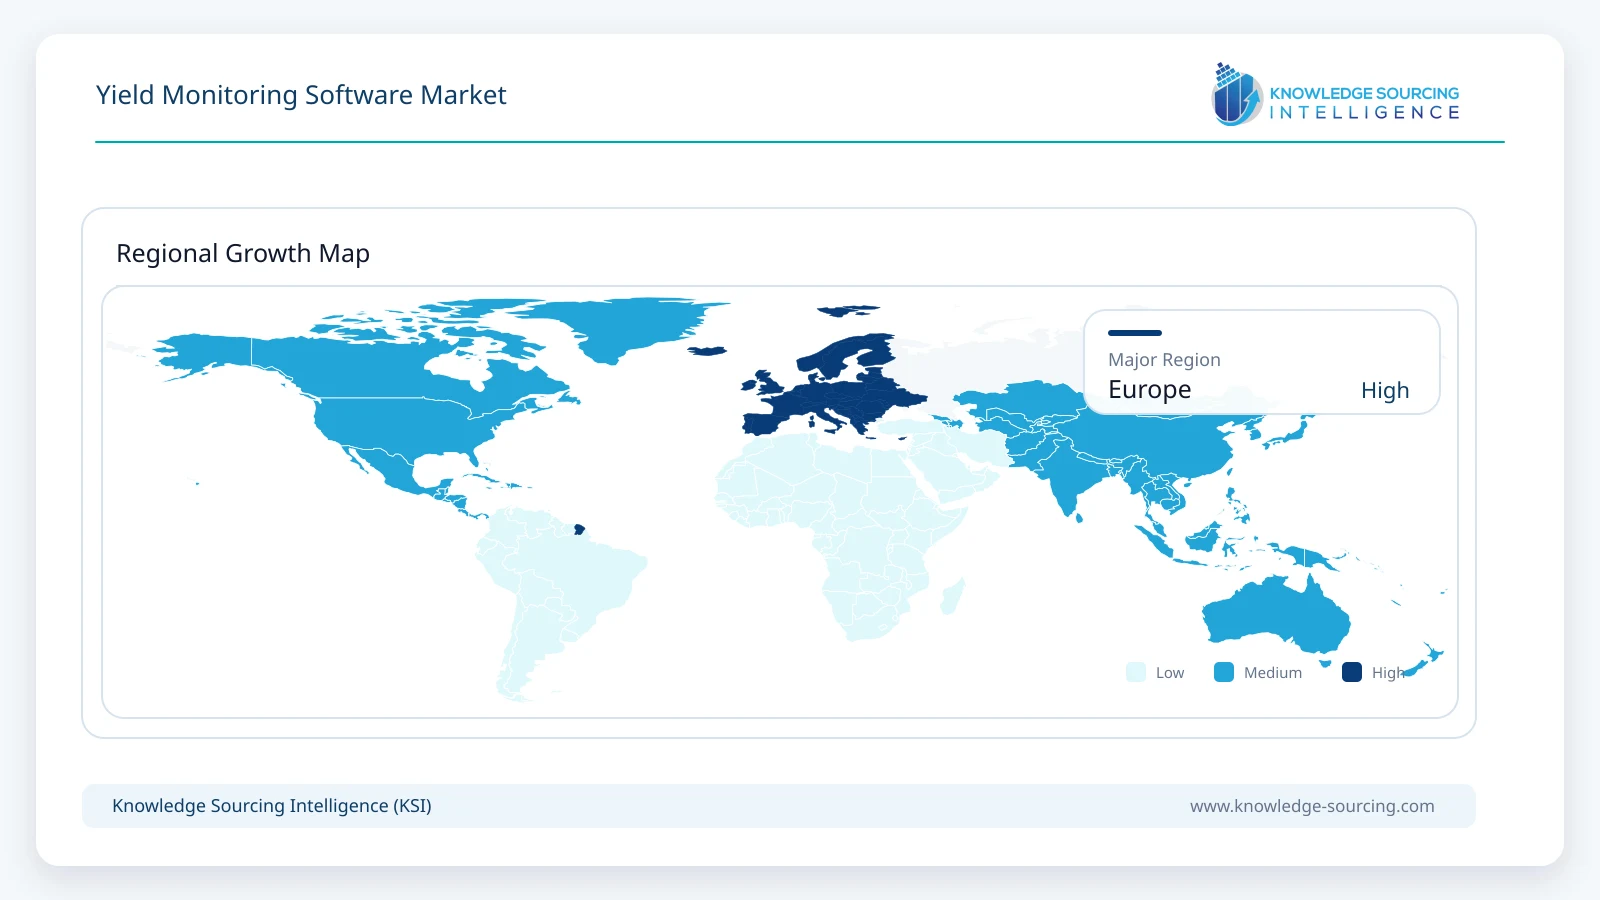
Europe is estimated to account for US$105.60 million in 2026, making it the largest modeled regional market under the narrowly defined software boundary. Its position reflects established precision-agriculture advisers, commercially managed broadacre farming and a comparatively substantial specialty-crop software base. Machine-data interoperability and compliance reporting influence the purchasing decision, but basic field-data accessibility does not necessarily create recurring revenue.
European customers often manage mixed machinery fleets, seasonal labor requirements and varying farm sizes. These conditions increase the value of software that imports different equipment files and generates standardized field reports. Premium applications include post-harvest variety comparisons, management-zone profitability and specialist fruit-yield forecasting. However, platform competition limits pricing where cloud recordkeeping is provided free or bundled with machinery. Suppliers must translate analytical outputs into reduced adviser workload, better treatment decisions or more dependable harvest planning to maintain subscriptions.
In North America, installed yield-acquisition capacity and strong equipment ecosystems support demand but also intensify competition from included machinery portals. South America offers opportunities linked to large commercial grain farms and cross-season analysis, while Asia Pacific and the Middle East and Africa remain more dependent on grower consolidation, service-led sales and the commercial viability of subscription pricing.
Competitive Environment
Competition spans equipment-linked agronomic software, independent yield analytics and specialty-crop harvest platforms. John Deere's Operations Center, Bayer's Climate FieldView, CNH's FieldOps, AGCO's PTx Trimble business and Ag Leader operate close to the machinery and harvest-data layer. GeoPard, EOS Data Analytics, OneSoil and other independent platforms compete through analytical depth, interoperability and adviser workflows. Croptracker and specialist orchard software providers address crop-load assessment, harvest estimation and traceability-linked yield records.
These businesses should not be ranked by corporate revenue, total connected acreage or tractor shipments. Such metrics do not reveal revenue attributable to yield-monitoring software. Competitive comparisons need to distinguish free access, paid modules, multi-function subscriptions, specialist analytics and implementation services. The defensible commercial question is whether a customer pays specifically for cleaner yield data, more reliable forecasts or better management decisions, rather than whether a platform can display field information.
Recent Developments
October 2026: Bayer introduced FieldView Advisor for dealer-supported crop planning, scouting and grower decision workflows.
September 2026: GeoPard released its Yield Report with management-zone yield comparisons and variable-rate application economics.
September 2026: John Deere introduced its JD AI assistant within Operations Center to help farmers interrogate field and operational data.
July 2026: New Holland launched the Speedrower 1 Series with Relative Yield Monitoring and lifetime FieldOps connectivity.
March 2026: GeoPard added field-trial design, synthetic yield maps and farm-level statistics to its platform.
Yield Monitoring Software Market Scope
| Report Metric | Details |
|---|---|
| Total Market Size in 2026 | USD 278.8 million |
| Total Market Size in 2032 | USD 498.6 million |
| Forecast Unit | Million |
| Growth Rate | 10.2% |
| Study Period | 2021 to 2032 |
| Historical Data | 2021 to 2024 |
| Base Year | 2025 |
| Forecast Period | 2026 – 2032 |
| Segmentation | Crop Type, Primary Application, Deployment, Geography |
| Companies |
|
| Customization Scope | 15% Free Customization included with purchase — Request Custom Breakdown → |
| Sample & Data Access | PDF Sample, Excel Databook & Analyst Briefing — Download Free Sample → |
Market Segmentation
By Crop Type
Broadacre Crops
Corn
Soybeans and Other Oilseeds
Wheat and Other Cereals
Other Broadacre Crops
Specialty Crops
Fruits and Orchards
Vegetables and Other Specialty Crops
By Primary Application
Harvest Yield Mapping and Calibration
Variety and Treatment Performance Analysis
Moisture and Load Reconciliation
Yield Forecasting and Benchmarking
By Deployment
Cloud
On-Premise / Desktop
By Geography
North America
United States
Canada
Mexico
South America
Brazil
Argentina
Others
Europe
Germany
France
United Kingdom
Spain
Others
Middle East and Africa
South Africa
Saudi Arabia
Others
Asia Pacific
China
India
Japan
Australia
Others
Table of Contents
1. EXECUTIVE SUMMARY
1.1. Global Market Size and Forecast, 2026–2032
1.2. Key Market Findings
1.3. Commercial Opportunities and Risks
2. RESEARCH SCOPE AND METHODOLOGY
2.1. Market Definition and Revenue Boundaries
2.2. Inclusions, Exclusions and Attribution
2.3. Crop-Area × Paid Adoption × Yield-Software Spend Method
2.4. Source Validation and Forecast Assumptions
3. MARKET OVERVIEW
3.1. Harvest Data and Yield Analytics Ecosystem
3.2. Farm Software Commercial Models
3.3. Machinery Data Interoperability
4. MARKET DYNAMICS
4.1. Drivers
4.2. Restraints
4.3. Opportunities
4.4. Technology Outlook
4.5. Value Chain and Competitive Forces
5. YIELD MONITORING SOFTWARE MARKET BY CROP TYPE
5.1. Broadacre Crops
5.1.1. Corn
5.1.2. Soybeans and Other Oilseeds
5.1.3. Wheat and Other Cereals
5.1.4. Other Broadacre Crops
5.2. Specialty Crops
5.2.1. Fruits and Orchards
5.2.2. Vegetables and Other Specialty Crops
6. YIELD MONITORING SOFTWARE MARKET BY PRIMARY APPLICATION
6.1. Harvest Yield Mapping and Calibration
6.2. Variety and Treatment Performance Analysis
6.3. Moisture and Load Reconciliation
6.4. Yield Forecasting and Benchmarking
7. YIELD MONITORING SOFTWARE MARKET BY DEPLOYMENT
7.1. Cloud
7.2. On-Premise / Desktop
8. YIELD MONITORING SOFTWARE MARKET BY GEOGRAPHY
8.1. North America
8.1.1. United States
8.1.2. Canada
8.1.3. Mexico
8.2. South America
8.2.1. Brazil
8.2.2. Argentina
8.2.3. Others
8.3. Europe
8.3.1. Germany
8.3.2. France
8.3.3. United Kingdom
8.3.4. Spain
8.3.5. Others
8.4. Middle East and Africa
8.4.1. South Africa
8.4.2. Saudi Arabia
8.4.3. Others
8.5. Asia Pacific
8.5.1. China
8.5.2. India
8.5.3. Japan
8.5.4. Australia
8.5.5. Others
9. COMPETITIVE ENVIRONMENT AND ANALYSIS
9.1. Provider and Product Positioning
9.2. Pricing, Bundling and Revenue Attribution
9.3. Partnerships, Integrations and Product Launches
9.4. Competitive Dashboard
10. COMPANY PROFILES
10.1. Deere & Company (John Deere Operations Center)
10.2. Bayer AG (Climate FieldView)
10.3. Ag Leader Technology
10.4. AGCO Corporation (PTx Trimble)
10.5. CNH Industrial N.V. (FieldOps)
10.6. Topcon Corporation
10.7. GeoPard Agriculture
10.8. EOS Data Analytics
10.9. OneSoil
10.10. Syngenta Group (Cropwise)
10.11. Croptracker (Dragonfly IT)
10.12. Hectre
11. APPENDIX
11.1. Currencies and Units
11.2. Modeling Assumptions
11.3. Forecast Timeline
11.4. Research Methodology
11.5. Abbreviations
11.6. List of Tables and Figures





Frequently asked questions
What is the projected market size of yield monitoring software by 2032?
Market projected to reach USD 498.6 million by 2032 at 10.2% CAGR.
Which crop type contributes most to yield monitoring software revenue?
Broadacre crops account for an estimated 52.2% of 2026 revenue.
Which deployment model dominates the Yield Monitoring Software Market?
Cloud-based deployments represent 85.7% of estimated 2026 revenue.
What future yield analysis functionality is projected to grow fastest?
Yield forecasting and benchmarking are projected to outgrow basic harvest mapping.
What types of solutions are included in the market definition?
Paid yield analysis software, modules, and attributable farm management subscriptions are included.
Cite this report
Knowledge Sourcing Intelligence. (Nov 2026). Yield Monitoring Software Market - Strategic Insights and Forecasts (2026-2032). https://www.knowledge-sourcing.com/report/yield-monitoring-software-market