Blogs
Latest insights, analysis, and updates from our experts.

Solar Control Window Films Market expected to reach USD 1,224.951 million by 2030
Solar Control Window Films Market Trends & Forecast According to a research study published by Knowledge Sourcing Intelligence (KSI), the solar control window films...

Top Companies Leading the Silicon-Based Capacitor Revolution
Introduction: The Rise of Silicon-Based Capacitors: Electronic circuits use basic capacitors as storage devices to handle three essential tasks including filtering, decoupling, and signal coupling. High-performance silicon capacitors h...

The Role of Chemical Blowing Agents in Sustainable Foaming Solutions
The foam industry is growing at a significant rate, with an increasing trend towards sustainability leading to an increase in demand for lightweight, sustainable materials across industries. This sustainability in foaming solutions is driven by chemical blowing agents, which are specialized compound...

Top 10 Emerging Beverages Set to Dominate the Market in the Coming Years
Top 10 fastest-growing beverage types across the globe: Carbonated Drinks Juice Vegan Milk Fermented Cider Perry Beer Nut Wine Energy Drinks Sake Fruit Flavoured...

The Impact of Changing Consumer Preferences on the Coffee Pods Industry
The single-use coffee container, commonly referred to as the coffee pod, is synonymous with the tea bag and prepares just a single coffee. The major attraction of it is its one-time use and throw nature for customers, as it removes the additives and other flavors from their brewing process and thus...

Top Innovations in Biodegradable Packaging Materials for a Sustainable Future
Packaging plays such an important role in our lives and really matters for almost every purchase choice made by a person in terms of product buying. But in the woke world, it seems that with all the growing concerns across the globe regarding waste, one can find the packaging industry now facing the...

The Impact of Recycling Initiatives on the Bottled Water Packaging Industry
As it provides an easy means of getting hydrated, the bottled water industry is always under sharp scrutiny regarding the environmental implications associated with plastic packaging. In addition to their colos...

Applications of Smart Windows: From Residential Homes to Commercial Skyscrapers
Smart windows are a type of window, which is equipped with multiple features, glazed glass that helps in controlling the various forms of light, like UV and IR rays. The smart windows also help maintain the temperature of an infrastructure, which further reduces the cost of energy. The key component...

Emerging Trends in Baby Food: Plant-Based, Allergen-Free, and Functional Nutrition
The flourishing transformation of the baby food sector is mainly focused on the increasing demand for environment-friendly, clear, and healthy food choices, a shift in taste from parents, and the urges for health consciousness. Parents now want products that will nourish their newborn babies but als...

The Impact of Dietary Trends on the Glucose Syrup Market: Sugar Alternatives and Substitutes
Glucose syrups are derived from plant sugars extracted from cereals, primarily wheat and maize. They are added to foods to provide an additional factor of texture, flavor, and glossiness. They are characterized as clear and viscous liquid, sweet taste, and a calorific level of 4kcal/g. They are extr...

Key Players in the Polycarbonate Market: Strategies and Innovations Shaping the Industry
Polycarbonate is the term applied to a supple thermoplastic polymer which has become one of the essentialities in various industries. It is used for impact resistance, optical clarity, weightiness, and heat resistance. Different industries where applications are found include automobiles, electronic...
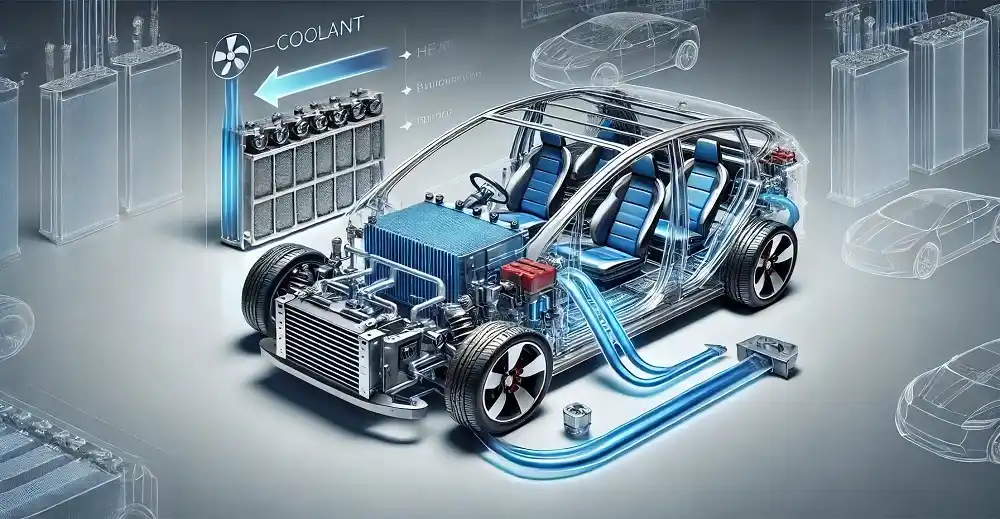
How Efficient Battery Cooling Systems Are Shaping the Future of Electric Vehicles
A battery cooling system is defined as a way of controlling the temperature of an electric vehicle (EV) during performance or while charging. The battery charging method serves effectively in improving the life of an EV battery while also increasing performance with quick charge time. Battery coolin...