Report Overview
Fiber Reinforced Polymer (FRP) Composites Market Size:
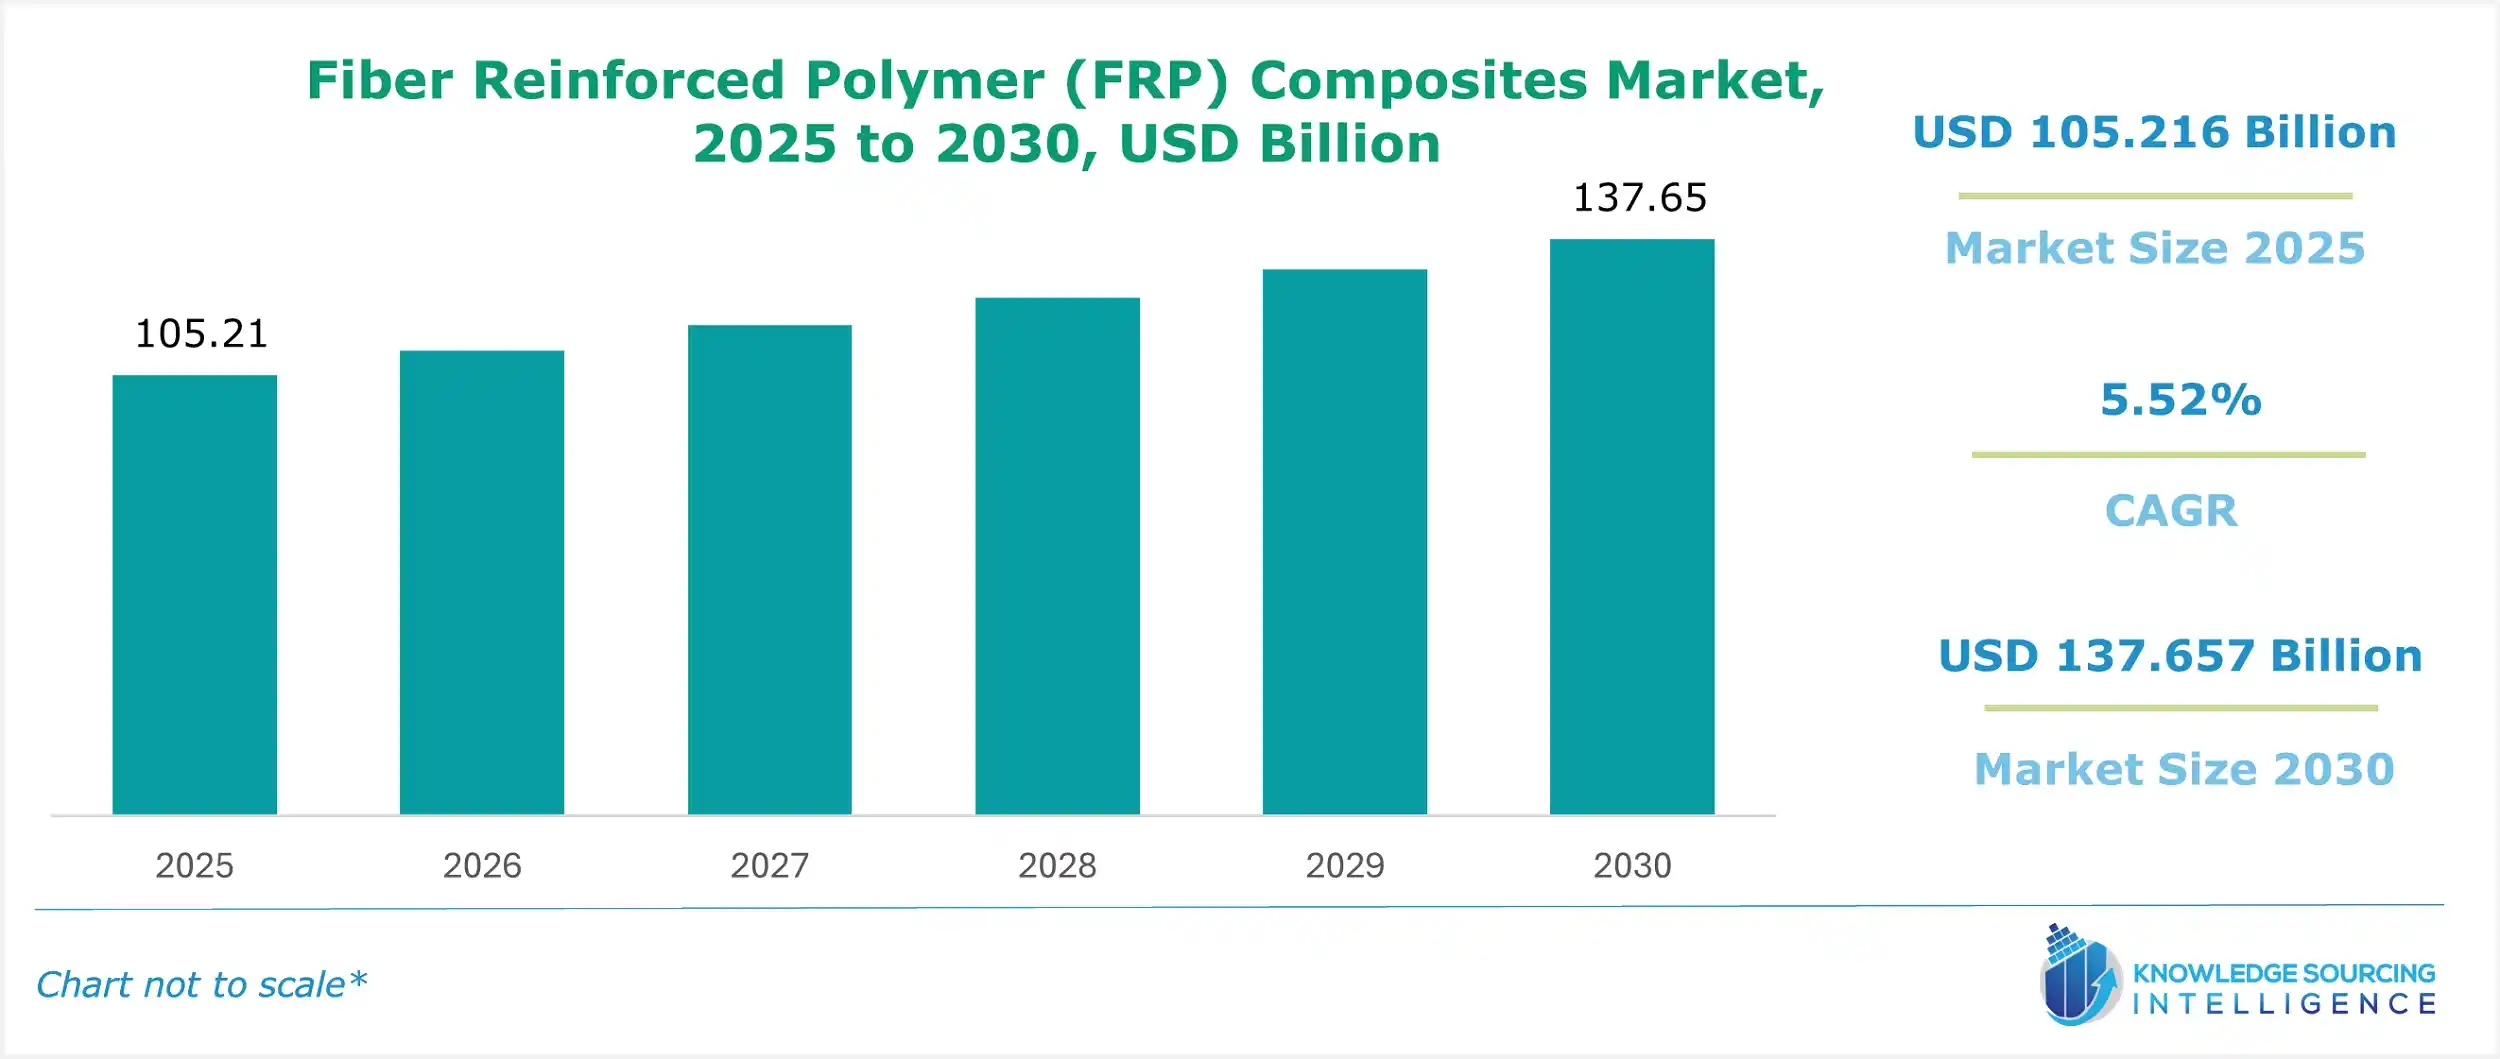
The fiber reinforced polymer (FRP) composites market is expected to grow from US$105.216 billion in 2025 to US$137.657 billion in 2030, at a CAGR of 5.52%.
The fiber-reinforced polymer (FRP) composites market is a cornerstone of the advanced composites market, driven by demand for lightweight materials in industries like aerospace, automotive, and construction. Composites manufacturing leverages fibers such as carbon, glass, and aramid, combined with polymer matrices, to produce high-performance composites with superior strength-to-weight ratios. These materials offer exceptional durability, corrosion resistance, and design flexibility, making them ideal for applications requiring structural efficiency and longevity.
The fiber-reinforced polymer composites are employed as a substitute for steel building constructions in the construction sector. Composites made of polymers are 25% lighter and 25% stronger than steel. They also provide resistance to rust and wear and tear. The automobile parts are lighter, stronger, and more moldable than aluminum car parts, making them safer and more fuel-efficient. They are employed in the creation of structural elements for automobiles. As industries prioritize sustainability and fuel efficiency, the lightweight materials industry continues to expand, with FRP composites playing a pivotal role in next-generation engineering solutions.
Moreover, it is anticipated that during the projected period, demand for FRP composites will also increase due to the expansion of the electric vehicle market. By lowering the weight of the drive train, the use of composite materials will aid in extending the range of EVs. Also, it will enhance the mechanical and electrical characteristics of the driving systems. The fiber-reinforced polymer (FRP) composites market is driven by rising demand in the construction and transportation sectors.
Fiber Reinforced Polymer (FRP) Composites Market Trends:
The FRP composites market is evolving with a focus on sustainability and innovation. Sustainable composites, including recyclable and bio-based composites, are gaining traction to meet environmental regulations and reduce carbon footprints. Composite additive manufacturing is revolutionizing production, enabling complex geometries and reduced waste. Automation in composites enhances manufacturing efficiency, ensuring precision and scalability. Smart composites, integrated with structural health monitoring for FRP, enable real-time performance tracking and predictive maintenance in aerospace and infrastructure industries. These trends reflect the industry’s shift toward eco-friendly, high-performance solutions, aligning with global demands for advanced, durable materials.
Fiber Reinforced Polymer (FRP) Composites Market Driver:
- The transportation sector extensively uses fiber-reinforced polymer (FRP) composites in everything from cars to ships and boats to planes and helicopters.
Due to weight and cost considerations, fiber-reinforced polymer (FRP) composite material is an ideal substitute for traditional materials like steel or aluminum in transportation. In maritime waterfront settings or on ships, where they lessen the structural weight and improve corrosion resistance, FRPs are the perfect substitutes for wood. Further, worldwide deliveries of more than 43,110 new airplanes are required, as stated by Boeing, with over 70% of new deliveries projected to be single-aisle aircraft, and demand for more than 32,270 aircraft is expected to increase by 2040. The average annual growth rate for passenger air travel over the past ten years was 6.5%, significantly higher than the long-term average of 5%. To meet passenger demand, numerous airlines worldwide increased the number of aircraft in their fleets by taking delivery of new aircraft.
Similarly, OCIA estimated that 80.14 million automobiles will be produced worldwide in 2021. Compared to 2020, the production capacity grew by 3%. Consequently, an increase in automotive vehicle manufacturing and aircraft deliveries is projected to increase demand for composite materials made of fiber-reinforced polymer.
Fiber Reinforced Polymer (FRP) Composites Market Segment Analysis:
- Based on the end-user industry, the fiber-reinforced polymer (FRP) composites market is expected to grow positively in the automotive segment.
The automotive market is primarily driven by the increasing demand for lightweight materials to improve fuel efficiency and reduce emissions, and the need for materials with high strength-to-weight ratios for vehicle components. Some of the top players in the automotive segment of the FRP composites market include Owens Corning, SGL Group, Teijin Limited, Mitsubishi Chemical Corporation, Toray Industries, and Gurit Holding AG. These companies offer a range of FRP composite products for automotive applications, including body panels, structural components, and interior parts.
Additionally, the increasing use of electric and hybrid vehicles is expected to further drive the growth of the FRP composites market in the automotive sector, as these vehicles require lightweight materials to maximize their battery range. As a result, FRP composites are becoming increasingly popular as they offer high strength-to-weight ratios and are corrosion-resistant. In addition, FRP composites can be molded into complex shapes, allowing for greater design flexibility in manufacturing electric vehicle components.
The electric car market is a rapidly evolving and dynamic area of clean energy. With advancements in battery technology and increasing concerns about climate change and air pollution, the demand for electric cars is growing at an unprecedented rate. This growth is driven by a combination of factors, including government incentives and regulations, improvements in charging infrastructure, and the development of new and innovative electric car models by automakers. As electric vehicles require lightweight materials to maximize their battery range, FRP composites are becoming increasingly popular as they offer high strength-to-weight ratios and are corrosion-resistant. In addition, FRP composites can be molded into complex shapes, allowing for greater design flexibility in manufacturing electric vehicle components.
Fiber Reinforced Polymer (FRP) Composites Market Geographical Outlook:
- North America accounted for a major share of the global fiber-reinforced polymer (FRP) composites market.
By geography, the fiber reinforced polymer (FRP) composites market has been segmented into North America, South America, Europe, the Middle East and Africa, and the Asia Pacific.
The aerospace industry is a key consumer of FRP composites in North America, driven by the need for lightweight materials that can improve fuel efficiency and reduce carbon emissions. FRP composites are used in various aircraft components, such as wings, fuselage, and tail sections, and their demand is expected to grow in the coming years. This driver is expected to continue driving growth in the North American FRP composites market. The construction industry is also a significant consumer of FRP composites in North America, especially for strengthening and retrofitting infrastructure. FRP composites offer several advantages over traditional materials, such as a high strength-to-weight ratio, corrosion resistance, and ease of installation. The increasing investments in infrastructure development in the region are expected to drive demand for FRP composites in the coming years. According to the US Census Bureau[1], construction spending in the US was estimated at $1.44 trillion in 2020. The increasing investments in infrastructure development, such as highways, bridges, and airports, are expected to drive demand for FRP composites in the construction industry.
Fiber Reinforced Polymer (FRP) Composites Market Key Developments:
- In January 2025, Crane Composites launched GLASBOND, which is an advanced solution that provides a prefabricated adhesive-backed design for its FRP panels. This product offers installation up to 60 percent faster than traditional FRP.
List of Top Fiber Reinforced Polymer (FRP) Composites Companies:
- American Fiberglass Rebar
- Mitsubishi Chemical Corporation
- SGL Carbon SE
- DowAksa
- Engineered Composites Ltd
Fiber Reinforced Polymer (FRP) Composites Market Scope:
| Report Metric | Details |
|---|---|
| Study Period | 2021 to 2031 |
| Historical Data | 2021 to 2024 |
| Base Year | 2025 |
| Forecast Period | 2026 – 2031 |
| Report Metric | Details |
| Fiber Reinforced Polymer (FRP) Composites Market Size in 2025 | US$105.216 billion |
| Fiber Reinforced Polymer (FRP) Composites Market Size in 2030 | US$137.657 billion |
| Growth Rate | CAGR of 5.52% |
| Study Period | 2020 to 2030 |
| Historical Data | 2020 to 2023 |
| Base Year | 2024 |
| Forecast Period | 2025 – 2030 |
| Forecast Unit (Value) | USD Billion |
| Segmentation |
|
| Geographical Segmentation | North America, South America, Europe, Middle East and Africa, Asia Pacific |
| List of Major Companies in Fiber Reinforced Polymer (FRP) Composites Market |
|
| Customization Scope | Free report customization with purchase |
Fiber Reinforced Polymer (FRP) Composites Market Segmentation:
- BY TYPE
- Aramid Fiber Reinforced Polymer (AFRP) Composites
- Glass Fiber Reinforced Polymer (GFRP) Composites
- Basalt Fiber Reinforced Polymer (BFRP) Composites
- Carbon Fiber Reinforced Polymer (CFRP) Composites
- Natural Fiber Reinforced Polymer (NFRP) Composites
- Hybrid Fiber Reinforced Polymer Composites
- Others
- BY END-USER INDUSTRY
- Automotive
- Electrical & Electronics
- Building & Construction
- Defense
- Aerospace
- Marine
- Wind Energy/Renewable Energy
- Sports & Leisure
- Oil & Gas
- Others
- By Geography
- North America
- USA
- Canada
- Mexico
- South America
- Brazil
- Argentina
- Others
- Europe
- Germany
- France
- United Kingdom
- Spain
- Others
- Middle East and Africa
- Saudi Arabia
- UAE
- Others
- Asia Pacific
- China
- India
- Japan
- South Korea
- Indonesia
- Thailand
- Others
- North America
Market Segmentation
By Type
By End-user Industry
By Geography
Table of Contents
1. EXECUTIVE SUMMARY
2. MARKET SNAPSHOT
2.1. Market Overview
2.2. Market Definition
2.3. Scope of the Study
2.4. Market Segmentation
3. BUSINESS LANDSCAPE
3.1. Market Drivers
3.2. Market Restraints
3.3. Market Opportunities
3.4. Porter’s Five Forces Analysis
3.5. Industry Value Chain Analysis
3.6. Policies and Regulations
3.7. Strategic Recommendations
4. TECHNOLOGICAL OUTLOOK
5. FIBER REINFORCED POLYMER (FRP) COMPOSITES MARKET BY TYPE
5.1. Introduction
5.2. Aramid Fiber Reinforced Polymer (AFRP) Composites
5.3. Glass Fiber Reinforced Polymer (GFRP) Composites
5.4. Basalt Fiber Reinforced Polymer (BFRP) Composites
5.5. Carbon Fiber Reinforced Polymer (CFRP) Composites
5.6. Natural Fiber Reinforced Polymer (NFRP) Composites
5.7. Hybrid Fiber Reinforced Polymer Composites
5.8. Others
6. SMART HOMES MARKET BY END-USER INDUSTRY
6.1. Introduction
6.2. Automotive
6.3. Electrical & Electronics
6.4. Building & Construction
6.5. Defense
6.6. Aerospace
6.7. Marine
6.8. Wind Energy/Renewable Energy
6.9. Sports & Leisure
6.10. Oil & Gas
6.11. Others
7. SMART HOMES MARKET BY GEOGRAPHY
7.1. Introduction
7.2. North America
7.2.1. USA
7.2.2. Canada
7.2.3. Mexico
7.3. South America
7.3.1. Brazil
7.3.2. Argentina
7.3.3. Others
7.4. Europe
7.4.1. Germany
7.4.2. France
7.4.3. United Kingdom
7.4.4. Spain
7.4.5. Others
7.5. Middle East and Africa
7.5.1. Saudi Arabia
7.5.2. UAE
7.5.3. Others
7.6. Asia Pacific
7.6.1. China
7.6.2. India
7.6.3. Japan
7.6.4. South Korea
7.6.5. Indonesia
7.6.6. Thailand
7.6.7. Others
8. COMPETITIVE ENVIRONMENT AND ANALYSIS
8.1. Major Players and Strategy Analysis
8.2. Market Share Analysis
8.3. Mergers, Acquisitions, Agreements, and Collaborations
8.4. Competitive Dashboard
9. COMPANY PROFILES
9.1. American Fiberglass Rebar
9.2. Mitsubishi Chemical Corporation
9.3. SGL Carbon SE
9.4. DowAksa
9.5. Engineered Composites Ltd
9.6. TUF-BAR
9.7. Owens Corning
9.8. Advanced Composites Inc.
9.9. Aeron Composite Pvt Ltd
9.10. Dextra Group
10. APPENDIX
10.1. Currency
10.2. Assumptions
10.3. Base and Forecast Years Timeline
10.4. Key benefits for the stakeholders
10.5. Research Methodology
10.6. Abbreviations
Fiber Reinforced Polymer (FRP) Composites Market Report
Trusted by the world's leading organizations


