Report Overview
Augmented Analytics Market Size:
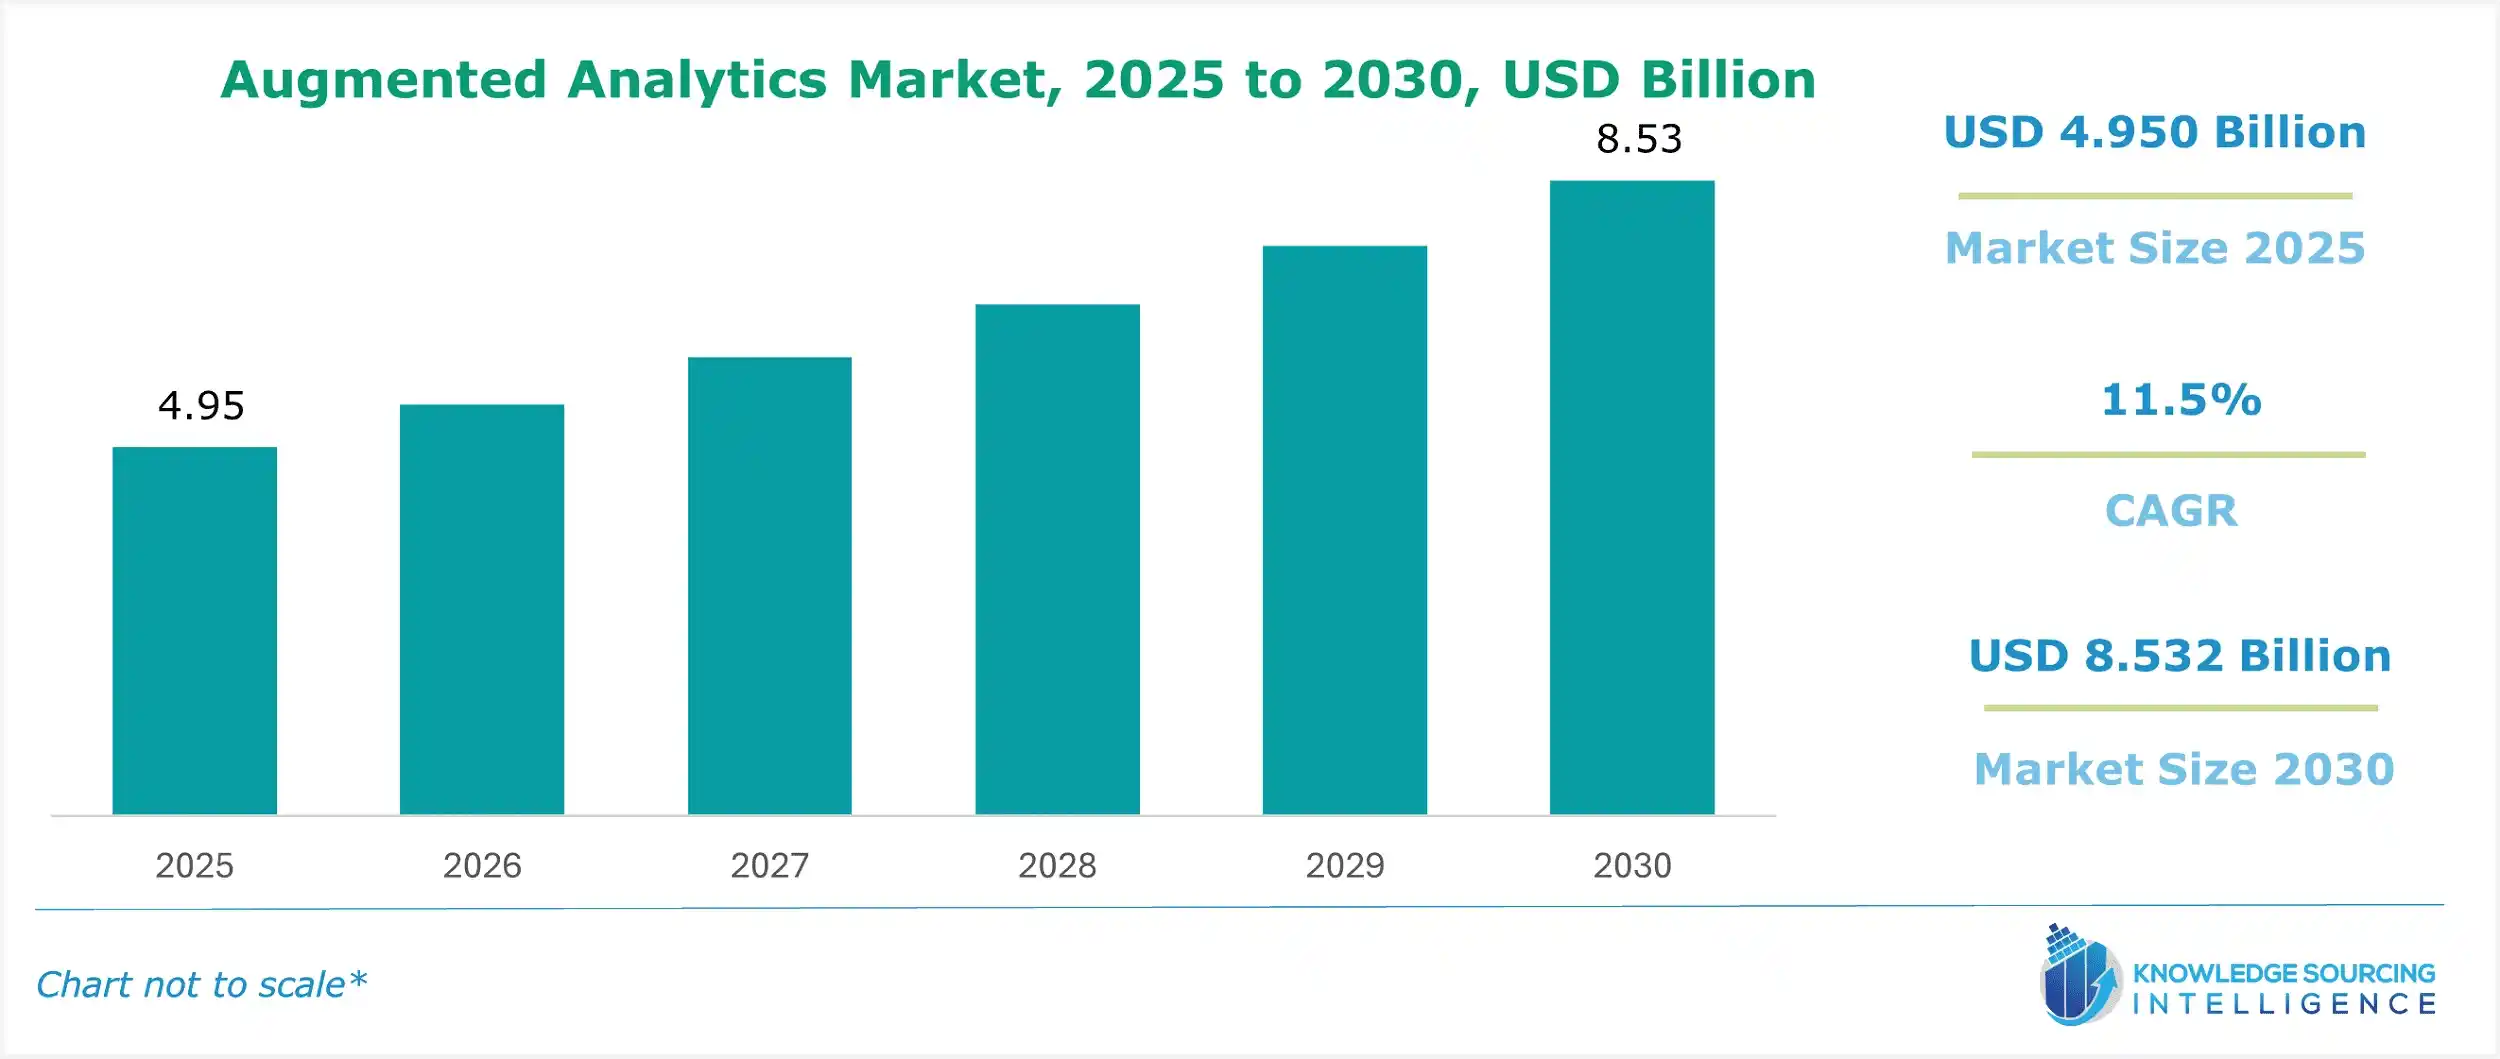
The global augmented analytics market, valued at US$8.532 billion in 2030 from US$4.950 billion in 2025, is projected to grow at a CAGR of 11.5% through 2030.
Highlights:
- 1AI and ML are enhancing augmented analytics, automating data analysis for faster insights.
- 2Cloud-based solutions are gaining traction, offering scalable, cost-effective data analysis platforms.
- 3Large enterprises are increasingly adopting augmented analytics to manage vast data volumes.
- 4Healthcare and finance sectors are leveraging augmented analytics for improved decision-making.
Advanced technologies like artificial intelligence (AI), machine learning, and natural language processing are employed in augmented analytics to help facilitate data analysis. Technology has enabled companies to make decisions faster and more appropriately for growth. Further, the notable increase in data drove the demand for analytical solutions and the adoption of AI across industries. The market grew more quickly due to this wave of digitalization across industries. In addition, the high growth of digital data will also increase the demand for sophisticated and effective tools for data analysis.
Global Augmented Analytics Market Overview & Scope:
The global augmented analytics market is segmented by:
- Components: The global augmented analytics market by component is segmented into hardware, software, and services. Software for augmented analytics helps both new and existing companies get precise insights from contextual data analysis for new projects and other data analyses. Additionally, it provides faster responses to questions about analysis without interfering with the analysis itself.
- Deployment Model: The market is segmented by deployment model into on-premise and cloud. Cloud-based deployment offers a flexible and agile environment for deploying the technology while removing the initial setup cost and future scaling. Additionally, small and medium-sized businesses with limited funds prefer cloud deployment because it provides a highly dependable environment with cheap data backup.
- Enterprise Size: The enterprise size is segmented into small, medium, and large. Multinational corporations produce large amounts of structured and unstructured big data across various industry verticals, leading to the widespread use of augmented analytics solutions in large enterprises. Due to their more considerable budgets, big businesses are increasingly spending on these solutions to handle the growing demand for accurate and relevant business insights while streamlining their operations.
- Industry Vertical: The industry vertical is segmented into retail, IT and telecom, BFSI, healthcare, government, manufacturing, and others. High healthcare expenditure necessitates the development of advanced technologies, leading to the advancement of diagnostic technology and therapies. Due to this, significant growth has been observed in partnership and collaboration rates among hospitals, large technology firms, healthcare startups, and research centers in AR.
- Region: The early adoption of advanced technologies, combined with the presence of major market players in the region, is the main driver of the augmented analytics market in North America.
Top Trends Shaping the Global Augmented Analytics Market:
1. Technology Integration
- The integration of AI and ML significantly redefines the global augmented analytics market. They facilitate better decision-making, data analysis automation, and predictive assessments. ML and AI help business firms quickly derive actionable insights by identifying and mapping patterns or trends in voluminous datasets. In addition, this trend boosts demand in essential industries such as healthcare and finance, where timely data analysis helps in improving operational efficiencies.
2. Increasing Use of Cloud
- Cloud-based augmented analytics solutions are becoming increasingly necessary because of their affordability, adaptability, and scalability. Cloud-based platforms allow businesses to analyze and gather massive volumes of data without the need for significant on-premise infrastructure.
Global Augmented Analytics Market Growth Drivers vs. Challenges:
Opportunities:
- High Data Volumes: The exponential production of data being generated in various industries makes it imperative that more advanced analytical capabilities be used. Augmented analytics solves this problem and provides scalable solutions to process and analyze millions of data points in well-designed large-scale data management solutions. For instance, Amazon Web Services launched an upgrade of its "Data Lake Formation" service.
- Self-Service Analytics: Self-service analytics tools enabling non-technical users to analyze data are becoming increasingly popular. This trend is also supported by the growing use of augmented analytics, providing an effortless interface for accessing and analyzing the data, and it gives insights automatically.
Challenges:
- Data Security Concerns: The use of augmented analytics brings up significant data privacy and security concerns, especially when sensitive data is involved. Hence, its adoption may be hampered by the complexity of ensuring strong protection and regulatory compliance. Even with initiatives to streamline analytics, managing and interpreting data from augmented analytics tools requires qualified experts. A lack of skilled data scientists and analysts may make implementation less successful.
Global Augmented Analytics Market Regional Analysis:
- North America: The strong presence of major market players, widespread use of AI and ML technologies, and robust technological infrastructure are the main reasons that have pushed North America to become a dominant region in the global augmented analytics market. Key industries in the area, such as retail, finance, and healthcare, are quickly implementing augmented analytics to improve decision-making and operational effectiveness.
Global Augmented Analytics Market Competitive Landscape:
The market is fragmented, with many notable players, including Microsoft, IBM, SAP Analytics Cloud, and Salesforce.com, inc., among others:
- Launch: In March 2024, TransUnion, a prominent U.S. credit bureau, launched OneTru, a new cloud-based platform that combines its suite of AI-powered fraud detection, credit risk assessment, and data analytics tools. This single portal aims to improve financial institutions' decision-making and expedite access to TransUnion's products.
Augmented Analytics Market Scope:
| Report Metric | Details |
|---|---|
| Study Period | 2021 to 2031 |
| Historical Data | 2021 to 2024 |
| Base Year | 2025 |
| Forecast Period | 2026 – 2031 |
| Report Metric | Details |
| Augmented Analytics Market Size in 2025 | US$4.950 billion |
| Augmented Analytics Market Size in 2030 | US$8.532 billion |
| Growth Rate | CAGR of 11.5% |
| Study Period | 2020 to 2030 |
| Historical Data | 2020 to 2023 |
| Base Year | 2024 |
| Forecast Period | 2025 – 2030 |
| Forecast Unit (Value) | USD Billion |
| Segmentation |
|
| Geographical Segmentation | North America, South America, Europe, Middle East and Africa, Asia Pacific |
| List of Major Companies in Augmented Analytics Market |
|
| Customization Scope | Free report customization with purchase |
Global Augmented Analytics Market Segmentation:
By Component
- Hardware
- Software
- Services
By Deployment Model
- On-Premise
- Cloud
By Enterprise Size
- Small
- Medium
- Large
By Industry Vertical
- Retail
- IT and Telecom
- BFSI
- Healthcare
- Government
- Manufacturing
- Others
By Region
- North America
- Europe
- Asia Pacific
- South America
- Middle East & Africa
Our Best-Performing Industry Reports:
Market Segmentation
By Component
By Deployment Model
By Enterprise Size
By Industry Vertical
By Geography
Table of Contents
1. EXECUTIVE SUMMARY
2. MARKET SNAPSHOT
2.1. Market Overview
2.2. Market Definition
2.3. Scope of the Study
2.4. Market Segmentation
3. BUSINESS LANDSCAPE
3.1. Market Drivers
3.2. Market Restraints
3.3. Market Opportunities
3.4. Porter’s Five Forces Analysis
3.5. Industry Value Chain Analysis
3.6. Policies and Regulations
3.7. Strategic Recommendations
4. TECHNOLOGICAL OUTLOOK
5. GLOBAL AUGMENTED ANALYTICS MARKET BY COMPONENT
5.1. Introduction
5.2. Hardware
5.3. Software
5.4. Services
6. GLOBAL AUGMENTED ANALYTICS MARKET BY DEPLOYMENT MODEL
6.1. Introduction
6.2. On-Premise
6.3. Cloud
7. GLOBAL AUGMENTED ANALYTICS MARKET BY ENTERPRISE SIZE
7.1. Introduction
7.2. Small
7.3. Medium
7.4. Large
8. GLOBAL AUGMENTED ANALYTICS MARKET BY INDUSTRY VERTICAL
8.1. Introduction
8.2. Retail
8.3. IT and Telecom
8.4. BFSI
8.5. Healthcare
8.6. Government
8.7. Manufacturing
8.8. Others
9. GLOBAL AUGMENTED ANALYTICS MARKET BY GEOGRAPHY
9.1. Introduction
9.2. North America
9.2.1. By Component
9.2.2. By Deployment Model
9.2.3. By Enterprise Size
9.2.4. By Industry Vertical
9.2.5. By Country
9.2.5.1. USA
9.2.5.2. Canada
9.2.5.3. Mexico
9.3. South America
9.3.1. By Component
9.3.2. By Deployment Model
9.3.3. By Enterprise Size
9.3.4. By Industry Vertical
9.3.5. By Country
9.3.5.1. Brazil
9.3.5.2. Argentina
9.3.5.3. Others
9.4. Europe
9.4.1. By Component
9.4.2. By Deployment Model
9.4.3. By Enterprise Size
9.4.4. By Industry Vertical
9.4.5. By Country
9.4.5.1. Germany
9.4.5.2. France
9.4.5.3. United Kingdom
9.4.5.4. Spain
9.4.5.5. Others
9.5. Middle East and Africa
9.5.1. By Component
9.5.2. By Deployment Model
9.5.3. By Enterprise Size
9.5.4. By Industry Vertical
9.5.5. By Country
9.5.5.1. Saudi Arabia
9.5.5.2. UAE
9.5.5.3. Israel
9.5.5.4. Others
9.6. Asia Pacific
9.6.1. By Component
9.6.2. By Deployment Model
9.6.3. By Enterprise Size
9.6.4. By Industry Vertical
9.6.5. By Country
9.6.5.1. China
9.6.5.2. Japan
9.6.5.3. India
9.6.5.4. South Korea
9.6.5.5. Indonesia
9.6.5.6. Taiwan
9.6.5.7. Others
10. COMPETITIVE ENVIRONMENT AND ANALYSIS
10.1. Major Players and Strategy Analysis
10.2. Market Share Analysis
10.3. Mergers, Acquisitions, Agreements, and Collaborations
10.4. Competitive Dashboard
11. COMPANY PROFILES
11.1. Microsoft
11.2. IBM
11.3. SAP Analytics Cloud
11.4. Salesforce.com, Inc.
11.5. Oracle
11.6. Sisense Inc.
11.7. MicroStrategy Incorporated
11.8. TIBCO Software Inc.
11.9. QlikTech International AB
11.10. Tellius, Inc.
12. APPENDIX
12.1. Currency
12.2. Assumptions
12.3. Base and Forecast Years Timeline
12.4. Key benefits for the stakeholders
12.5. Research Methodology
12.6. Abbreviations
Navigate
Trusted by the world's leading organizations


