Report Overview
Mechanical Power Transmission Market Size:
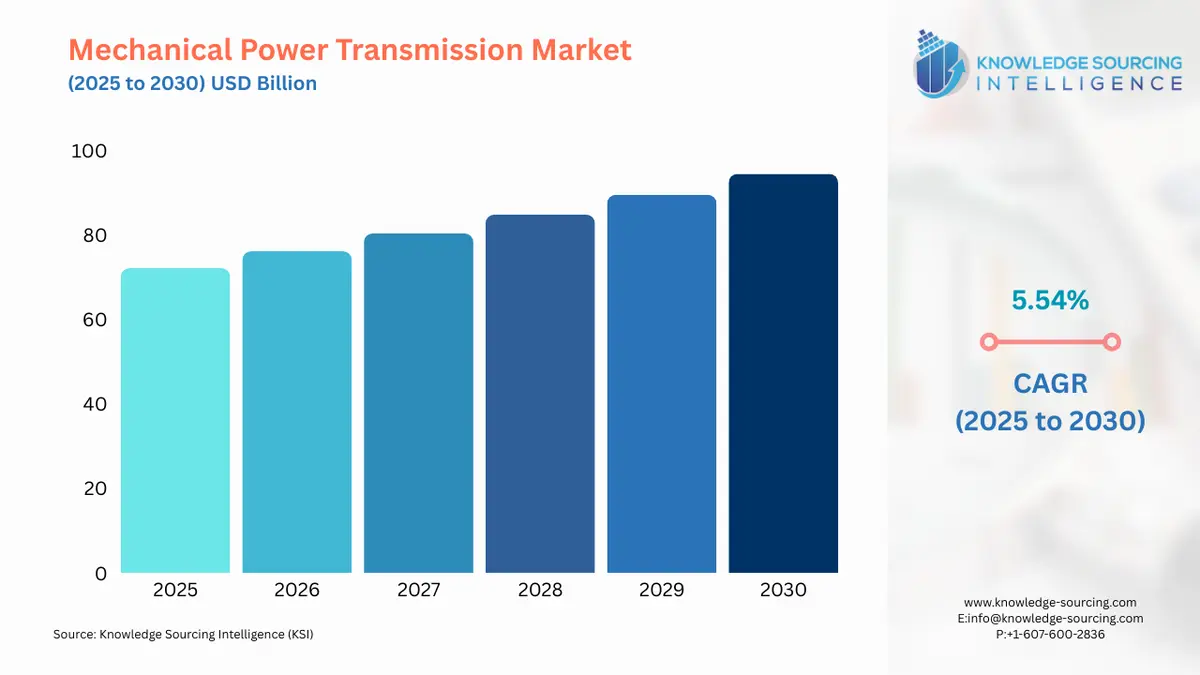
Mechanical Power Transmission Market, growing at a 5.54% CAGR, is expected to grow to USD 94.455 billion in 2030 from USD 72.149 billion in 2025.
When mechanical energy (physical motion) is transferred from one machine component to another, this is referred to as mechanical power transmission. The majority of machines require some kind of mechanical power transfer some of these are electric shavers, water pumps, turbines, and vehicles. Throughout the forecast period, the demand for mechanical power transmission products in the automotive sector is anticipated to develop significantly and in other sectors as well like manufacturing, aerospace & defense, and power & energy. Mechanical power transmission is also in demand with the increase in industrial production and machinery in manufacturing industries. Industrial manufacturing developments with an increase in the usage of modern machinery and heavy engine vehicles are driving the demand for high-performance mechanical power transmission which is expected to boost the market growth.

Mechanical Power Transmission Market Growth Drivers:
- The rising demand in the automotive industry will boost the market growth
The mechanical power transmission equipment that is most frequently utilized in automobiles and heavy transport vehicles can benefit from accelerating engine warming through the applications such as clutches and other parts that reduce noise and improve engine performance. Mechanical power transmission is also beneficial in factories where industrial repairs are carried out, and equipment parts are manufactured and assembled, so in these environments, gearbox and bearing repairs give increased reliability and performance to run the production system. According to the International Organization of Motor Vehicle Manufacturers (OICA) data, worldwide motor vehicle production has increased from 77 711 725 units in 2020 to 80 145 988 in 2021 which has shown a rise of 3% in the production rate. As per the same source, the world’s truck production has increased from 4 147797 units in 2019 to 4364595 in 2020 which has shown a rise of 4% in production. With such an increase in production and sales in the automotive sector, the market for mechanical power transmission is expected to grow.
During the projection period, the worldwide market for mechanical power transmission will be driven by increasing aircraft production. The increasing demand for Pure-Power Geared Turbofan (GTF) engines, a growing fleet of aircraft, and technical developments in gearboxes are further factors driving the market for mechanical power transmission. As the demand for aircraft will increase the market for mechanical power transmission will also rise. According to the General Aviation Aircraft Shipment report 2022, the aircraft shipment has around 2,818 valued at around $22,865,799,694. For instance, according to World Bank data, by 2030, the demand for new aircraft is expected to be between 26,900 (Airbus) and 33,500 (Boeing), representing a market worth between US$3.3 trillion (Airbus) and US$4.06 trillion (Boeing). These factors including the strong aircraft demand globally make mechanical power transmission equipment essential which will propel the market growth.
Mechanical Power Transmission Market Geographical Outlook:
- During the forecast period, the North American region will see market growth
The mechanical power transmission market share is dominated by North America. The usage of mechanical power transmitters in industrial facilities, the processing of materials, and the automotive sector in heavy truck engines are all increasing in the North American region. According to International Organization of Motor Vehicle Manufacturers OICA data, truck production in the North American region has also increased from 479180 units in 2020 to 622401 in 2021 which has shown a rise of 30% in the production rate, under this in the Mexico region the production has increased from 133 965 units in 2020 to 162 836 units in 2021 which show a rise by 22% and the truck production in the USA including the buses has increased from 240 056 units in 2020 to 288 251 units in 2021 which shows a rise by 20 % in production. The market for mechanical power transmission devices is likely to increase over the next few years as a result of the need for trouble-free operation across a variety of end-use industries which will propel the market growth in the North American region.
Segmentation
- MECHANICAL POWER TRANSMISSION MARKET BY TYPE
- Shaft Coupling
- Gear Drive
- Chian Drive
- Brakes & Clutches
- Power Screws
- Others
- MECHANICAL POWER TRANSMISSION MARKET SALES CHANNEL
- OEM
- Aftermarket
- MECHANICAL POWER TRANSMISSION MARKET BY END-USER
- Automotive
- Aerospace & Defense
- Marine
- Power & Energy
- Manufacturing
- Others
- MECHANICAL POWER TRANSMISSION MARKET BY GEOGRAPHY
- North America
- By Type
- By Sales Channel
- By End-User
- By Country
- USA
- Canada
- Mexico
- South America
- By Type
- By Sales Channel
- By End-User
- By Country
- Brazil
- Argentina
- Others
- Europe
- By Type
- By Sales Channel
- By End-User
- By Country
- Germany
- France
- United Kingdom
- Spain
- Others
- Middle East and Africa
- By Type
- By Sales Channel
- By End-User
- By Country
- Saudi Arabia
- UAE
- Israel
- Others
- Asia Pacific
- By Type
- By Sales Channel
- By End-User
- By Country
- China
- India
- Japan
- South Korea
- Indonesia
- Taiwan
- Others
- North America