Report Overview
Oil Quality Sensor Market Size:
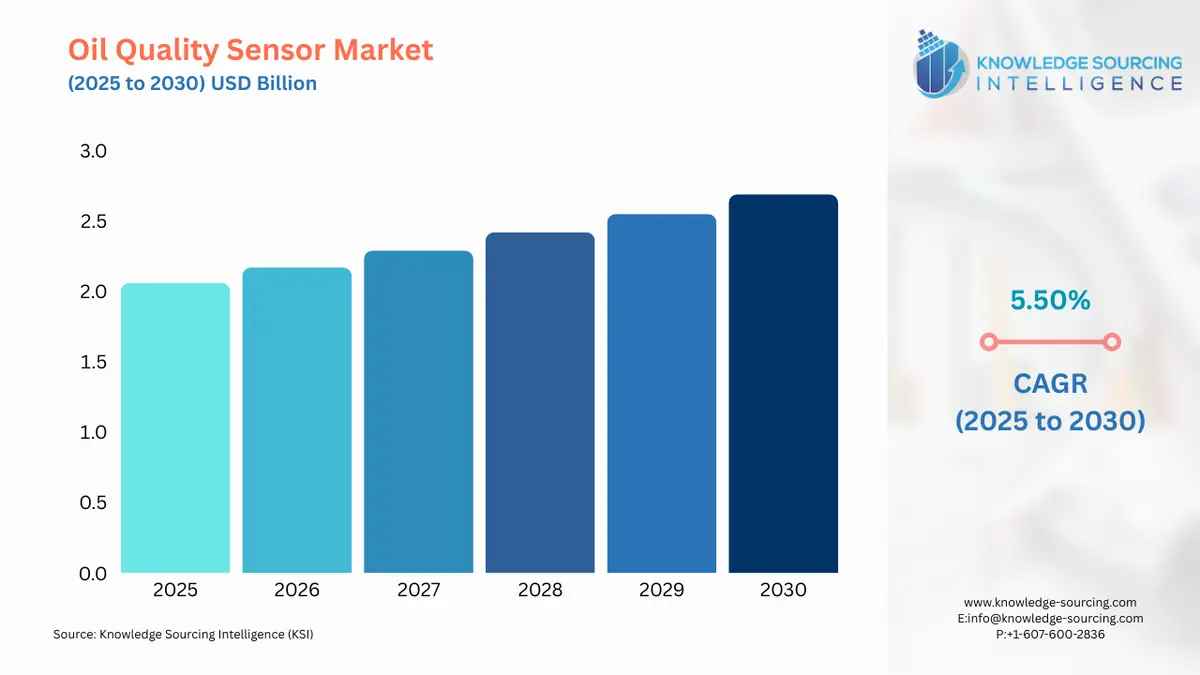
Oil Quality Sensor Market is forecasted to rise at a 5.50% CAGR, reaching USD 2.693 billion by 2030 from USD 2.060 billion in 2025.
Oil quality sensors assess the status of the oils by measuring fluid characteristics such as viscosity, density, optical (light scattering), and electrical properties. The brightness of the light is measured by the oil detection sensor. An inside LED illuminates a photoelectric cell. As oil comes into touch with the sensor probe, it deflects some light, causing the gadget to turn on. The market for oil quality sensors will grow due to increased demand in end-user industries such as automotive and manufacturing. According to the World bank, China's manufacturing production in 2021 increased by 26.04% over the previous year to $4,865.83B. China's manufacturing production in 2020 increased by 0.97% from 2019 to $3,860.68B. The technological advancements and increased use of contemporary equipment and heavy engines necessitate the use of oil quality sensors for smooth operation, which is boosting demand for high-performance quality sensors, which is likely to drive the Oil quality sensor market.
Oil Quality Sensor Market Growth Drivers:
- The increase in demand in the automotive industry will boost the oil quality sensor market.
Oil sensors and oil analysers are used in automotive and industrial machinery applications to monitor oil levels and check for impurities, particles, viscosity, and/or temperature. The most common oils used in all types of cars include engine oils, gear oils, lubrication oils, and turbine oils, all of which necessitate the use of an oil quality sensor to determine the various parameters and statistics of that particular oil so that the oil does not affect the motor vehicles in the automotive industry. The oil quality sensor market will expand as motor vehicle manufacturing increases. According to the OICA data, the world’s motor vehicles production has increased from 77 711 725 units in 2020 to 80 145 988 in 2021 which has shown a rise of 3% in the production rate. Furthermore, as per the same source, the world’s motor vehicles sales have increased from 78774320 units in 2020 to 82684 788 in 2021 which has shown a rise of 4% in production. Such a rise in production and sales in the automotive sector is expected increase the use of different oils which will boost the oil quality sensor market.
Petroleum products are created by refining crude oil and other liquids derived from fossil fuels. An engine oil is always formed from base oil, such as crude petroleum, or polymers and other additives with their own composition, which falls under the category of petroleum products. As the use of petroleum products will increase such as the engine oil and other oils then the requirement for oil quality sensors will also boost. According to Energy Information Administration (EIA), in 2021, U.S. petroleum consumption was roughly 8% more than it was in 2020, averaging around 19.78 million barrels per day (b/d). The transportation and automotive sectors accounted for about 67% of total consumption. Due to the increase in consumption of oil where oil quality sensor are applied will boost the market growth during the forecasted period.
Oil Quality Sensor Market Geographical Outlook:
- During the forecast period, North America region will see growth in the oil quality sensor market
The oil quality sensor market share will be dominated by the North American region. As a result of the widespread use of oil quality sensor in end-use application categories like automotive and manufacturing due to their desired qualities. According to OCIA data in 2021, the vehicle production output in USA stood at 9 167 214 representing a 4% increase from 8 821 026 units produced in 2020. As per the same source, the sales in the North American region have also increased from 14 881 356 units in 2020 to 15 408 565in 2021 which has shown a rise of 4% in the sales rate. The rising rate of vehicle manufacture and sales in North America region is driving up demand for oil quality sensors in the area, which is projected to boost market expansion during the forecast period.
List of Top Oil Quality Sensor Companies:
- Afton Chemical
- Akzo Nobel
- Evonik Industries
- Chevron Corporation
- LANXESS
Oil Quality Sensor Market Scope:
| Report Metric | Details |
|---|---|
| Study Period | 2021 to 2031 |
| Historical Data | 2021 to 2024 |
| Base Year | 2025 |
| Forecast Period | 2026 – 2031 |
| Report Metric | Details |
| Oil Quality Sensor Market Size in 2025 | USD 2.060 billion |
| Oil Quality Sensor Market Size in 2030 | USD 2.693 billion |
| Growth Rate | CAGR of 5.50% |
| Study Period | 2020 to 2030 |
| Historical Data | 2020 to 2023 |
| Base Year | 2024 |
| Forecast Period | 2025 – 2030 |
| Forecast Unit (Value) | USD Billion |
| Segmentation |
|
| Geographical Segmentation | North America, South America, Europe, Middle East and Africa, Asia Pacific |
| List of Major Companies in the Oil Quality Sensor Market |
|
| Customization Scope | Free report customization with purchase |
Segmentation
- OIL QUALITY SENSOR MARKET BY OIL TYPE
- Mineral Oil
- Synthetic Oil
- Others
- OIL QUALITY SENSOR MARKET BY INSTALLATION
- OEM
- Aftermarket
- OIL QUALITY SENSOR MARKET BY END-USER
- Automotive
- Aerosapce & Defense
- Marine
- Power & Energy
- Others
- OIL QUALITY SENSOR MARKET BY GEOGRAPHY
- North America
- USA
- Canada
- Mexico
- South America
- Brazil
- Argentina
- Others
- Europe
- Germany
- France
- United Kingdom
- Spain
- Others
- Middle East and Africa
- Saudi Arabia
- UAE
- Israel
- Others
- Asia Pacific
- China
- India
- Japan
- South Korea
- Indonesia
- Taiwan
- Others
- North America
Market Segmentation
By Oil Type
By Installation
By End-user
By Geography
Table of Contents
1. EXECUTIVE SUMMARY
2. MARKET SNAPSHOT
2.1. Market Overview
2.2. Market Definition
2.3. Scope of the Study
2.4. Market Segmentation
3. BUSINESS LANDSCAPE
3.1. Market Drivers
3.2. Market Restraints
3.3. Market Opportunities
3.4. Porter’s Five Forces Analysis
3.5. Industry Value Chain Analysis
3.6. Policies and Regulations
3.7. Strategic Recommendations
4. TECHNOLOGICAL OUTLOOK
5. OIL QUALITY SENSOR MARKET BY OIL TYPE
5.1. Introduction
5.2. Mineral Oil
5.3. Synthetic Oil
5.4. Others
6. OIL QUALITY SENSOR MARKET BY INSTALLATION
6.1. Introduction
6.2. OEM
6.3. Aftermarket
7. OIL QUALITY SENSOR MARKET BY END-USER
7.1. Introduction
7.2. Automotive
7.3. Aerosapce & Defense
7.4. Marine
7.5. Power & Energy
7.6. Others
8. OIL QUALITY SENSOR MARKET BY GEOGRAPHY
8.1. Introduction
8.2. North America
8.2.1. USA
8.2.2. Canada
8.2.3. Mexico
8.3. South America
8.3.1. Brazil
8.3.2. Argentina
8.3.3. Others
8.4. Europe
8.4.1. Germany
8.4.2. France
8.4.3. United Kingdom
8.4.4. Spain
8.4.5. Others
8.5. Middle East and Africa
8.5.1. Saudi Arabia
8.5.2. UAE
8.5.3. Israel
8.5.4. Others
8.6. Asia Pacific
8.6.1. China
8.6.2. India
8.6.3. Japan
8.6.4. South Korea
8.6.5. Indonesia
8.6.6. Taiwan
8.6.7. Others
9. COMPETITIVE ENVIRONMENT AND ANALYSIS
9.1. Major Players and Strategy Analysis
9.2. Market Share Analysis
9.3. Mergers, Acquisitions, Agreements, and Collaborations
9.4. Competitive Dashboard
10. COMPANY PROFILES
10.1. Des-Case
10.2. TE Connectivity
10.3. Mel Systems Srl
10.4. Poseidon Systems, LLC
10.5. ifm electronic GmbH
10.6. HYDAC International GmbH.
10.7. Tan Delta Systems
10.8. Yatek
10.9. INZOC Technology (Shenzhen) Co., LTD
10.10. Bühler Technologies GmbH
11. APPENDIX
11.1. Currency
11.2. Assumptions
11.3. Base and Forecast Years Timeline
11.4. Key benefits for the stakeholders
11.5. Research Methodology
11.6. Abbreviations
LIST OF FIGURES
LIST OF TABLES
Navigate
Trusted by the world's leading organizations


