Report Overview
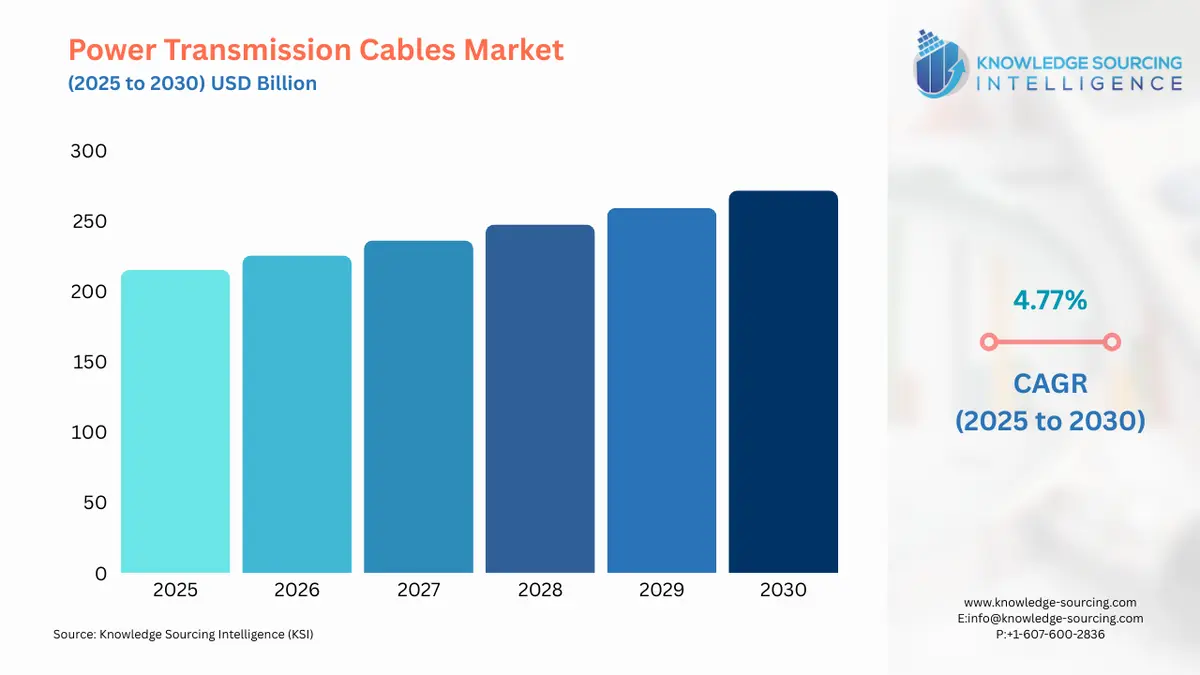
Power Transmission Cables Market Size:
Power Transmission Cables Market, sustaining a 4.77% CAGR, is anticipated to reach USD 271.565 billion by 2030 from USD 215.155 billion in 2025.
Power transmission cables transmit electricity from one location to another and are designed to carry high-voltage and high-current electricity over long distances with minimal losses.
Power transmission cables are used in various applications, including power grids, power plants, and distribution networks, and come in various types and voltages, with different materials used for their construction and insulation depending on the application and environmental conditions. The increasing demand for electricity, infrastructure development, renewable energy integration, and technological advancements are driving the power transmission cables market growth.
Power Transmission Cables Market Growth Drivers:
- The growing electricity demand will boost the power transmission cable market growth.
Power transmission cables are a critical component of the modern electrical infrastructure, enabling the efficient and reliable delivery of electricity to homes, businesses, and industries. The growth of the global population and urbanization, rising incomes, increasing use of electric vehicles and home appliances, and the need for power supply for industrial and commercial activities increase the electricity demand. The electricity needs to be transported over long distances from the power plants to the destination, which requires the construction of new transmission lines and grid infrastructure, and power transmission cables play a critical role in this infrastructure.
The increasing electricity demand is expected to drive the growth of the power transmission cables market, particularly in emerging economies where infrastructure development is a key priority. According to the International Energy Agency's (IEA) "Global Energy Review 2021", electricity demand is expected to grow by 4.5% in 2021, driven by economic recovery and increased demand from emerging economies. According to the International Renewable Energy Agency (IRENA), global renewable energy capacity reached 2,799 GW in 2020, an increase of 10.3% compared to the previous year, and renewable energy will account for 57% of global electricity generation by 2050. According to the International Energy Agency (IEA), the sales of electric vehicles increased to 4.7 million in 2021 from 2 million in 2020. This demonstrates that the power transmission cables market has a great demand.
Power Transmission Cables Market Geographical Outlook:
- The Asia Pacific region is expected to dominate the global market.
The increasing electricity demand, the rapid growth of renewable energy, investment in grid modernization, and the expansion of transmission and distribution infrastructure in countries such as China, Japan, and India will drive demand for power transmission cables in the Asia Pacific region. In 2021, China's State Grid Corporation announced plans to invest around $8.5 billion in building new ultra-high voltage power transmission lines over the next five years, which will help to improve grid reliability and increase the integration of renewable energy. In 2021, the Indian government launched the "Green Energy Corridors" project, which aims to develop a new transmission infrastructure to support the integration of renewable energy into the grid, and the government plans to build around 20,000 circuit kilometres of new transmission lines and 36 new substations. In 2020, the Ministry of Economy, Trade and Industry (METI) of Japan announced new regulations for the construction and operation of offshore wind power facilities, which will require the development of new power transmission cables to connect these facilities to the grid. These factors all add to the Asia Pacific region's power transmission cables market growth.
Market Segmentation:
- POWER TRANSMISSION CABLES MARKET BY INSTALLATION
- Uderground
- Overhead
- POWER TRANSMISSION CABLES MARKET BY VOLTAGE
- Low Tension
- High Tension
- Super Tension
- Others
- POWER TRANSMISSION CABLES MARKET BY MATERIAL
- Aluminum
- Copper
- POWER TRANSMISSION CABLES MARKET BY AREA
- Urban
- Rural
- POWER TRANSMISSION CABLES MARKET BY END-USER
- Residential
- Commercial
- Industrial
- POWER TRANSMISSION CABLES MARKET BY GEOGRAPHY
- North America
- By Installation
- By Voltage
- By Material
- By Area
- By End-User
- By Country
- USA
- Canada
- Mexico
- South America
- By Installation
- By Voltage
- By Material
- By Area
- By End-User
- By Country
- Brazil
- Argentina
- Others
- Europe
- By Installation
- By Voltage
- By Material
- By Area
- By End-User
- By Country
- Germany
- France
- United Kingdom
- Spain
- Others
- Middle East and Africa
- By Installation
- By Voltage
- By Material
- By Area
- By End-User
- By Country
- Saudi Arabia
- UAE
- Israel
- Others
- Asia Pacific
- By Installation
- By Voltage
- By Material
- By Area
- By End-User
- By Country
- China
- India
- Japan
- South Korea
- Indonesia
- Thailand
- Taiwan
- Others
- North America
Market Segmentation
By Installation
By Voltage
By Material
By Area
By End-user
By Geography
Table of Contents
1. EXECUTIVE SUMMARY
2. MARKET SNAPSHOT
2.1. Market Overview
2.2. Market Definition
2.3. Scope of the Study
2.4. Market Segmentation
3. BUSINESS LANDSCAPE
3.1. Market Drivers
3.2. Market Restraints
3.3. Market Opportunities
3.4. Porter’s Five Forces Analysis
3.5. Industry Value Chain Analysis
3.6. Policies and Regulations
3.7. Strategic Recommendations
4. TECHNOLOGICAL OUTLOOK
5. POWER TRANSMISSION CABLES MARKET BY INSTALLATION
5.1. Introduction
5.2. Uderground
5.3. Overhead
6. POWER TRANSMISSION CABLES MARKET BY VOLTAGE
6.1. Introduction
6.2. Low Tension
6.3. High Tension
6.4. Super Tension
6.5. Others
7. POWER TRANSMISSION CABLES MARKET BY MATERIAL
7.1. Introduction
7.2. Aluminum
7.3. Copper
8. POWER TRANSMISSION CABLES MARKET BY AREA
8.1. Introduction
8.2. Urban
8.3. Rural
9. POWER TRANSMISSION CABLES MARKET BY END-USER
9.1. Introduction
9.2. Residential
9.3. Commercial
9.4. Industrial
10. POWER TRANSMISSION CABLES MARKET BY GEOGRAPHY
10.1. Introduction
10.2. North America
10.2.1. By Installation
10.2.2. By Voltage
10.2.3. By Material
10.2.4. By Area
10.2.5. By End-User
10.2.6. By Country
10.2.6.1. USA
10.2.6.2. Canada
10.2.6.3. Mexico
10.3. South America
10.3.1. By Installation
10.3.2. By Voltage
10.3.3. By Material
10.3.4. By Area
10.3.5. By End-User
10.3.6. By Country
10.3.6.1. Brazil
10.3.6.2. Argentina
10.3.6.3. Others
10.4. Europe
10.4.1. By Installation
10.4.2. By Voltage
10.4.3. By Material
10.4.4. By Area
10.4.5. By End-User
10.4.6. By Country
10.4.6.1. Germany
10.4.6.2. France
10.4.6.3. United Kingdom
10.4.6.4. Spain
10.4.6.5. Others
10.5. Middle East and Africa
10.5.1. By Installation
10.5.2. By Voltage
10.5.3. By Material
10.5.4. By Area
10.5.5. By End-User
10.5.6. By Country
10.5.6.1. Saudi Arabia
10.5.6.2. UAE
10.5.6.3. Israel
10.5.6.4. Others
10.6. Asia Pacific
10.6.1. By Installation
10.6.2. By Voltage
10.6.3. By Material
10.6.4. By Area
10.6.5. By End-User
10.6.6. By Country
10.6.6.1. China
10.6.6.2. India
10.6.6.3. Japan
10.6.6.4. South Korea
10.6.6.5. Indonesia
10.6.6.6. Thailand
10.6.6.7. Taiwan
10.6.6.8. Others
11. COMPETITIVE ENVIRONMENT AND ANALYSIS
11.1. Major Players and Strategy Analysis
11.2. Market Share Analysis
11.3. Mergers, Acquisitions, Agreements, and Collaborations
11.4. Competitive Dashboard
12. COMPANY PROFILES
12.1. 3M
12.2. Eland Cables
12.3. Furukawa Electric Co., Ltd.
12.4. Jiangnan Cables
12.5. Prysmian Group
12.6. Southwire Company, LLC.
12.7. Sterlite Power
12.8. Synergy Cables
12.9. LS Cable & System Ltd
12.10. NKT A/S
13. APPENDIX
13.1. Currency
13.2. Assumptions
13.3. Base and Forecast Years Timeline
13.4. Key benefits for the stakeholders
13.5. Research Methodology
13.6. Abbreviations
LIST OF FIGURES
LIST OF TABLE
Navigate
Trusted by the world's leading organizations


