
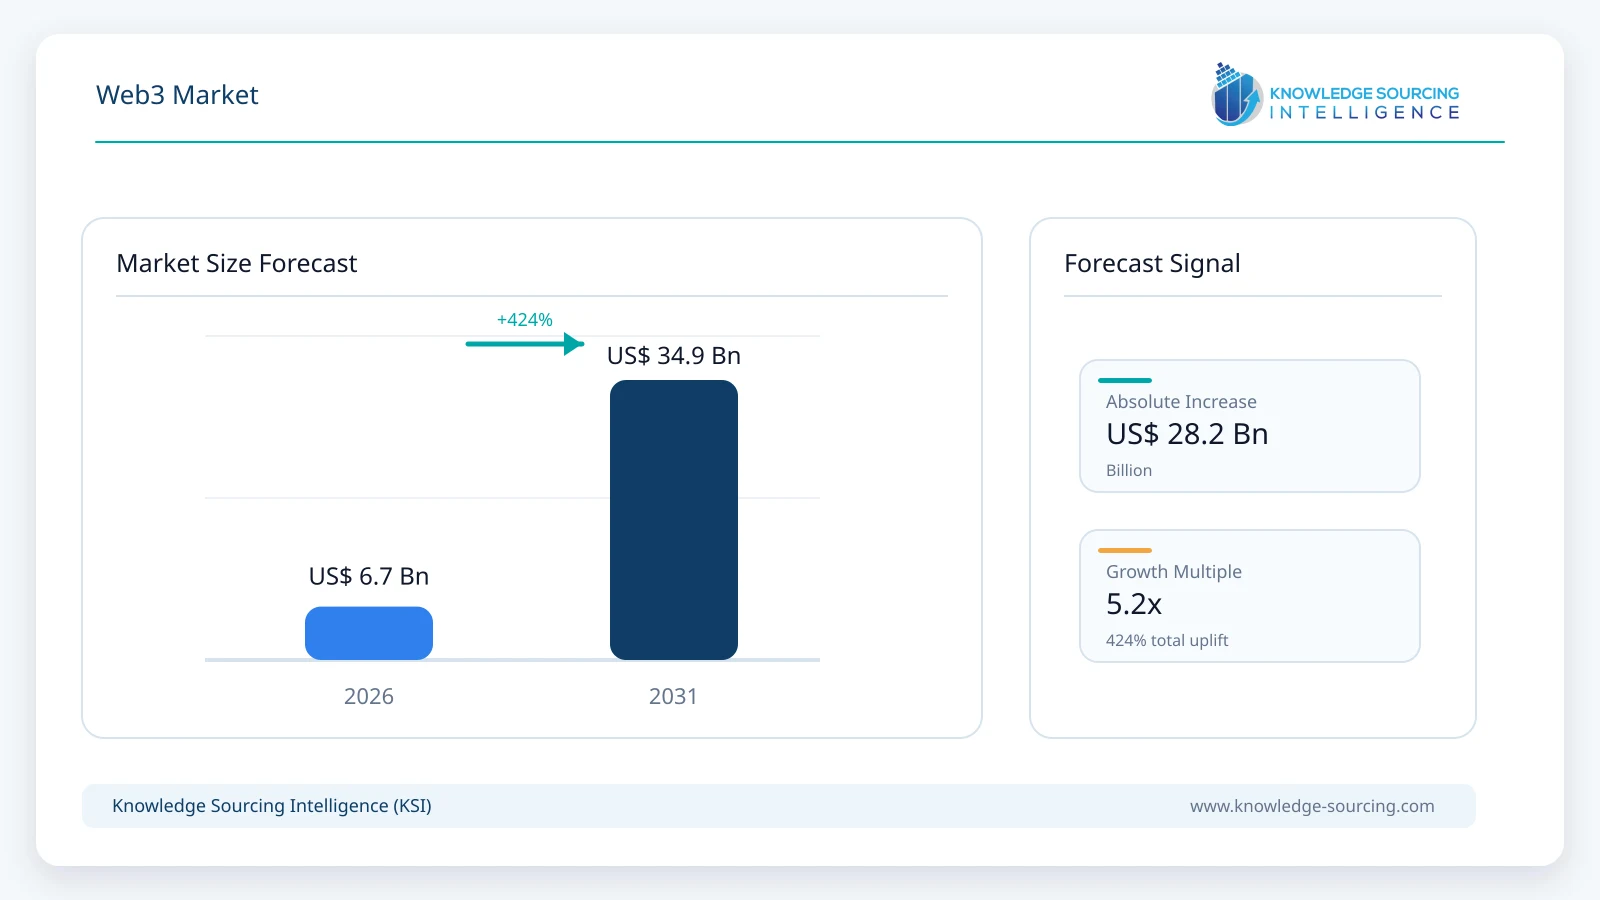
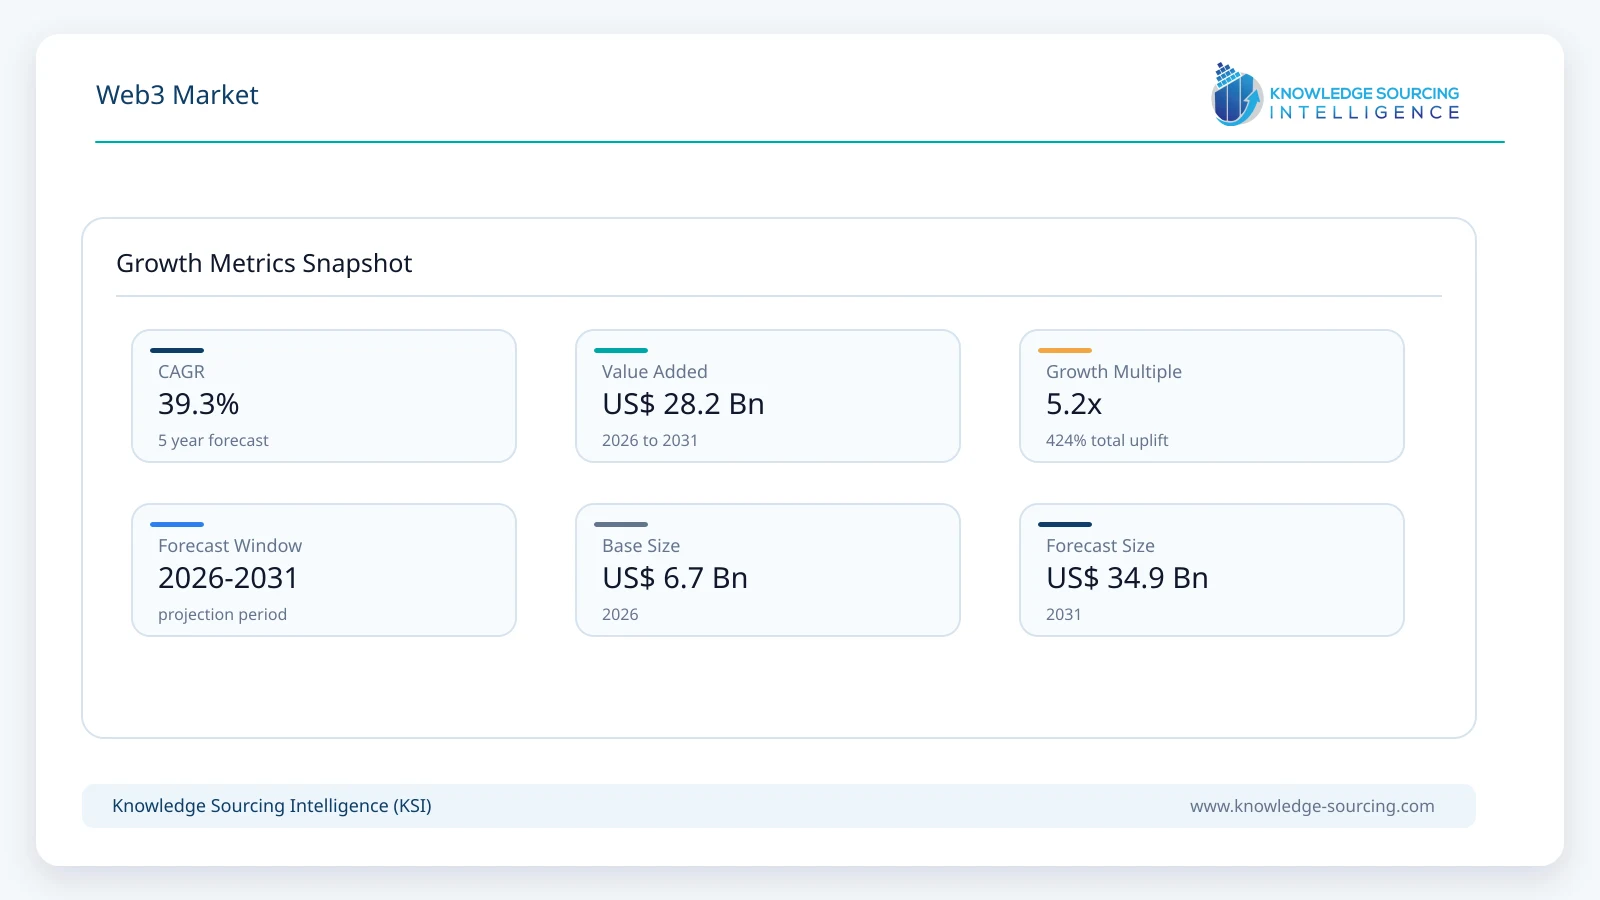
The Web3 Market is projected to grow from USD 6.65 billion in 2026 to USD 34.86 billion by 2031, registering a 39.31% CAGR during the forecast period.
Highlights:
- 1Infrastructure and developer platforms account for approximately 38% of Web3 market value in 2026, equivalent to roughly USD 2.53 billion.
- 2DeFi and programmable payments represent approximately 36% of market value in 2026, equivalent to about USD 2.39 billion.
- 3BFSI accounts for approximately 34% of Web3 market value in 2026, equivalent to around USD 2.26 billion.
- 4North America represents approximately 39% of global Web3 market value in 2026, equivalent to about USD 2.59 billion.
- 5Tokenization and real-world-asset infrastructure is projected to grow at approximately 47.6% annually through 2031, materially faster than the overall market.
Report Overview
The market covers commercial software, infrastructure and services used to build and operate blockchain-based applications, including blockchain infrastructure, developer platforms, digital wallets, identity systems, interoperability technologies, decentralized data and storage, decentralized-finance platforms, programmable payments and tokenization infrastructure. Cryptocurrency market capitalization, crypto-asset appreciation, stablecoin reserve value and gross trading volume are excluded from the revenue estimate to avoid treating asset values as technology-market revenue.
The market is becoming commercially more concentrated around applications with demonstrable transaction activity and institutional use. Circle reported USDC circulation of USD 73.3 billion at the end of the second quarter of 2026 and USD 14.8 trillion in quarterly on-chain transaction volume, an increase of 151% year over year. At the same time, Securitize reported USD 4.3 billion of tokenized assets under management at the end of June 2026 and USD 5.3 billion of aggregate quarterly transaction volume. These indicators support rapid expansion in payment, settlement, and tokenization infrastructure even as the broader developer ecosystem becomes more mature rather than simply adding large numbers of new projects.
Web3 is evolving from a relatively fragmented crypto-native ecosystem toward an infrastructure layer that increasingly connects public and permissioned blockchain networks with conventional payments, financial markets, and enterprise applications. Ethereum remains an important foundation for this evolution. The Pectra upgrade in May 2025 increased blob capacity and introduced functionality enabling conventional externally owned accounts to temporarily use smart-contract capabilities, while Fusaka went live in December 2025 with PeerDAS and substantially greater Layer 2 data capacity. Ethereum’s roadmap now targets further execution and scalability improvements through subsequent upgrades, allowing more applications to operate at lower unit transaction costs.
The developer ecosystem is simultaneously becoming more professional and multi-chain. Electric Capital’s 2024 analysis covered 902 million code commits across 1.7 million repositories and found that total crypto developers declined 7%, while established developers with more than two years of experience increased 27% and generated 70% of all code commits. One in three developers worked across multiple blockchain ecosystems. This development supports demand for outsourced APIs, nodes, indexing, interoperability, wallet infrastructure, and data platforms because application developers increasingly need to operate across several networks without maintaining each underlying system independently.
Market Trends
Stablecoins Are Becoming Core Web3 Payment Infrastructure
Stablecoins increasingly function as programmable settlement instruments rather than only as trading pairs for digital-asset exchanges. Circle reported USD 73.3 billion of USDC in circulation at the end of Q2 2026 and USD 14.8 trillion of on-chain transaction volume during the quarter, with transaction activity growing 151% year over year. Circle also reported more than 100 ecosystem and institutional builders participating around its Arc infrastructure. This expansion increases demand throughout the Web3 technology stack, including wallets, payment orchestration, compliance systems, blockchain APIs, custody, liquidity routing and smart-contract infrastructure. Payment-related Web3 revenue therefore increasingly comes from services surrounding stablecoin movement rather than from the value of the stablecoins themselves, making the segment more closely comparable with conventional financial-technology infrastructure.
Tokenized Assets Are Moving Into Institutional Financial Markets
Tokenization is progressing from experimentation toward regulated financial-market infrastructure. Securitize reported average tokenized assets under management of USD 4.3 billion in Q2 2026, up 16%, with aggregate transaction volume reaching USD 5.3 billion, an increase of 147%. The company also expanded relationships with transfer agents and market infrastructure providers while supporting tokenized funds from major asset managers. Consensys similarly stated in September 2026 that institutional adoption had moved from pilot programmes toward production deployments across tokenization, stablecoins and digital-asset infrastructure. This shift creates commercial opportunities in token issuance, transfer agency, custody, smart-contract administration, investor identity, compliance, liquidity and collateral management rather than simply increasing token issuance volumes.
Consumer and Institutional Web3 Platforms Are Separating
The market is becoming increasingly segmented between consumer-facing digital-finance platforms and institutional blockchain infrastructure. Consensys announced in September 2026 that MetaMask and its institutional protocol business would operate as separate companies, reflecting different operating models and customer requirements. MetaMask had surpassed 100 million downloads across approximately 190 countries, while the institutional business was increasingly serving banks, asset managers and financial-market operators. The separation reflects a broader structural trend: consumer Web3 products emphasize wallets, trading, payments and self-custody, while institutional platforms require permissioning, regulatory compliance, privacy, interoperability, resilient infrastructure and integration with traditional financial systems. This specialization is likely to increase as Web3 suppliers develop more focused revenue models around clearly defined customer groups.
Market Drivers
Rapid Expansion of Stablecoin Payments and Programmable Money
Stablecoin transaction growth provides one of the clearest demand signals for Web3 infrastructure because every increase in transaction activity creates requirements for wallets, settlement APIs, compliance, custody, and cross-chain connectivity. USDC generated USD 14.8 trillion of on-chain transaction volume in Q2 2026, up 151% year over year, while circulation reached USD 73.3 billion. These volumes illustrate that blockchain networks are increasingly being used as payment and settlement infrastructure rather than exclusively for speculative asset trading. The commercial effect extends across developers, payment gateways, financial institutions, and enterprise software companies because stablecoin integration requires orchestration, treasury systems, identity verification, transaction monitoring, and blockchain connectivity. This makes programmable money a deeper revenue pool for the Web3 market than asset issuance alone.
Institutional Tokenization Is Creating New Infrastructure Demand
Tokenized financial assets are generating demand across multiple parts of the Web3 technology stack. Securitize ended Q2 2026 with USD 4.3 billion in tokenized AUM and reported approximately USD 5 billion in assets managed on-chain shortly after the quarter. Its relationships now span major asset managers and regulated transfer, brokerage and fund-administration functions. Institutional adoption increases revenue opportunities for smart-contract platforms, custody technology, digital transfer agents, compliant wallet systems, blockchain data services and interoperability providers. The segment is particularly important because tokenized securities require substantially more regulatory and operational infrastructure than conventional consumer tokens, increasing the amount of technology and professional services required per deployment.
Blockchain Scaling Is Lowering Application Costs
Blockchain scalability improvements are reducing one of the largest practical barriers to broader Web3 use. Ethereum’s Pectra upgrade doubled the target number of blobs per block, while Fusaka subsequently introduced PeerDAS, allowing nodes to store only portions of blob data and theoretically enabling an eight-fold increase in data availability capacity. These improvements primarily benefit Layer 2 networks, where applications can execute transactions more economically while relying on Ethereum for settlement and security. Lower transaction costs expand the range of commercially viable payment, gaming, social, tokenization, and machine-to-machine applications, which in turn increases demand for developer infrastructure, middleware, wallets, and data services.
Market Restraints
Developer Growth Is Becoming Concentrated Rather Than Broad-Based
Web3 remains a highly active development ecosystem, but growth is becoming concentrated among experienced teams rather than being driven by continually expanding numbers of new developers. Electric Capital found that overall crypto developer numbers declined 7% in 2024, while established developers increased 27% and accounted for 70% of code contributions. One-third of developers were already working across multiple blockchain ecosystems. This is positive for technical maturity but can reduce the number of independent projects purchasing standalone developer tools and infrastructure. Growth in Web3 revenue therefore increasingly depends on deeper monetization of established platforms and enterprise deployments rather than assuming that the developer population itself will compound at rates comparable to the overall market.
Fragmentation and Security Increase Integration Costs
Web3 applications continue to operate across numerous Layer 1 networks, Layer 2 systems, wallets, smart-contract frameworks, and interoperability protocols, increasing integration complexity. Ethereum’s roadmap itself continues to prioritize interoperability, scalability, and improved user experience because these remain unresolved industry-level challenges. Multi-chain applications must manage different execution environments, liquidity pools, token standards, security assumptions, and wallet architectures. Institutional applications add further requirements around custody, auditability, transaction controls, and regulatory compliance. The resulting development and security expense can lengthen deployment cycles and favor larger infrastructure providers capable of supporting several networks through a unified interface.
Web3 Market Segment Analysis
By Offering
Infrastructure and Developer Platforms
Infrastructure and developer platforms represent the largest offering category, accounting for approximately 38% of the Web3 market in 2026, equivalent to about USD 2.53 billion. The segment is projected to reach approximately USD 11.85 billion by 2031, representing growth of around 36.2% annually. Its share moderates over the forecast period as application platforms grow faster, but infrastructure remains the largest individual offering because every wallet, decentralized application and institutional blockchain deployment requires access to nodes, APIs, indexing, network data and smart-contract development tools. Multi-chain development reinforces this requirement, with one-third of developers already working across more than one blockchain. Commercial providers increasingly differentiate through reliability, network coverage, developer tooling and managed services rather than basic node access alone, allowing infrastructure to remain a substantial revenue pool even as blockchain operating costs decline.
By Application
DeFi and Programmable Payments
DeFi and programmable payments account for approximately 36% of Web3 market value in 2026, equivalent to roughly USD 2.39 billion, and are projected to reach approximately USD 12.90 billion by 2031 at a CAGR of about 40.1%. The segment remains the largest application because stablecoins, decentralized trading, lending and blockchain-based settlement create high transaction volumes and recurring infrastructure requirements. USDC alone processed USD 14.8 trillion in on-chain transaction value during Q2 2026, demonstrating the scale of activity that payment and financial applications can generate. Tokenization grows faster at approximately 47.6% annually and reaches about USD 8.37 billion by 2031, but it begins from a smaller base. The market is therefore shifting toward a combination of programmable payments and tokenized conventional financial assets rather than relying exclusively on crypto-native DeFi protocols.
By Industry Vertical
BFSI
BFSI accounts for approximately 34% of Web3 market value in 2026, equivalent to about USD 2.26 billion, and is projected to reach approximately USD 12.90 billion by 2031 at a CAGR of around 41.7%. Banks, payment companies, exchanges, asset managers and financial-market infrastructure providers are adopting blockchain technology for stablecoin settlement, tokenized funds, collateral mobility and programmable financial transactions. Securitize’s USD 4.3 billion in tokenized assets under management and Circle’s USD 14.8 trillion of quarterly USDC transaction activity illustrate the expansion occurring across both tokenization and payments. Healthcare and pharmaceuticals grow faster from a much smaller base, but BFSI remains the largest industry vertical through 2031 because financial services provide the most direct commercial use cases for blockchain-based ownership, settlement and transfer.
Regional Outlook
North America
North America accounts for approximately 39% of global Web3 market value in 2026, equivalent to about USD 2.59 billion, and is projected to reach approximately USD 12.72 billion by 2031 at a CAGR of around 37.5%. The region remains the largest market because it combines major Web3 infrastructure companies with a dense ecosystem of asset managers, exchanges, payment networks and institutional investors. Circle, Coinbase, Consensys, Alchemy, Chainlink Labs, Fireblocks and Securitize all maintain substantial operations within the North American ecosystem, while institutional tokenization and stablecoin infrastructure are increasingly integrated into conventional financial services. Securitize’s expansion across transfer agency, brokerage, and fund servicing and Circle’s institutional Arc ecosystem illustrate the region’s movement toward regulated production deployments rather than pilot projects alone.
Asia Pacific
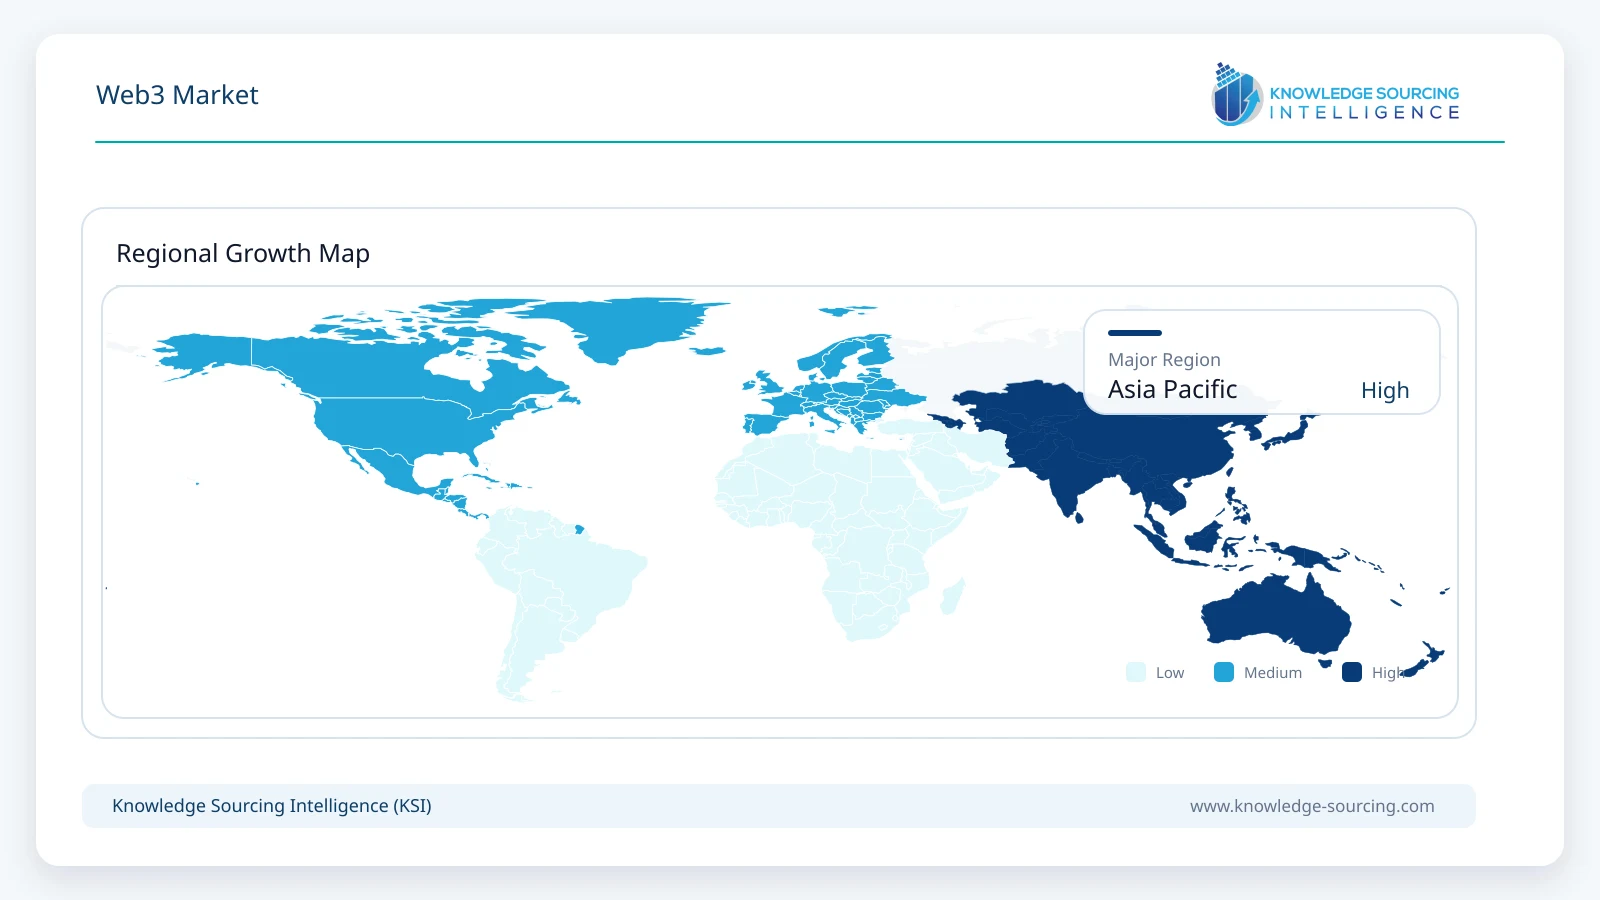
Asia Pacific is projected to record the fastest regional expansion at approximately 43.5% annually, increasing from roughly USD 2.06 billion in 2026 to USD 12.55 billion in 2031. The region benefits from large developer communities, substantial crypto-user populations, cross-border payment demand, and active blockchain ecosystems across India, Singapore, Japan, South Korea, and other markets. Electric Capital found that Asia had become the largest continent by crypto developer share, while India added more new crypto developers than any other country in 2024. The region’s contribution increases from approximately 31% of global market value in 2026 to around 36% by 2031, bringing it close to North America by the end of the forecast period as payments, developer infrastructure, and enterprise blockchain adoption expand.
Competitive Environment and Analysis
Competition varies significantly across the Web3 technology stack. Consensys and Alchemy maintain strong positions in blockchain infrastructure and Ethereum-related development, while Coinbase Developer Platform, QuickNode and Blockdaemon compete across node, wallet and developer services. Chainlink Labs provides oracle and interoperability infrastructure, Circle and Ripple focus heavily on payments and financial infrastructure, Fireblocks specializes in institutional custody and transaction technology, and Securitize operates regulated tokenization infrastructure. Polygon Labs, Solana Labs, Ava Labs and Offchain Labs develop underlying networks and scaling platforms, while Uniswap Labs operates decentralized-trading infrastructure.
The distinction between consumer and institutional suppliers is becoming clearer. Consensys’ 2026 decision to separate MetaMask from its institutional protocol business illustrates how different these markets have become. MetaMask has accumulated more than 100 million downloads across approximately 190 countries, while institutional customers increasingly require dedicated solutions for tokenization, stablecoins, identity, compliance and market infrastructure.
Market Share Analysis
No company controls the overall Web3 market because revenue is distributed across network infrastructure, developer platforms, payments, wallets, interoperability, custody, tokenization and decentralized applications. Competitive position is therefore stronger within individual technology layers than across the market as a whole. Alchemy and Consensys maintain significant positions in development and Ethereum infrastructure, Circle has established considerable scale in stablecoin-related services, Chainlink is widely used for blockchain data and interoperability, and Securitize has emerged as a significant regulated tokenization provider with USD 4.3 billion of tokenized AUM at the end of Q2 2026.
Network effects increasingly influence market share. Wallet platforms become more valuable as user and application integrations increase, while infrastructure providers benefit from broader blockchain coverage and higher developer traffic. Institutional suppliers gain further advantages from regulatory licences, custody integrations and established relationships with financial institutions. These factors are likely to increase concentration within individual Web3 infrastructure categories even while the overall market remains fragmented.
Recent Developments
September 2026: Consensys announced the separation of MetaMask from its protocol and institutional blockchain infrastructure operations, reflecting increasingly distinct consumer and institutional Web3 markets.
August 2026: Circle reported Q2 USDC transaction volume of USD 14.8 trillion, up 151% year over year, with USD 73.3 billion in USDC circulation.
August 2026: Securitize reported USD 4.3 billion in tokenized assets under management and USD 5.3 billion of quarterly aggregate transaction volume.
June 2026: Ethereum’s PeerDAS documentation highlighted the roughly order-of-magnitude increase in data-availability capacity available to Layer 2 networks following Fusaka.
February 2026: The Ethereum Foundation outlined its post-Pectra and post-Fusaka development priorities, including further scaling, interoperability and execution improvements.
December 2025: Ethereum activated the Fusaka upgrade, introducing PeerDAS and additional mechanisms to increase blob throughput for Layer 2 networks.
Market Outlook
The global Web3 market is forecast to expand from USD 4.77 billion in 2025 to USD 34.86 billion by 2031 at a CAGR of 39.31%, with market value reaching approximately USD 6.65 billion in 2026. The forecast implies rapid commercial expansion but does not require all Web3 segments to grow at the same rate. Infrastructure and developer platforms remain the largest offering but grow below the market average as application-level spending accelerates, while tokenization records the strongest application-level growth. DeFi and programmable payments retain the largest application position because stablecoin and financial transaction volumes are already substantial and continue generating demand for payment, compliance, custody and blockchain infrastructure.
BFSI remains the largest industry vertical through 2031 as conventional financial institutions increasingly adopt tokenized assets and programmable settlement. North America retains the largest regional market, but Asia Pacific grows considerably faster and approaches a comparable market value by the end of the forecast period. The market’s most important structural change is therefore not simply continued growth in cryptocurrency activity, but the integration of blockchain technology into conventional financial, payment and enterprise infrastructure.
Web3 Market Scope:
| Report Metric | Details |
|---|---|
| Total Market Size in 2026 | USD 6.65 billion |
| Total Market Size in 2031 | USD 34.86 billion |
| Forecast Unit | Billion |
| Growth Rate | 39.31% |
| Study Period | 2021 to 2031 |
| Historical Data | 2021 to 2024 |
| Base Year | 2025 |
| Forecast Period | 2026 – 2031 |
| Segmentation | Offering, Application, Industry Vertical, Geography |
| Companies |
|
| Customization Scope | 15% Free Customization included with purchase — Request Custom Breakdown → |
| Sample & Data Access | PDF Sample, Excel Databook & Analyst Briefing — Download Free Sample → |
Market Segmentation
BY OFFERING
Infrastructure and Developer Platforms
Wallet and Identity Solutions
Decentralized Data and Storage Services
Application Platforms and Middleware
Professional Services
BY APPLICATION
DeFi and Programmable Payments
Tokenization and Real-World Assets
Gaming, Media and Creator Economy
Decentralized Identity and Credentials
Data, Storage and Compute
Others
BY INDUSTRY VERTICAL
BFSI
IT and Telecom
Media and Entertainment
E-commerce and Retail
Healthcare and Pharmaceuticals
Others
BY GEOGRAPHY
North America
USA
Canada
Mexico
South America
Brazil
Argentina
Others
Europe
United Kingdom
Germany
France
Switzerland
Others
Middle East and Africa
UAE
Saudi Arabia
South Africa
Others
Asia Pacific
Singapore
Japan
South Korea
India
China
Others
Table of Contents
1. INTRODUCTION
1.1. Market Overview
1.2. Market Definition
1.3. Scope of the Study
1.4. Market Segmentation
1.5. Currency
1.6. Assumptions
1.7. Base and Forecast Years
1.8. Key Benefits to Stakeholders
2. RESEARCH METHODOLOGY
2.1. Research Design
2.2. Secondary Research
2.3. Market Estimation
2.4. Segment Modelling
2.5. Data Triangulation and Validation
3. EXECUTIVE SUMMARY
3.1. Key Findings
3.2. Web3 Market Size, 2025-2031
3.3. Offering Outlook
3.4. Application Outlook
3.5. Industry Vertical Outlook
3.6. Regional Opportunity Summary
4. MARKET DYNAMICS
4.1. Market Drivers
4.1.1. Rapid Expansion of Stablecoin Payments and Programmable Money
4.1.2. Institutional Tokenization Creating New Infrastructure Demand
4.1.3. Blockchain Scaling Reducing Application Costs
4.2. Market Restraints
4.2.1. Developer Growth Becoming More Concentrated
4.2.2. Fragmentation and Security Increasing Integration Costs
4.3. Porter’s Five Forces Analysis
4.4. Industry Value Chain Analysis
4.5. Regulatory and Compliance Environment
4.6. Web3 Security and Interoperability
5. TECHNOLOGICAL OUTLOOK
5.1. Layer 1 Blockchain Networks
5.2. Layer 2 Scaling
5.3. Smart Accounts and Account Abstraction
5.4. Cross-Chain Interoperability
5.5. Decentralized Data and Storage
5.6. Privacy Technologies
5.7. AI Agents and Programmable Payments
6. WEB3 MARKET BY OFFERING
6.1. Introduction
6.2. Infrastructure and Developer Platforms
6.3. Wallet and Identity Solutions
6.4. Decentralized Data and Storage Services
6.5. Application Platforms and Middleware
6.6. Professional Services
7. WEB3 MARKET BY APPLICATION
7.1. Introduction
7.2. DeFi and Programmable Payments
7.3. Tokenization and Real-World Assets
7.4. Gaming, Media and Creator Economy
7.5. Decentralized Identity and Credentials
7.6. Data, Storage and Compute
7.7. Others
8. WEB3 MARKET BY INDUSTRY VERTICAL
8.1. Introduction
8.2. BFSI
8.3. IT and Telecom
8.4. Media and Entertainment
8.5. E-commerce and Retail
8.6. Healthcare and Pharmaceuticals
8.7. Others
9. WEB3 MARKET BY GEOGRAPHY
9.1. North America
9.1.1. USA
9.1.2. Canada
9.1.3. Mexico
9.2. South America
9.2.1. Brazil
9.2.2. Argentina
9.2.3. Others
9.3. Europe
9.3.1. United Kingdom
9.3.2. Germany
9.3.3. France
9.3.4. Switzerland
9.3.5. Others
9.4. Middle East and Africa
9.4.1. UAE
9.4.2. Saudi Arabia
9.4.3. South Africa
9.4.4. Others
9.5. Asia Pacific
9.5.1. Singapore
9.5.2. Japan
9.5.3. South Korea
9.5.4. India
9.5.5. China
9.5.6. Others
10. COMPETITIVE ENVIRONMENT AND ANALYSIS
10.1. Major Players and Strategy Analysis
10.2. Market Share Analysis
10.3. Mergers, Acquisitions, Agreements, and Collaborations
10.4. Competitive Dashboard
11. COMPANY PROFILES
11.1. Consensys
11.2. Alchemy
11.3. Circle Internet Group, Inc.
11.4. Coinbase Global, Inc.
11.5. Chainlink Labs
11.6. Ripple Labs Inc.
11.7. Polygon Labs
11.8. Solana Labs
11.9. Ava Labs
11.10. Uniswap Labs
11.11. Fireblocks
11.12. Blockdaemon
11.13. QuickNode
11.14. Securitize
11.15. Offchain Labs
12. APPENDIX





Frequently asked questions
What is the projected Web3 market value by 2031?
The Web3 market is projected to reach USD 34.86 billion by 2031.
What is the CAGR for the Web3 market from 2026 to 2031?
The Web3 market will grow at a 39.31% CAGR during 2026-2031.
Which Web3 segment held the largest market value in 2026?
Infrastructure and developer platforms accounted for 38% in 2026.
Which Web3 segment is projected for the fastest growth?
Tokenization and real-world-asset infrastructure will grow fastest at 47.6% annually.
Which region represents the largest Web3 market value in 2026?
North America represented 39% of global Web3 market value in 2026.
How is the Web3 market evolving from 2026 to 2031?
The Web3 Market's evolving towards institutional use, connecting blockchains with conventional finance.
Cite this report
Knowledge Sourcing Intelligence. (Oct 2026). Web3 Market - Strategic Insights and Forecasts (2026-2031). https://www.knowledge-sourcing.com/report/web3-market