
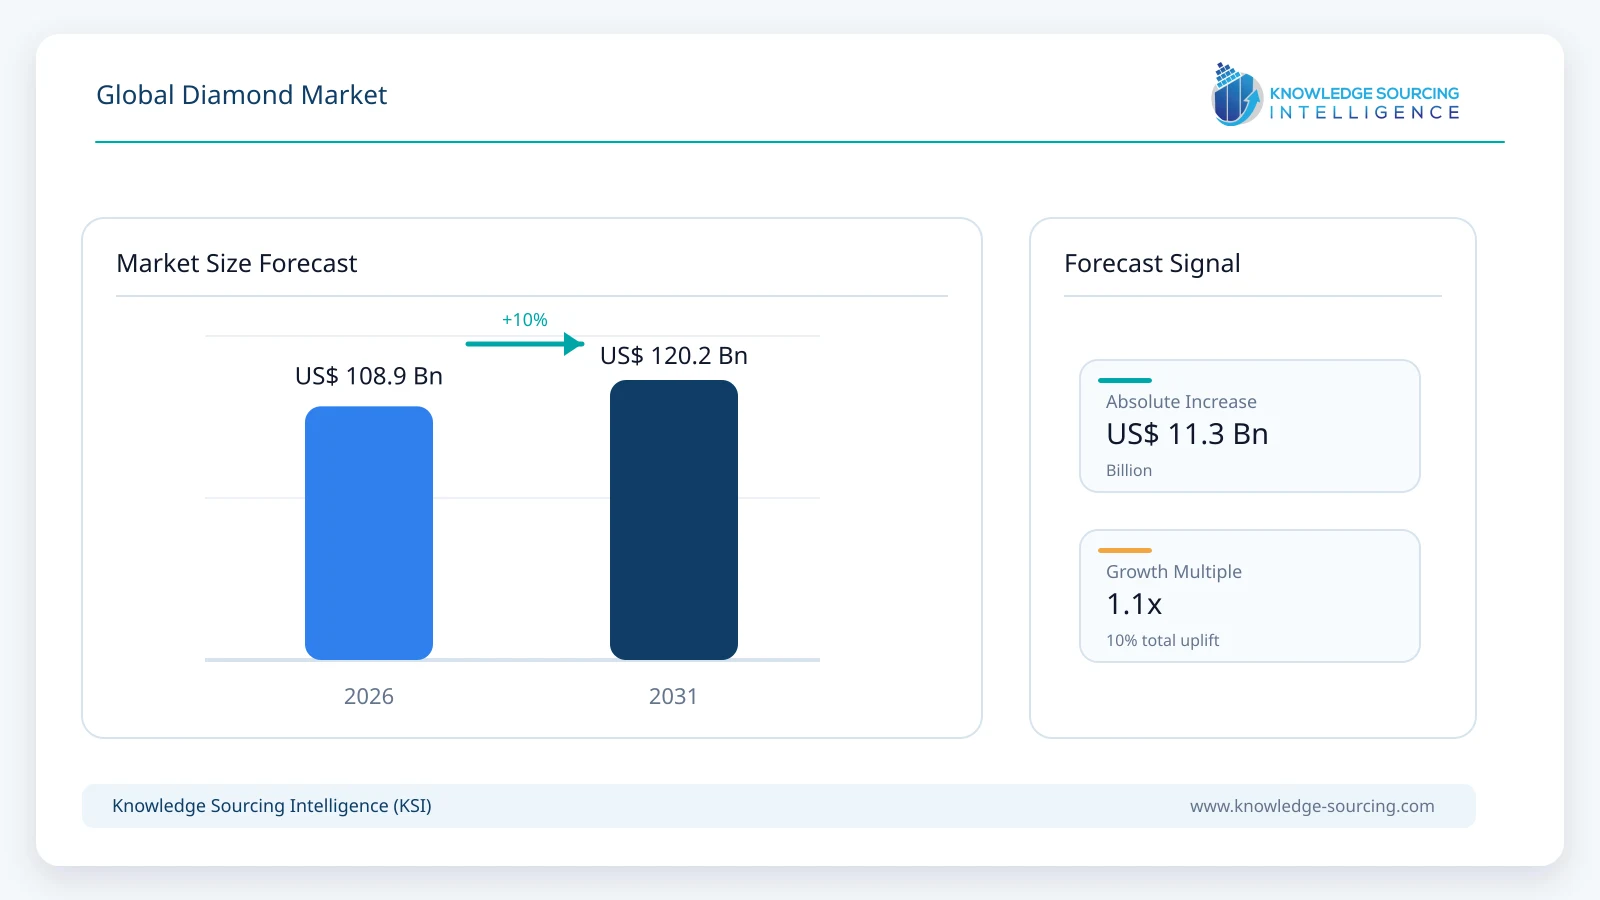
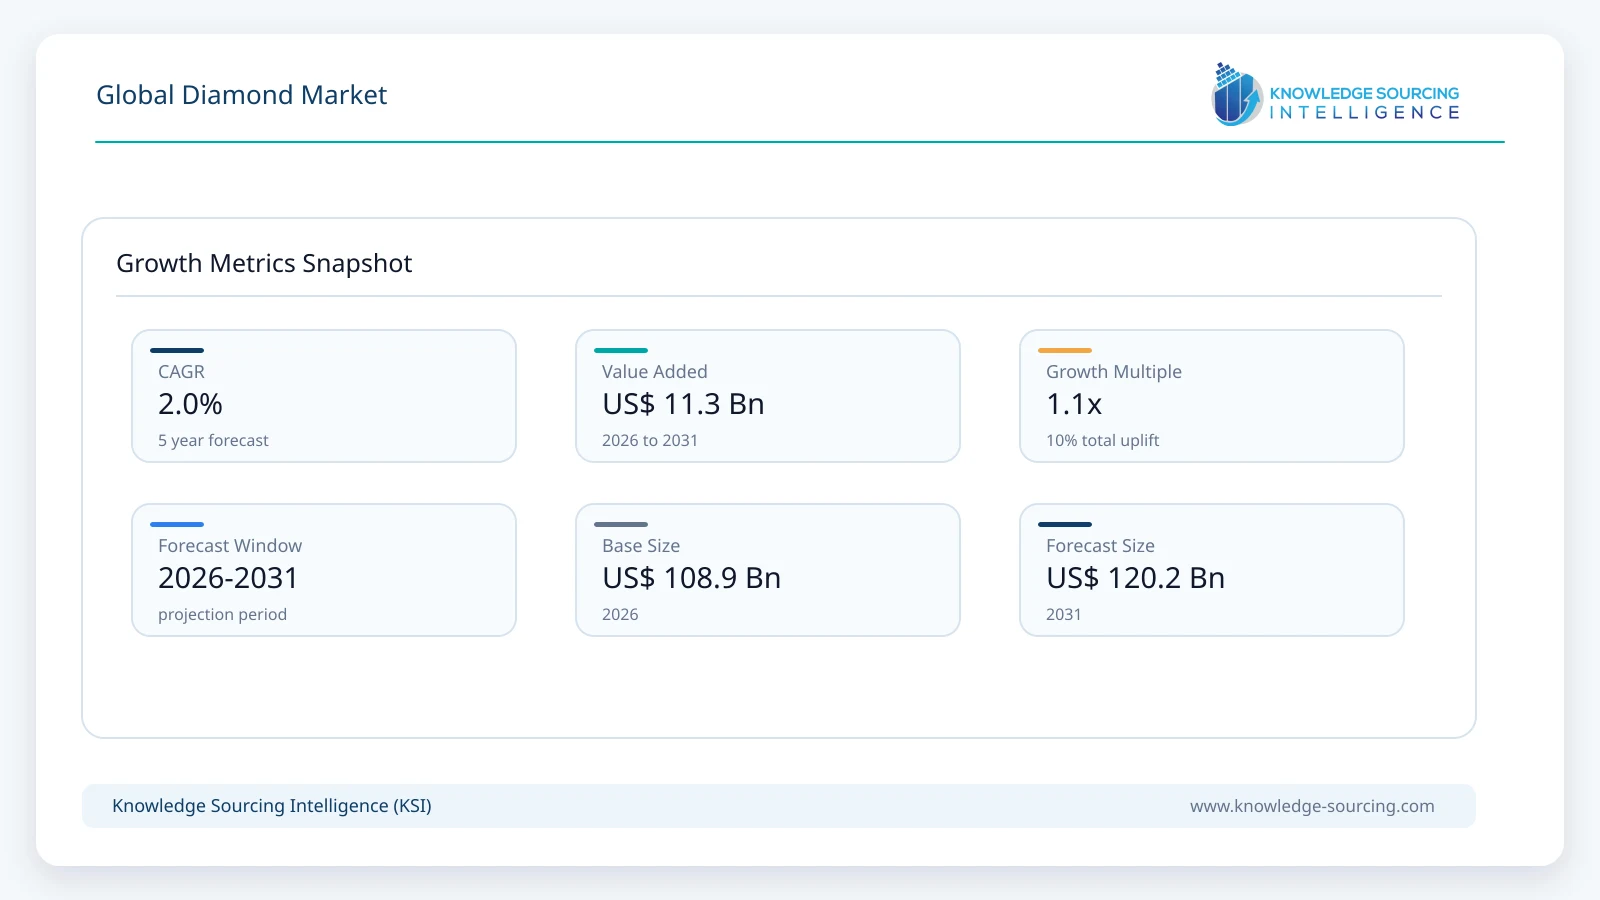
The global diamond market is forecast to grow at a CAGR of 2.0%, reaching USD 120.2 billion in 2031 from USD 108.9 billion in 2026.
Highlights:
- 1Natural diamonds account for approximately 86% of global market value in 2026 and remain the dominant origin category.
- 2Jewellery represents approximately 95% of market value in 2026, far ahead of industrial applications.
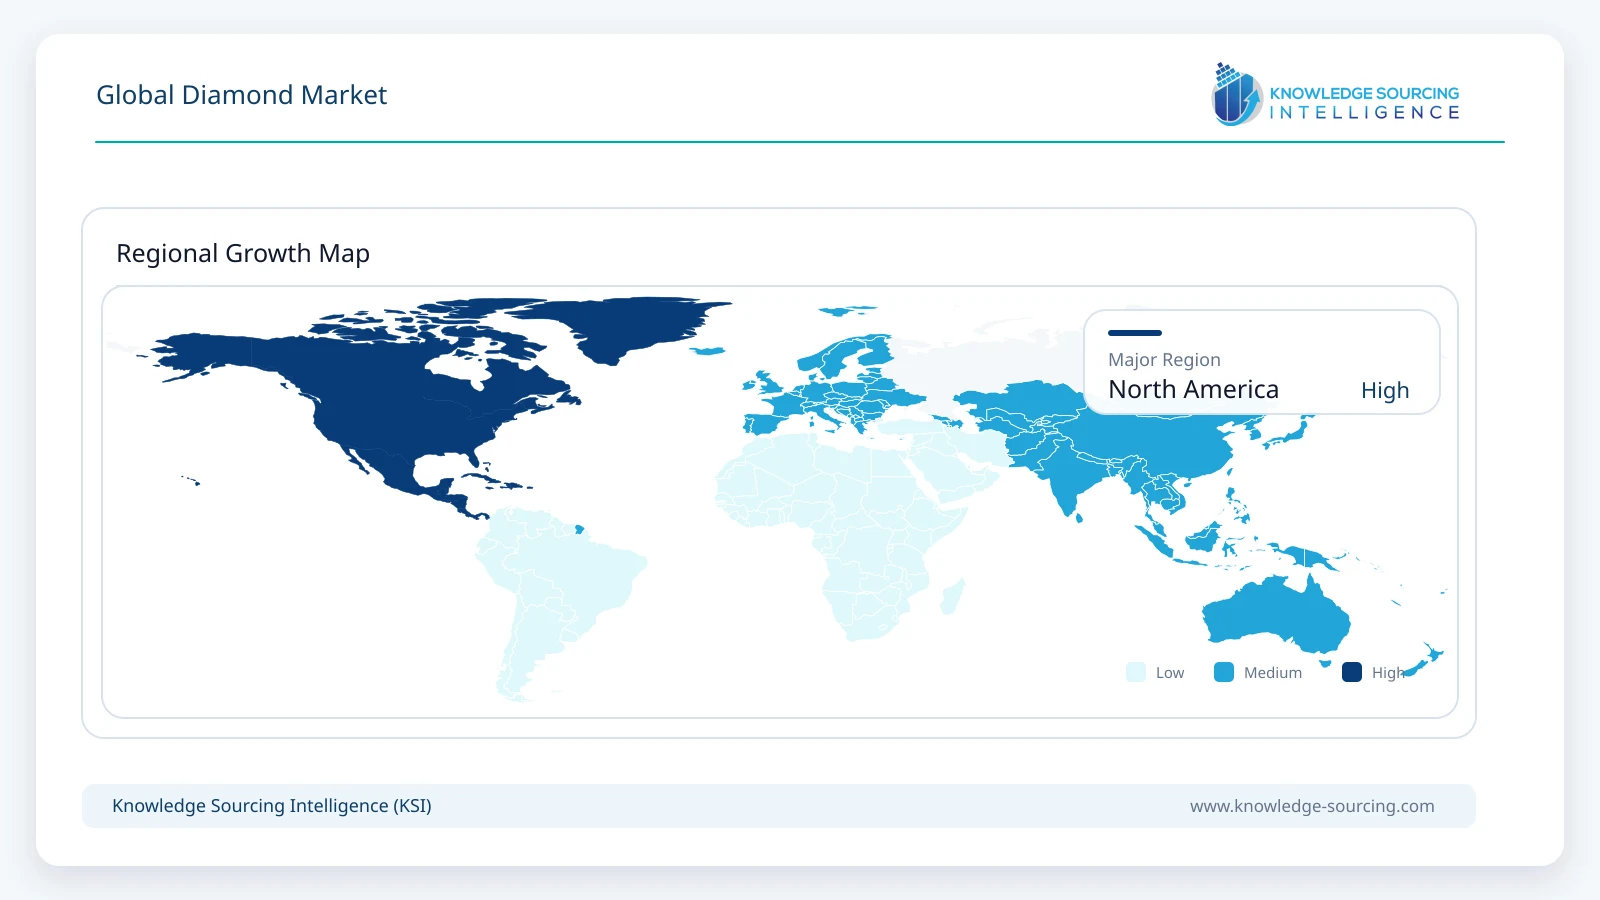
- 3North America accounts for approximately 42% of the global market in 2026, led by the United States.
- 4Asia Pacific represents approximately 31% of market value, supported by India and China.
- 5Lab-grown diamonds record faster volume growth, although price deflation limits value expansion.
- 6The market is forecast to reach USD 120.2 billion by 2031 from USD 108.9 billion in 2026.
Market Overview
The diamond market includes natural and laboratory-grown diamonds used primarily in jewellery, together with a smaller industrial segment covering cutting, grinding, drilling, electronics and thermal-management applications. The value chain extends from mining and synthetic production through rough sorting, trading, cutting and polishing, jewellery manufacturing and retail. Jewellery remains the principal value pool, while laboratory-grown production creates a parallel supply chain with different cost and pricing economics.
The natural diamond segment entered 2026 with a weaker rough-market backdrop. De Beers produced 21.7 million carats in 2025, down 12% from 2024, and retained 2026 guidance of 21 to 26 million carats. Its H1 2026 consolidated average realised price fell to USD 105 per carat. Russia produced 31.5 million carats in 2025, down from 37.3 million carats in 2024, while Canada produced 14.1 million carats. Rio Tinto's Diavik mine completed final production in March 2026 after more than 150 million carats of lifetime output, reinforcing the longer-term decline in natural supply.
Consumer demand is more resilient at the higher end. De Beers reported natural diamond sales at US independent jewellers rising 9% in Q1 2026, while India remains an important growth market and China remains subdued. Laboratory-grown diamonds continue to gain unit volume but lose price: De Beers reports wholesale synthetic prices have fallen about 93% since 2020 to around USD 100 per carat. The widening price gap is increasingly separating natural diamonds as a scarcity-led luxury proposition from lab-grown diamonds as a more accessible manufactured category.
Market Trends
• Natural and Lab-Grown Diamonds Are Becoming More Distinct Commercial Categories
Natural and laboratory-grown diamonds are becoming more distinct commercial categories. De Beers reported natural diamonds at about 85% of diamond sales value across US independent jewellers in 2025, compared with 15% for synthetic lab-grown stones. Lab-grown unit sales continue to increase, but falling manufacturing costs and wholesale prices reduce revenue per carat. Natural-diamond marketing is moving toward rarity, provenance and design, supporting a market in which synthetic stones gain volume while natural stones retain most of the value pool.
• Rough Diamond Supply Is Tightening Structurally
Natural diamond supply is tightening as mature mines deplete, and producers restrict output during weak trading conditions. Russia produced 31.5 million carats in 2025, De Beers reduced production to 21.7 million carats, and Diavik exited production in March 2026. Mountain Province and De Beers also paused the Tuzo Phase 3 project at Gahcho Kué. Future supply increasingly depends on long-life assets and capital-intensive mine extensions such as Lucara's Karowe underground project rather than large new discoveries.
• Traceability Is Moving From Marketing Feature to Trade Requirement
Provenance and traceability are becoming more important because of sanctions, consumer expectations and natural-diamond differentiation. The Kimberley Process covers approximately 99.8% of global rough production and trade. EU requirements for Russian-origin diamonds became stricter in 2026, including due-diligence evidence for specified polished natural diamonds. De Beers is also expanding Tracr and provenance-backed polished offerings, making traceability both a compliance requirement and a commercial differentiator.
Segment Analysis
• By Origin - Natural Diamonds
Natural diamonds account for approximately 86% of global market value in 2026 and remain the largest origin category through 2031. Their position is supported by engagement and bridal jewellery, high-value pieces, branded natural-diamond collections and scarcity at larger sizes and higher qualities. Supply discipline is becoming increasingly important to the segment. De Beers expects 2026 production of 21 to 26 million carats, while Russia's 2025 production fell to 31.5 million carats and Diavik has exited production. Reduced future mine supply should gradually improve the balance between rough inventories and consumer demand if midstream stocks continue normalising. Laboratory-grown diamonds expand faster in units, particularly at accessible price points and in selected industrial uses, but persistent manufacturing-cost reductions and wholesale price declines constrain their value share.
• By Application - Jewellery
Jewellery accounts for approximately 95% of global diamond market value in 2026, making consumer demand the primary determinant of industry revenue. The United States remains the most important end-market, with high-end natural diamond demand proving more resilient than lower-priced categories during 2025 and the first half of 2026. India is becoming increasingly important both as a consumer market and as the dominant cutting and polishing centre. Kimberley Process data show that India imported about 106.1 million carats of rough diamonds worth USD 11.07 billion in 2025, underlining the scale of the country's midstream role. Industrial diamonds form a much smaller value segment but benefit from synthetic-diamond use in precision cutting, abrasives, electronics, optics, and thermal management where engineered properties are more important than gem scarcity.
Market Drivers
• Higher-Value Natural Diamond Demand Remains Resilient in the United States and India
Natural-diamond demand is not recovering uniformly, but stronger higher-value jewellery sales provide support. De Beers reported 9% year-on-year growth at US independent jewellers in Q1 2026, while India remains a structural growth market through branded jewellery, organised retail and rising household incomes. The United States provides the largest consumer value pool and India combines growing domestic demand with the world's largest cutting and polishing ecosystem.
• Declining Natural Supply Supports Long-Term Scarcity Economics
Natural diamonds cannot be scaled quickly in response to demand. Large kimberlite mines require long exploration, permitting and development cycles, while several established assets are mature. Diavik's 2026 closure removes supply and De Beers expects global rough production to decline over the coming years. Once excess inventories normalise, lower mine supply should improve medium-term scarcity economics, particularly for larger and higher-quality stones.
• Lab-Grown Diamonds Expand Access and Industrial Applications
Laboratory-grown diamonds expand access to larger jewellery stones at lower price points and enable engineered industrial applications. CVD and HPHT processes allow producers to control purity and material characteristics, supporting uses in cutting, electronics, optics and thermal management. Jewellery growth is primarily volume-led because continued production improvements reduce wholesale prices, while industrial demand is driven more directly by performance characteristics.
Market Restraints
• Weak Rough Prices and Midstream Inventory Continue to Pressure Producers
The natural diamond value chain remains affected by excess inventory, conservative midstream purchasing and lower rough prices. De Beers' H1 2026 realised price fell 32% to USD 105 per carat, while Q2 consolidated rough sales revenue declined to USD 665 million from USD 1.2 billion a year earlier. Smaller producers face greater pressure from high fixed costs, illustrated by the 2026 creditor-protection proceedings involving Burgundy Diamond Mines and Arctic Canadian Diamond Company.
• Laboratory-Grown Price Deflation Limits Market Value Growth
Rapid synthetic-diamond price declines support affordability and unit sales but reduce revenue per carat and retailer margins. Wholesale prices have fallen about 93% since 2020, making lab-grown diamonds a strong volume-growth category but a weaker contributor to total market value. The trend also increases the need for retailers to differentiate natural and manufactured stones clearly.
• Trade Restrictions Increase Compliance Complexity
Sanctions and origin-verification requirements add documentation and supply-chain costs. From April 2026, EU rules require due-diligence evidence for specified polished natural diamonds to confirm they are not of Russian origin. Because stones commonly move through cutting hubs such as India before reaching consumer markets, compliance must follow diamonds across multiple jurisdictions and intermediaries.
Regional Outlook
• North America
North America accounts for approximately 42% of global diamond market value in 2026, with the United States representing the clear majority of regional demand. The market benefits from a mature engagement and bridal tradition, a large luxury-jewellery base and growing consumer choice between natural and laboratory-grown stones. De Beers' 2026 US consumer research indicates that higher-value natural diamonds are leading sales growth at independent jewellers, while synthetic lab-grown diamonds held about 15% of diamond sales value in 2025. Canada plays a different role as both a producing and consuming market. Kimberley Process data show Canadian rough-diamond production of 14.1 million carats in 2025, although the closure of Diavik and financial pressure at Ekati are reducing the country's future production profile. The United States therefore drives regional market value, while Canada remains strategically important to responsibly sourced natural-diamond supply.
Competitive Landscape
The diamond market combines large producers, state-linked mining groups and independent high-value miners. De Beers remains influential through mining, rough sales, traceability and branded jewellery, while ALROSA remains the largest producer by volume. Debswana operates Jwaneng and Orapa, and Petra Diamonds, Lucara, Mountain Province and Gem Diamonds provide additional exposure to South African, Botswana, Canadian and Lesotho production.
Competitive positioning increasingly depends on mine quality, balance-sheet resilience, sales flexibility and provenance. Lucara is extending Karowe underground, Gem Diamonds differentiates Letšeng through exceptional large stones, and Mountain Province is adjusting Gahcho Kué development to market conditions. Burgundy and Arctic Canadian illustrate the pressure on higher-cost producers, while premium stone mixes and credible traceability provide stronger defensive positioning.
Recent Developments
August 2026: De Beers maintained 2026 production guidance at 21 to 26 million carats.
July 2026: De Beers advanced portfolio restructuring after removing more than USD 100 million of annual overhead costs.
June 2026: Gem Diamonds recovered a 346.99-carat Type II white diamond at Letšeng.
May 2026: Burgundy Diamond Mines and Arctic Canadian entered creditor-protection proceedings for Ekati.
April 2026: EU rules tightened origin and due-diligence evidence for specified natural diamonds.
March 2026: Rio Tinto's Diavik mine completed final production after more than 150 million lifetime carats.
Market Outlook
The diamond market is expected to grow moderately through 2031 because the greatest structural changes are occurring within the market rather than through rapid expansion of total value. Natural diamond production is declining as mature mines close and producers moderate output, creating a tighter long-term supply base. Higher-value natural jewellery remains resilient in the United States and India, while China remains a weaker demand market. Laboratory-grown diamonds continue to expand in unit terms and provide an increasingly established consumer alternative, but sustained manufacturing-cost reductions and wholesale price declines constrain their contribution to market value. The result is a market in which differentiation, provenance, design and branded retail become increasingly important for natural diamonds, while manufacturing efficiency and application development drive the lab-grown category.
Diamond Market Scope:
| Report Metric | Details |
|---|---|
| Total Market Size in 2026 | USD 108.9 billion |
| Total Market Size in 2031 | USD 120.2 billion |
| Forecast Unit | Billion |
| Growth Rate | 2.0% |
| Study Period | 2021 to 2031 |
| Historical Data | 2021 to 2024 |
| Base Year | 2025 |
| Forecast Period | 2026 – 2031 |
| Segmentation | Origin, Application, Geography |
| Companies |
|
Market Segmentation
By Origin
Natural Diamonds
Laboratory-Grown Diamonds
By Application
Jewellery
Bridal and Engagement Jewellery
Fashion and Luxury Jewellery
Industrial
Cutting, Grinding and Drilling
Electronics, Thermal and Other Advanced Applications
By Geography
North America
United States
Canada
Mexico
South America
Brazil
Argentina
Others
Europe
United Kingdom
Germany
France
Russia
Others
Middle East and Africa
Saudi Arabia
Israel
South Africa
Botswana
Others
Asia Pacific
China
Japan
India
South Korea
Indonesia
Vietnam
Others
Table of Contents
1. INTRODUCTION
1.1. Market Overview
1.2. Market Definition
1.3. Scope of the Study
1.4. Market Segmentation
1.5. Currency
1.6. Assumptions
1.7. Base and Forecast Years Timeline
1.8. Key Benefits for Stakeholders
2. RESEARCH METHODOLOGY
2.1. Research Design
2.2. Research Process
2.3. Primary Research
2.4. Secondary Research
2.5. Market Estimation
2.6. Segment Modelling
2.7. Data Triangulation and Validation
3. EXECUTIVE SUMMARY
3.1. Key Findings
20313.3. Origin Outlook
3.4. Application Outlook
3.5. Regional Opportunity Summary
3.6. Analyst View
4. MARKET DYNAMICS
4.1. Market Drivers
4.1.1. Resilient Higher-Value Natural Diamond Demand in the United States and India
4.1.2. Declining Natural Diamond Mine Supply
4.1.3. Expansion of Laboratory-Grown Diamond Applications
4.2. Market Restraints
4.2.1. Weak Rough Prices and Midstream Inventory
4.2.2. Laboratory-Grown Diamond Price Deflation
4.2.3. Trade Restrictions and Origin Verification Requirements
4.3. Market Opportunities
4.4. Porter's Five Forces Analysis
4.5. Industry Value Chain Analysis
4.6. Rough Diamond Production, Inventory and Price Outlook
4.7. Traceability, Sanctions and Certification Environment
5. GLOBAL DIAMOND MARKET BY ORIGIN
5.1. Introduction
5.2. Natural Diamonds
5.3. Laboratory-Grown Diamonds
6. GLOBAL DIAMOND MARKET BY APPLICATION
6.1. Introduction
6.2. Jewellery
6.2.1. Bridal and Engagement Jewellery
6.2.2. Fashion and Luxury Jewellery
6.3. Industrial
6.3.1. Cutting, Grinding and Drilling
6.3.2. Electronics, Thermal and Other Advanced Applications
7. GLOBAL DIAMOND MARKET BY GEOGRAPHY
7.1. North America
7.1.1. By Origin
7.1.2. By Application
7.1.3. By Country
7.1.3.1. United States
7.1.3.2. Canada
7.1.3.3. Mexico
7.2. South America
7.2.1. Brazil
7.2.2. Argentina
7.2.3. Others
7.3. Europe
7.3.1. By Origin
7.3.2. By Application
7.3.3. By Country
7.3.3.1. United Kingdom
7.3.3.2. Germany
7.3.3.3. France
7.3.3.4. Russia
7.3.3.5. Others
7.4. Middle East and Africa
7.4.1. By Origin
7.4.2. By Application
7.4.3. By Country
7.4.3.1. Saudi Arabia
7.4.3.2. Israel
7.4.3.3. South Africa
7.4.3.4. Botswana
7.4.3.5. Others
7.5. Asia Pacific
7.5.1. By Origin
7.5.2. By Application
7.5.3. By Country
7.5.3.1. China
7.5.3.2. Japan
7.5.3.3. India
7.5.3.4. South Korea
7.5.3.5. Indonesia
7.5.3.6. Vietnam
7.5.3.7. Others
8. COMPETITIVE ENVIRONMENT AND ANALYSIS
8.1. Major Players and Strategy Analysis
8.2. Natural Diamond Supply Positioning
8.3. Large-Stone and Premium Diamond Positioning
8.4. Traceability and Provenance Capabilities
8.5. Mine-Life Extension and Capital Investment
8.6. Partnerships, Sales Channels and Marketing
8.7. Competitive Dashboard
9. COMPANY PROFILES
9.1. De Beers Group
9.2. ALROSA Group
9.3. Debswana Diamond Company
9.4. Petra Diamonds Limited
9.5. Lucara Diamond Corp.
9.6. Mountain Province Diamonds Inc.
9.7. Gem Diamonds Limited
9.8. Burgundy Diamond Mines
10. APPENDIX
10.1. Market Definition and Scope
10.2. Natural and Laboratory-Grown Diamond Classification
10.3. Currency and Conversion Assumptions
10.4. Base Year and Forecast Period
10.5. Market Estimation Approach
10.6. Primary and Secondary Research Framework
10.7. Data Triangulation and Validation
10.8. Abbreviations
Research Methodology
The market is analyzed using a combination of top-down and bottom-up approaches. The top-down assessment reviews global diamond jewellery expenditure, rough-diamond production and trade, cutting and polishing activity, laboratory-grown diamond penetration, industrial synthetic-diamond demand and country-level consumer trends. The bottom-up assessment evaluates producer revenues, rough sales volumes and realised prices, jewellery-channel demand, lab-grown value share and regional consumption patterns. Segment estimates are reconciled to the accepted global market total, with separate assumptions for origin, application and geography. Official Kimberley Process statistics, producer filings, government trade rules and company disclosures are used to validate supply, trade, pricing and market structure. The forecast does not mechanically extend one CAGR across all segments; relative growth is adjusted for mine depletion, inventory normalisation, lab-grown price deflation, regional jewellery demand, industrial adoption and traceability requirements.
Navigate
Trusted by the world's leading organizations











