
The Dry Bulk Shipping Market is forecast to grow at a CAGR of 3.0%, reaching 6.85 billion tonnes in 2031 from 5.91 billion tonnes in 2026.
Highlights:
- 1Iron ore accounts for approximately 30% of global dry bulk shipping volume in 2026.
- 2Asia Pacific remains the dominant destination market because of iron ore, coal, grain and bauxite import demand.
- 3Global dry bulk fleet growth is forecast at approximately 3.6% in 2026, ahead of underlying cargo growth.
- 4Coal still represents roughly one-quarter of dry bulk trade, but long-term thermal-coal volumes face structural pressure.
- 5Global steel demand is forecast to rise only 0.3% in 2026 before accelerating to 2.2% in 2027.
- 6IMO net-zero negotiations and existing efficiency rules are increasing the value of newer, fuel-efficient bulk carriers.
Market Overview
Dry bulk shipping links the world's major mining, agricultural and industrial production centres with commodity-consuming markets. The sector's economics are shaped less by the value of cargo than by the balance between tonne-miles and available vessel capacity. Iron ore is the largest individual dry bulk commodity, followed by coal, while grain, bauxite and alumina, fertilizers, steel products, cement, forest products and other minor bulks diversify demand across vessel classes. The largest cargoes are generally transported in Capesize and Panamax vessels, while Supramax and Handysize ships serve a wider range of ports and minor-bulk trades.
Recent market conditions illustrate why cargo growth alone is insufficient to explain earnings. UNCTAD reported that dry bulk freight earnings in the first half of 2025 fell to roughly USD 10,750 per day, around 30% below the same period of 2024, as weaker iron-ore and coal demand coincided with continued fleet growth. A temporary improvement in the Baltic Dry Index in June 2025 was supported by stronger Guinea-to-China bauxite shipments and recovering Chinese coal imports, but freight markets remained volatile. Pacific Basin's April 2026 update estimates total dry bulk fleet growth at 3.6% for 2026 and an orderbook equivalent to about 13% of the existing fleet, while more than 13% of current capacity is at least 20 years old.
Commodity demand is diverging sharply. Worldsteel expects global finished-steel demand to increase only 0.3% in 2026 to 1.724 billion tonnes, with Chinese demand falling 1.5% while India grows 7.4%. Coal trade is even more uneven. The IEA's September 2026 update estimates that global coal trade contracted in 2025 after a record 2024 and expects 2026 trade to rise only modestly because of temporary energy-market disruption. Seaborne thermal-coal demand is forecast to decline, while metallurgical-coal trade is more resilient. Grain flows are also shifting: USDA's September 2026 wheat outlook forecasts global wheat trade in 2026/27 down 6% from the previous year's record, with Black Sea logistics and changing import needs reshaping routes.
Market Trends
Tonne-Mile Demand Matters More Than Headline Cargo Growth
Freight demand is increasingly influenced by route length as much as by cargo tonnes. Trade sanctions, regional supply shifts, weather disruptions and geopolitical constraints can redirect commodities toward more distant suppliers and increase tonne-mile demand even when global cargo volumes are flat. Russian commodity flows redirected toward Asia, changing coal sourcing patterns, and longer Atlantic-to-Asia movements are examples of this effect. Conversely, greater use of Mongolian coal by China reduces seaborne tonne-miles even when total coal imports remain high. Shipowners therefore monitor origin-destination changes, congestion and sailing distances alongside conventional commodity forecasts.
Bauxite and Minor Bulks Are Diversifying Demand Away from Coal
Coal's share of long-term dry bulk growth is weakening, increasing the importance of bauxite, alumina, fertilizers, agricultural products and other minor bulks. UNCTAD highlighted rising bauxite shipments from Guinea to China as a major contributor to the Capesize freight-rate rebound in June 2025. These trades can materially influence vessel utilization because Guinea-to-China voyages are long-haul movements that create substantial tonne-mile demand. This diversification does not remove exposure to iron ore and coal, but it broadens the growth base for Capesize, Panamax and geared vessel segments.
Fleet Renewal Is Shifting Toward Fuel Efficiency and Optionality
Owners are balancing an aging fleet against uncertain future fuel regulation and historically high newbuilding prices. Pacific Basin reported that 13.1% of global dry bulk fleet capacity was at least 20 years old in April 2026, while the orderbook represented about 13.0% of existing capacity. Newbuilding programs increasingly emphasize fuel efficiency, scrubber readiness, lower-emission engines and design flexibility rather than simple capacity expansion. Pacific Basin itself had 13 Handysize and Supramax newbuildings on order as of June 2026, while Navios Partners has contracted two Japanese scrubber-fitted Capesize newbuildings for delivery in 2028-2029.
Shipping Decarbonization Is Becoming a Fleet-Economics Variable
Environmental regulation is affecting vessel valuation, operating speed and capital allocation. Existing IMO Energy Efficiency Existing Ship Index and Carbon Intensity Indicator requirements already influence operational decisions, while discussions on the IMO Net-Zero Framework continued through 2026. The framework would combine a global marine-fuel standard with a greenhouse-gas pricing mechanism for large ocean-going ships if adopted. Negotiations were still unresolved in September 2026, but the direction of regulation increases the relative attractiveness of newer efficient vessels and raises uncertainty around long-dated investment in conventional-fuel tonnage.
Market Drivers
Iron Ore and Steel Production Continue to Anchor Large-Bulk Demand
Iron ore remains the largest dry bulk commodity and the principal demand base for Capesize vessels. Global steel demand is expected to stabilize in 2026 and strengthen in 2027, with growth increasingly concentrated outside China. India is particularly important: worldsteel forecasts Indian steel demand to grow 7.4% in 2026 and 9.2% in 2027, supported by infrastructure, automotive production, capital goods and rail investment. Chinese steel demand is still contracting, but at a slower pace than in 2025. This geographic rebalancing supports continued long-haul iron ore movements even as China's property-related demand becomes less dominant.
Food Security and Agricultural Trade Sustain Grain Shipping
Grain trade provides a more diversified demand base than iron ore or coal because flows respond to harvest conditions, food-security policies, currency movements and regional supply deficits. Even when global trade contracts in a particular crop year, route changes can create strong regional vessel demand. USDA's September 2026 outlook expects wheat trade to decline from the prior year's record, but Canada and Australia are forecast to maintain strong export positions while EU shipments partly backfill reduced Black Sea availability. Panamax, Supramax and Handysize vessels benefit from the broad geographic spread of grain-export terminals and destination ports.
Infrastructure and Industrialization Support Minor-Bulk Growth
Cement, fertilizers, steel products, forest products, salt and other minor bulks benefit from infrastructure spending, urbanization and industrial development across India, Southeast Asia, Africa and the Middle East. These cargoes are less concentrated than iron ore and often move through ports that cannot accommodate the largest vessels. As a result, growth in minor bulks supports geared Supramax and Handysize fleets and improves demand diversification for operators that are less exposed to the largest commodity cycles.
Market Restraints
Fleet Growth, Commodity Volatility and Regulation Can Compress Freight Economics
Dry bulk shipping is highly cyclical because vessel supply adjusts slowly while commodity demand can change rapidly. Pacific Basin forecasts global dry bulk fleet growth of approximately 3.6% in 2026, creating oversupply risk if cargo volumes grow more slowly. Coal is an additional structural constraint: the IEA expects seaborne thermal-coal trade to remain under pressure even though temporary energy-market disruptions lifted demand in parts of Asia during 2026. Freight earnings are also exposed to bunker costs, port congestion, canal access, sanctions and weather. At the same time, tighter efficiency and emissions requirements can accelerate retrofit or replacement spending before owners have full visibility on future fuel standards.
Segment Analysis
By Commodity Type - Iron Ore
Iron ore is estimated at approximately 1.80 billion tonnes in 2026, representing the largest commodity segment. The trade is highly concentrated around Australian and Brazilian exports to Asian steel producers, particularly China, but future incremental demand is gradually shifting toward India and other developing steel markets. Iron ore's large parcel sizes and long-haul routes make it the principal cargo for Capesize vessels. Coal remains the second-largest dry bulk commodity, but thermal-coal trade is expected to grow more slowly and become increasingly dependent on short-term energy market conditions.
By Vessel Type - Capesize
Capesize vessels are estimated to carry approximately 2.02 billion tonnes of dry bulk cargo in 2026, making them the largest vessel segment by cargo volume. Their economics are dominated by iron ore, metallurgical coal and increasingly long-haul bauxite trades. Capesize earnings are therefore more volatile than those of smaller diversified vessels because a limited number of major trade routes can quickly change the balance of available ships. Panamax and Supramax vessels provide broader commodity exposure across coal, grain, fertilizers and minor bulks.
By Capacity - Greater than 80,000 DWT
Vessels above 80,000 DWT are estimated to account for approximately 3.19 billion tonnes of cargo in 2026. The segment combines Capesize, Newcastlemax, Kamsarmax and larger Panamax-class tonnage serving high-volume mineral and coal routes. Large vessels provide lower transport cost per tonne on deepwater routes but depend on suitable port infrastructure and large parcel sizes. Smaller vessels remain essential for ports with draft restrictions and for minor-bulk trades requiring greater geographic flexibility.
By Geography - Asia Pacific
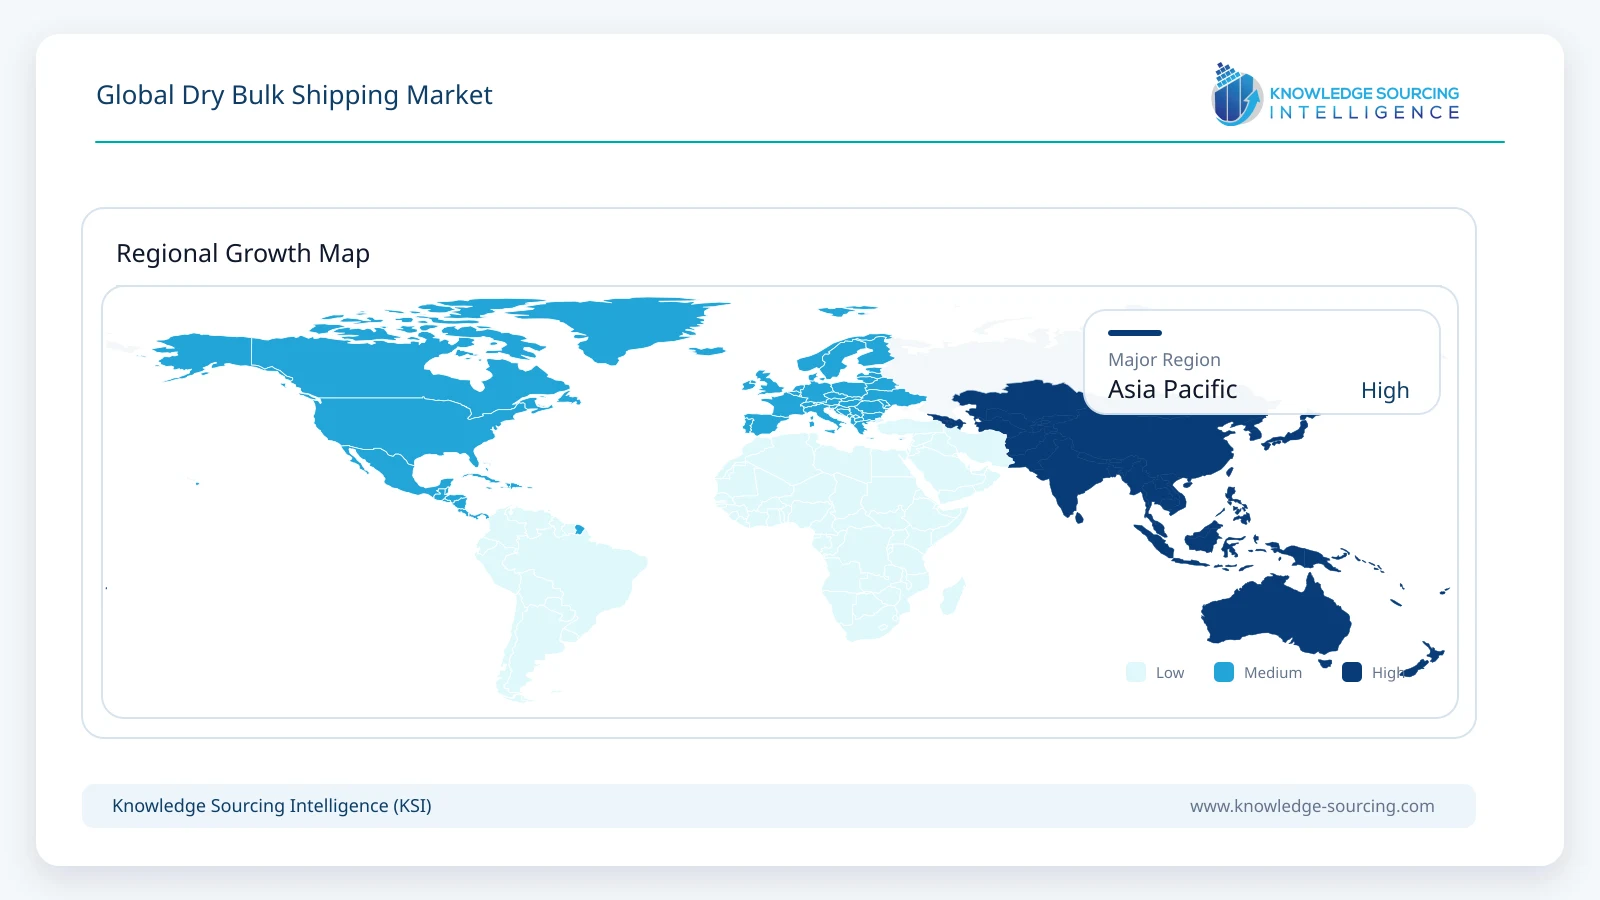
Asia Pacific is estimated to account for approximately 3.66 billion tonnes of dry bulk destination demand in 2026. China remains the largest single import market for iron ore and a major importer of coal and grain, while India is increasing its role in metallurgical coal and other industrial bulk cargoes. Japan, South Korea and Chinese Taipei remain large mature import markets, although thermal-coal requirements are structurally declining. Southeast Asia generates additional demand from coal, construction materials, grain, and other industrial commodities, with cargo flows shaped by regional production, trade, and consumption patterns.
Competitive Environment
The dry bulk shipping market is fragmented across publicly listed owners, private shipowners, commodity-linked operators and integrated maritime groups. Star Bulk, Diana Shipping, Genco, Safe Bulkers, Pacific Basin and Navios Maritime Partners are prominent listed participants, while Oldendorff Carriers, Berge Bulk, COSCO SHIPPING Bulk and several Japanese shipping groups operate large diversified fleets. Business models differ materially: some companies focus on large Capesize exposure, others specialize in Handysize and Supramax vessels, and many combine owned vessels with short- and long-term chartered tonnage.
Fleet age, charter strategy, balance-sheet strength and access to efficient newbuildings are becoming more important competitive differentiators. Pacific Basin operates a particularly large Handysize and Supramax platform, with 253 vessels in service across those segments as of 30 June 2026 and 13 newbuildings on order. Navios Partners is using long-term charter structures and fleet renewal across multiple vessel classes, while the attempted consolidation between Diana Shipping and Genco in 2026 illustrates continuing interest in scale and asset combinations within the listed dry bulk sector.
Recent Developments
September 2026: IMO working-group discussions continued on the Net-Zero Framework ahead of further consideration by the Marine Environment Protection Committee.
September 2026: The IEA revised 2026 coal trade expectations upward as energy-market disruption increased import demand in selected Asian markets.
August 2026: Pacific Basin reported 115 Handysize and 138 Supramax/Ultramax vessels in service, with 13 newbuildings on order as of 30 June.
July 2026: Diana Shipping extended its tender offer for Genco after increasing its proposed consideration to USD 27.34 per share.
May 2026: Navios Maritime Partners disclosed two Japanese scrubber-fitted Capesize newbuildings under long-term bareboat arrangements for 2028-2029 delivery.
April 2026: Pacific Basin expanded its newbuilding program as it continued fleet renewal across Handysize and Supramax/Ultramax classes.
Dry Bulk Shipping Market Scope:
| Report Metric | Details |
|---|---|
| Total Market Size in 2026 | 5.91 billion tons |
| Total Market Size in 2031 | 6.85 billion tons |
| Forecast Unit | Billion tons |
| Growth Rate | 3.0% |
| Study Period | 2021 to 2031 |
| Historical Data | 2021 to 2024 |
| Base Year | 2025 |
| Forecast Period | 2026 – 2031 |
| Segmentation | Commodity Type, Vessel Type, Capacity, Geography |
| Companies |
|
Market Segmentation
By Commodity Type
Iron Ore
Coal
Grain
Bauxite and Alumina
Minor Bulks
Others
By Vessel Type
Capesize
Panamax
Supramax
Handysize
Others
By Capacity
Up to 40,000 DWT
40,001 to 80,000 DWT
Greater than 80,000 DWT
By Geography
North America
United States
Canada
Mexico
South America
Brazil
Argentina
Others
Europe
Germany
France
United Kingdom
Italy
Others
Middle East & Africa
Saudi Arabia
UAE
South Africa
Others
Asia Pacific
China
India
Japan
South Korea
Indonesia
Viet Nam
Australia
Others
Table of Contents
1. EXECUTIVE SUMMARY
2. MARKET SNAPSHOT
2.1. Market Overview
2.2. Market Definition
2.3. Scope of the Study
2.4. Market Segmentation
3. BUSINESS LANDSCAPE
3.1. Market Drivers
3.1.1. Iron Ore and Steel Production Continue to Anchor Large-Bulk Demand
3.1.2. Food Security and Agricultural Trade Sustain Grain Shipping
3.1.3. Infrastructure and Industrialization Support Minor-Bulk Growth
3.2. Market Restraints
3.2.1. Fleet Growth, Commodity Volatility and Regulation Can Compress Freight Economics
3.3. Market Opportunities
3.4. Porter's Five Forces Analysis
3.5. Industry Value Chain Analysis
3.6. Policies and Regulations
3.7. Strategic Recommendations
4. TECHNOLOGICAL OUTLOOK
4.1. Vessel Energy-Efficiency Technologies
4.2. Alternative Fuels and Fuel-Ready Vessel Designs
4.3. Digital Voyage Optimization and Weather Routing
4.4. Hull, Propeller and Air-Lubrication Efficiency Systems
4.5. Fleet Monitoring and Predictive Maintenance
5. GLOBAL DRY BULK SHIPPING MARKET BY COMMODITY TYPE
5.1. Introduction
5.2. Iron Ore
5.3. Coal
5.4. Grain
5.5. Bauxite and Alumina
5.6. Minor Bulks
5.7. Others
6. GLOBAL DRY BULK SHIPPING MARKET BY VESSEL TYPE
6.1. Introduction
6.2. Capesize
6.3. Panamax
6.4. Supramax
6.5. Handysize
6.6. Others
7. GLOBAL DRY BULK SHIPPING MARKET BY CAPACITY
7.1. Introduction
7.2. Up to 40,000 DWT
7.3. 40,001 to 80,000 DWT
7.4. Greater than 80,000 DWT
8. GLOBAL DRY BULK SHIPPING MARKET BY GEOGRAPHY
8.1. Introduction
8.2. North America
8.2.1. United States
8.2.2. Canada
8.2.3. Mexico
8.3. South America
8.3.1. Brazil
8.3.2. Argentina
8.3.3. Others
8.4. Europe
8.4.1. Germany
8.4.2. France
8.4.3. United Kingdom
8.4.4. Italy
8.4.5. Others
8.5. Middle East & Africa
8.5.1. Saudi Arabia
8.5.2. UAE
8.5.3. South Africa
8.5.4. Others
8.6. Asia Pacific
8.6.1. China
8.6.2. India
8.6.3. Japan
8.6.4. South Korea
8.6.5. Indonesia
8.6.6. Viet Nam
8.6.7. Australia
8.6.8. Others
9. COMPETITIVE ENVIRONMENT AND ANALYSIS
9.1. Major Players and Strategy Analysis
9.2. Fleet and Vessel-Class Positioning
9.3. Mergers, Acquisitions, Newbuildings and Fleet Renewal
9.4. Competitive Dashboard
10. COMPANY PROFILES
10.1. Star Bulk Carriers Corp.
10.2. Diana Shipping Inc.
10.3. Genco Shipping & Trading Limited
10.4. Safe Bulkers, Inc.
10.5. Pacific Basin Shipping Limited
10.6. Oldendorff Carriers GmbH & Co. KG
10.7. Berge Bulk Limited
10.8. COSCO SHIPPING Bulk Co., Ltd.
10.9. Nippon Yusen Kabushiki Kaisha (NYK Line)
10.10. Mitsui O.S.K. Lines, Ltd.
10.11. Kawasaki Kisen Kaisha, Ltd. (K LINE)
10.12. Navios Maritime Partners L.P.
10.13. Ultrabulk A/S
10.14. Pangaea Logistics Solutions Ltd.
10.15. U-Ming Marine Transport Corporation
10.16. Precious Shipping Public Company Limited
10.17. The Great Eastern Shipping Company Limited
10.18. Fednav Limited
11. APPENDIX
11.1. Currency
11.2. Assumptions
11.3. Base and Forecast Years Timeline
11.4. Key Benefits for Stakeholders
11.5. Research Methodology
11.6. Abbreviations
LIST OF FIGURES
LIST OF TABLES
Navigate
Trusted by the world's leading organizations











