
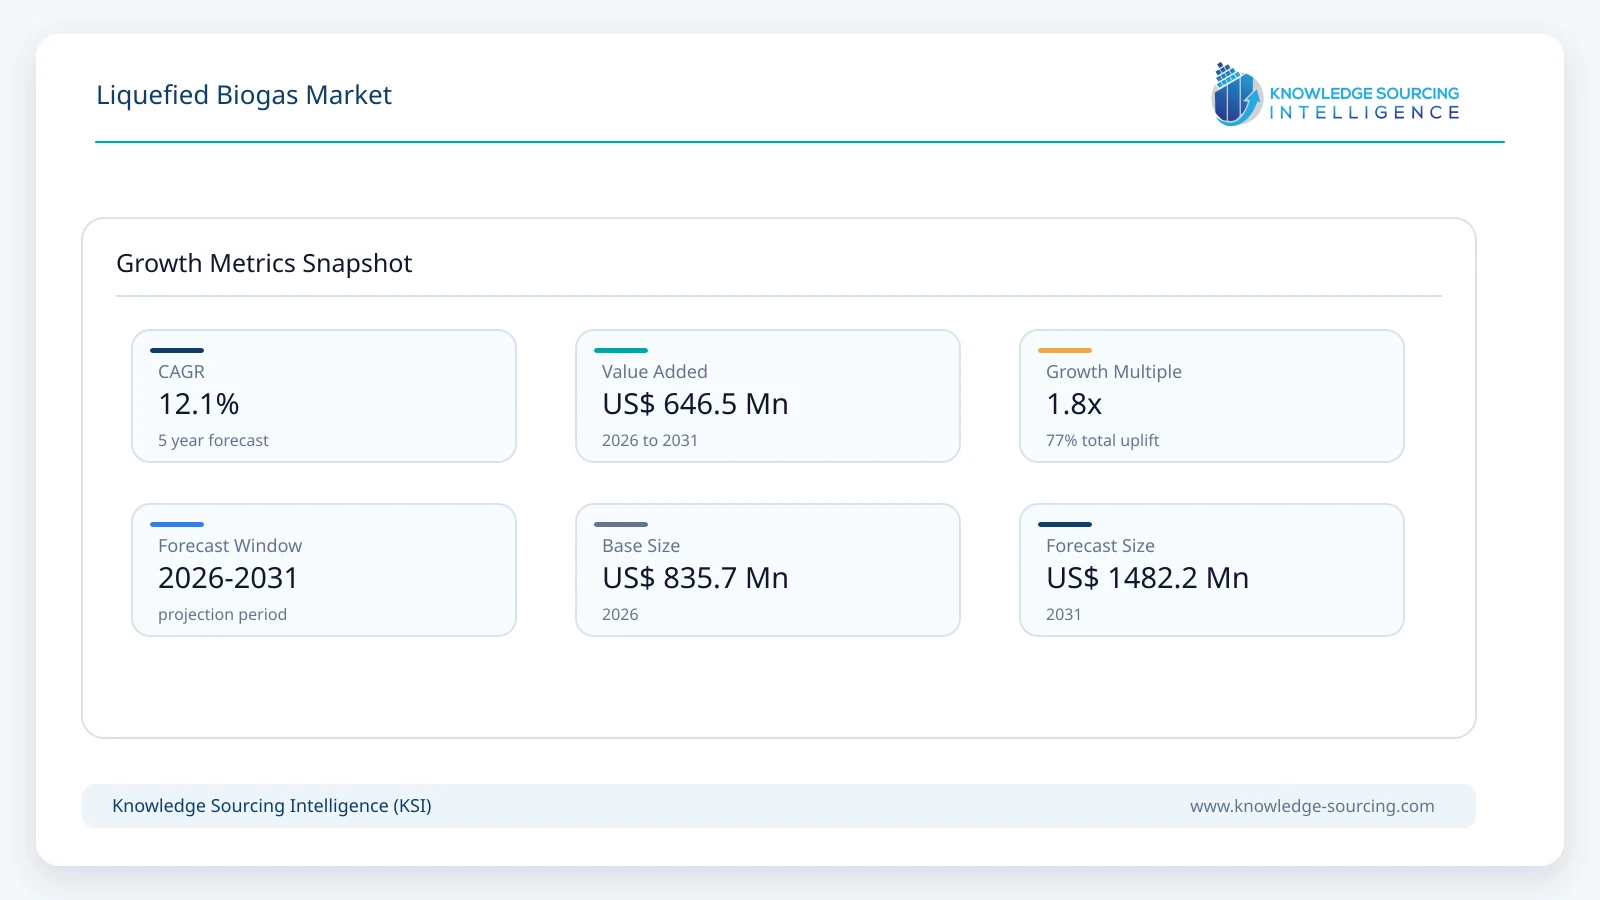
The Liquefied Biogas Market is projected to grow at a CAGR of 12.1%, increasing from USD 835.7 million in 2026 to USD 1,482.2 million by 2031 during forecast period.
Highlights:
- 1Agricultural manure and crop residues account for an estimated 42.0% of the global market in 2026, supported by established anaerobic digestion infrastructure and increasing utilisation of agricultural waste for biomethane production.
- 2Heavy-duty road transportation holds an estimated 76.0% market share in 2026, reflecting established bio-LNG consumption in European freight transport and the availability of LNG-compatible commercial vehicles.
- 3Marine fuel and bunkering is projected to grow at a CAGR of 25.2% during 2026–2031, driven by maritime decarbonisation requirements, expanding LNG-fuelled vessel fleets and increasing bio-LNG bunkering availability.
- 4Direct liquefaction of digester-derived biomethane accounts for an estimated 67.0% of the market in 2026, supported by established upgrading and liquefaction infrastructure connected to agricultural and organic-waste facilities.
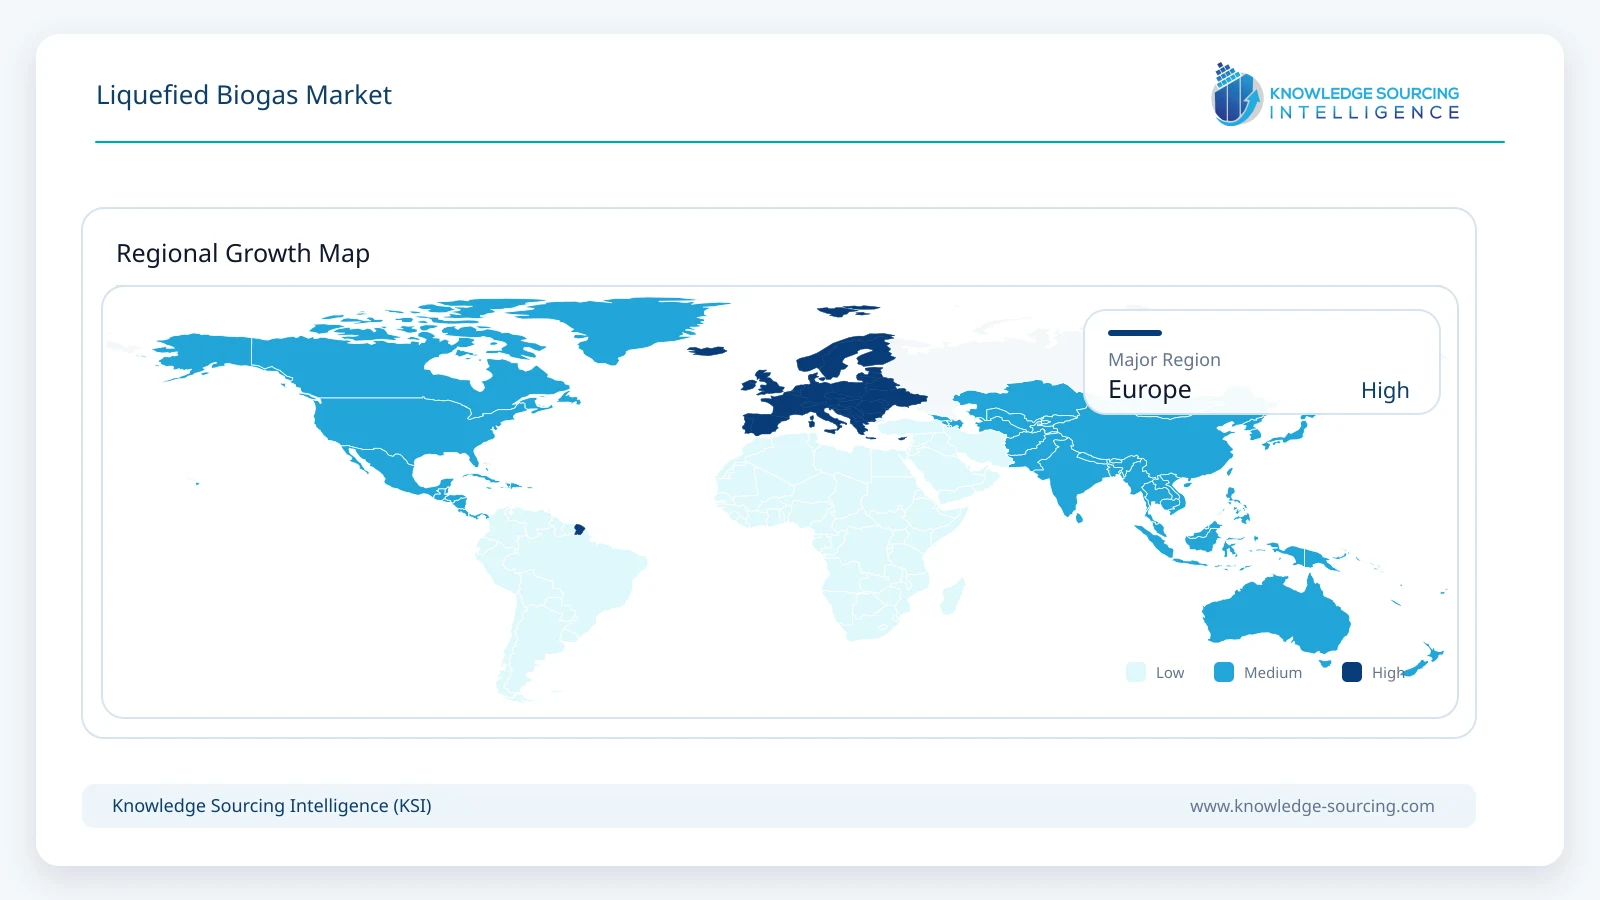
- 5Europe accounts for an estimated 72.0% of global market revenue in 2026, supported by renewable fuel policies, commercial bio-LNG production facilities and established heavy-duty transport demand.
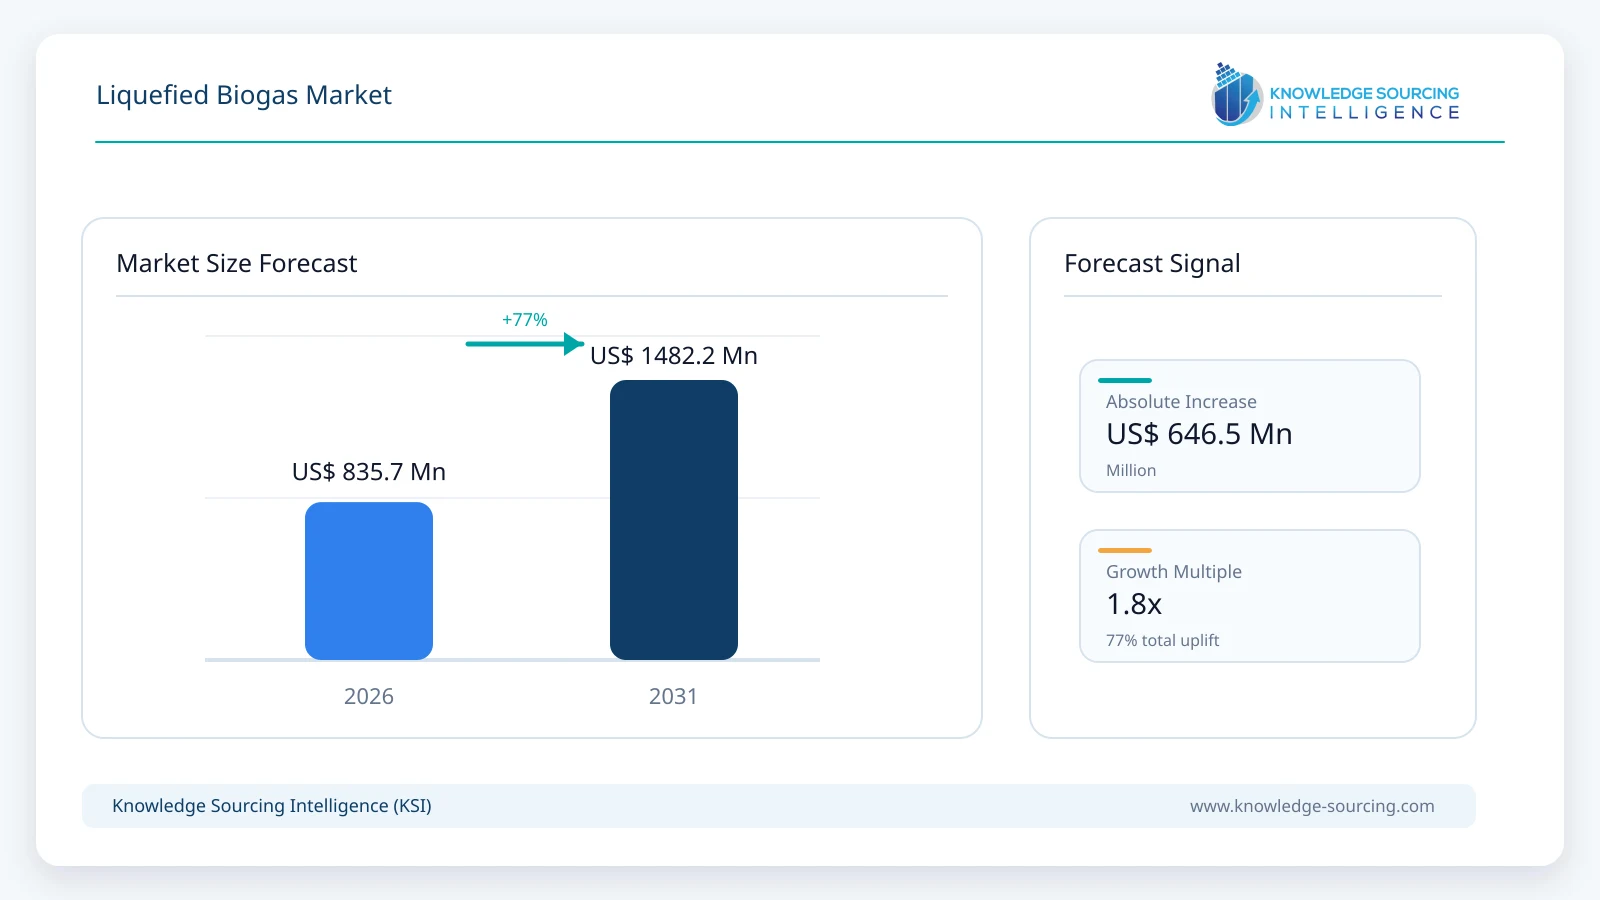
Demand grows as renewable methane moves beyond local biogas applications into long-haul transport and marine fuel supply. The commercial opportunity is shaped by realised fuel deliveries, access to liquefaction and LNG logistics, and customers procuring independently certified low-emission energy. Producers that combine secure organic feedstock contracts with reliable liquefaction and long-term fuel offtake are better positioned to maintain margins as demand increases.
Europe remains the most established commercial region, supported by biomethane production, LNG distribution and maritime emissions requirements. Installed European biomethane capacity reached 8.2 billion cubic metres per year by mid-2026, although this includes gaseous biomethane and cannot be equated with liquid-fuel sales. The liquefied biogas market covers physical bio-LNG deliveries and eligible certified mass-balanced supplies without counting the underlying gas twice. That distinction is important for procurement decisions and for comparing the economics of local liquefaction with gas-grid-based supply arrangements.
Market Dynamics
Decarbonisation of heavy-duty and maritime transport
Long-haul trucking and shipping remain relevant destinations for bio-LNG because existing LNG-compatible vehicles, tanks and bunkering assets can generally handle liquefied renewable methane, subject to fuel-quality and operating requirements. For transport operators, the commercial decision is driven by delivered fuel cost and verified emissions outcomes. Bio-LNG can be adopted without replacing the full LNG asset base, but the renewable component must be properly documented to support compliance and customer claims. As customers increasingly evaluate fuels on a well-to-wheel or well-to-wake basis, contractual evidence of origin and greenhouse-gas savings becomes a competitive requirement, not an administrative detail.
Policy-linked demand and fuel procurement
FuelEU Maritime, applicable from January 2025, sets progressively tighter limits on the lifecycle greenhouse-gas intensity of energy used by covered vessels, beginning with a 2% reduction in 2025 and moving to a 6% reduction in 2030 against the regulation’s reference value. The framework is technology-neutral: bio-LNG competes with other compliant fuels and operating measures. Its competitive position depends on certification, actual methane slip, feedstock pathways and the price of alternative compliance options. EU emissions trading further changes fleet economics, but neither regime guarantees demand for every bio-LNG project.
Feedstock availability and conversion economics
Reliable access to manure, food-processing residues, source-separated organic waste, sewage sludge and recoverable landfill methane determines where renewable methane can be supplied economically. Feedstock concentration affects collection cost and consistency, while contaminants increase the complexity of biogas cleaning and upgrading. Smaller projects gain value from decentralised liquefaction when gas-grid injection is expensive or unavailable; larger projects can favour pipeline injection and later liquefaction through established terminals. These choices alter capital requirements, electricity consumption, maintenance intensity and the selling price required to earn acceptable returns.
Production readiness and plant utilisation
Commercial sales do not necessarily rise in step with announced nameplate capacity. Construction, commissioning, waste-contract availability, digester performance and refrigerated transport assets determine how quickly production reaches steady-state operation. The fixed costs of liquefaction and storage become harder to recover at low throughput. Operators pursuing additional projects increasingly rely on long-term feedstock and fuel-offtake agreements to reduce these risks.
Methane leakage and verification
Methane emissions can occur during biogas collection, upgrading, liquefaction and the combustion of fuel in engines. As a result, the climate benefit varies by feedstock and equipment configuration. FuelEU Maritime assesses fuel performance on a lifecycle basis and includes methane emissions associated with engines. Projects with credible measurement, leak prevention and independently verified sustainability information are better placed to serve corporate and compliance-led buyers.
Segmentation Analysis
By Feedstock
Agricultural manure and crop residues represent an estimated USD 351.00 million in 2026. The segment benefits from established digestion infrastructure and the opportunity to capture methane that would otherwise escape from manure management. However, projects using dispersed agricultural feedstock must control collection distances and seasonal feedstock variations. Contracted manure supply, co-digestion expertise and sufficient year-round gas production determine whether these plants can support reliable liquefied fuel deliveries. Food and industrial organic residues contribute an estimated USD 183.86 million in the same year. Their relatively concentrated collection points and predictable waste streams can support higher plant utilisation when waste quality and contamination are controlled.
Source-separated municipal and commercial organics account for an estimated USD 217.28 million in 2026. This segment benefits where municipalities and waste processors can separate biodegradable materials at source and support large processing sites near fuel logistics networks. High contamination levels or inconsistent sorting reduce biomethane yields and increase treatment costs. Landfill-gas and wastewater-derived pathways contribute an estimated USD 83.57 million. Their commercial viability depends on recoverable methane quality, gas-collection performance and the economics of upgrading and liquefaction. These feedstock categories are allocated by primary origin to avoid counting mixed waste streams more than once.
By Application
Heavy-duty road transport generates an estimated USD 635.14 million in 2026. It is the primary commercial outlet because fleets operating LNG-powered trucks can substitute certified bio-LNG without replacing their core fuel-storage and dispensing infrastructure. Germany illustrates how rapidly renewable methane can penetrate an existing LNG-fuelling network: industry figures for 2025 indicate that 98.5% of the LNG dispensed at its road-fuel stations was bio-LNG. This established distribution route favours fuel suppliers able to provide repeatable tanker deliveries, verified sustainability credentials and contract structures that manage changes in LNG and renewable-credit pricing.
The road-fuel opportunity depends on three connected capabilities: securing renewable methane production, arranging liquefaction and cryogenic transport, and maintaining reliable retail or depot delivery. Fuel providers can grow faster by contracting existing fleet customers than by relying solely on new vehicle adoption. Nevertheless, freight customers remain sensitive to total vehicle operating costs, and the availability of LNG-powered trucks, fuel stations and policy recognition determines the pace at which renewable fuel demand converts into repeat purchasing.
Marine fuel and bunkering account for an estimated USD 158.78 million in 2026. Their commercial importance is increasing because vessels with LNG propulsion can use suitably specified bio-LNG through compatible bunkering arrangements. Gasum reported that biomethane increased from 0.8% to 12.3% of the gas volumes sold to its maritime customers between 2024 and 2025, illustrating a changing fuel mix rather than a market-wide share. Buyers are increasingly assessing lifecycle emissions, methane slip and the ability to document renewable origin under rules such as FuelEU Maritime. Off-grid power generation contributes an estimated USD 16.71 million, while industrial heating and other uses account for USD 25.08 million. These are more selective outlets because stationary users often have access to pipeline gas, gaseous biomethane or alternative low-emission energy sources.
By Production and Supply Pathway
Direct liquefaction of biomethane produced in anaerobic digesters accounts for an estimated USD 559.93 million in 2026. This route is most competitive where organic feedstock is concentrated and the resulting bio-LNG can be dispatched to nearby truck-fuelling stations or marine terminals. It enables physical tracking of production and can support liquid biogenic CO2 recovery as a separate co-product. Direct liquefaction of recovered landfill gas represents approximately USD 41.79 million, with economics depending on variable landfill-gas quality, collection efficiency and treatment requirements.
Certified grid mass-balanced biomethane supplied as LNG contributes an estimated USD 233.99 million in 2026. Grid injection allows certified renewable methane production and physical LNG withdrawal to take place at different locations where the applicable accounting framework permits it. This can improve supply flexibility for fuel retailers and bunker operators, although the renewable attribute must be transferred and retired consistently so that the same biomethane is not counted in more than one sale. Thermochemical gasification and methanation form a separate route to renewable synthetic methane; they are not treated as a mature core biogas-production process in this classification.
Regional Analysis: Europe
Europe represents an estimated USD 601.71 million of the global liquefied biogas market in 2026, supported by an extensive biomethane production network, road transport demand and LNG bunkering infrastructure. German industry figures recorded 166,513 tonnes of LNG dispensed at road-fuel stations in 2025, of which 98.5% was bio-LNG. Sweden separately produced 331 GWh of physically liquefied biomethane in 2025, while its reported consumption included imported supplies. These statistics measure distinct transactions and are not additive without trade adjustments. Their significance lies in demonstrating established commercial outlets: Germany provides a substantial road-fuel retail market, while the Nordic system combines local liquefaction, cross-border procurement and growing maritime demand. As a result, investment opportunities depend on sales channels and certified deliveries, not simply the number of biomethane plants.
Northern and Western Europe are central to the emerging supply chain. Nordic operators are connecting agricultural and industrial residues to liquefied fuel used by freight customers, while projects in the Netherlands demonstrate decentralised bio-LNG production from household and commercial organic waste. The European Commission’s FirstBio2Shipping initiative identifies the Wilp facility as a practical model for converting organic waste into high-purity liquid fuel for ships and trucks. Market development is particularly attractive where feedstock, liquefaction, transportation and end-user contracts are coordinated across the value chain.
For maritime customers, FuelEU Maritime encourages progressively lower greenhouse-gas intensity in energy used on board covered ships. Bio-LNG competes with other compliance pathways and must be assessed using lifecycle emissions, including methane slip. Successful suppliers increasingly combine certification, reliable liquefaction access, suitable bunker vessels and flexible sourcing contracts. This favours partnerships between renewable gas producers and maritime logistics providers over projects dependent on spot fuel sales alone.
Competitive Landscape
The competitive environment combines fuel producers, liquefaction specialists and distribution companies. Gasum, St1 Biokraft and Suomen Lantakaasu illustrate the role of Nordic production and fuel supply. Nordsol develops decentralised liquefaction solutions, while EnviTec Biogas and Nord Gas Solutions contribute conversion and plant engineering capabilities. Titan Clean Fuels, part of Molgas, represents downstream marine bunkering and fuel delivery. Shell and TotalEnergies operate broader gas and low-carbon fuel businesses, while Linde and Air Liquide contribute cryogenic and processing capabilities. These participants occupy different positions in the value chain, so ranking them as a single group of interchangeable bio-LNG producers would misrepresent competition.
Commercial advantage increasingly depends on integrating reliable residue supply, high plant availability, documented renewable origin and customer-specific fuel logistics. Technology developers are judged on energy efficiency, recovery rate and service coverage; fuel marketers on reliable delivery and regulatory documentation; and producers on feedstock security and contracted utilisation.
Recent Developments
September 2026: Nord Gas Solutions announced a contract for a 35-tonne-per-day bio-LNG plant in Poland using existing biogas infrastructure. The project was announced as a planned development, not an operating facility.
September 2026: Titan Clean Fuels and Sogestran agreed to develop a 6,000-cubic-metre LNG bunkering vessel for the Western Mediterranean, designed to serve both LNG and liquefied biomethane customers. The vessel was not described as operational at announcement.
August 2026: Suomen Lantakaasu inaugurated its Nurmo production plant in Finland with an announced annual production capacity of approximately 100 GWh of liquefied biogas, using manure and food-sector residues.
2025: The FirstBio2Shipping project highlighted operational bio-LNG production at Attero’s Wilp site, developed with Nordsol, targeting 2,400 tonnes of bio-LNG annually from organic household waste.
Liquefied Biogas Market Scope:
| Report Metric | Details |
|---|---|
| Total Market Size in 2026 | USD 835.7 million |
| Total Market Size in 2031 | 1,482.2 million |
| Forecast Unit | USD Million |
| Growth Rate | 12.1% |
| Study Period | 2021 to 2031 |
| Historical Data | 2021 to 2024 |
| Base Year | 2025 |
| Forecast Period | 2026 – 2031 |
| Segmentation | Feedstock, Application, Production and Supply Pathway, , Geography |
| Companies |
|
Market Segmentation
By Feedstock
Agricultural Manure and Crop Residues
Food and Industrial Organic Residues
Source-Separated Municipal and Commercial Organics
Landfill Gas and Wastewater-Derived Gas
By Application
Heavy-Duty Road Transportation
Marine Fuel and Bunkering
Off-Grid Power Generation
Industrial Heating and Other Uses
By Production and Supply Pathway
Direct Liquefaction of Digester-Derived Biomethane
Direct Liquefaction of Recovered Landfill Gas
Certified Grid Mass-Balanced Bio-LNG Supply
Liquefaction Technology and Energy Use
By Geography
North America
United States
Canada
South America
Brazil
Europe
Germany
Netherlands
Nordic Countries
United Kingdom
France and Italy
Rest of Europe
Asia Pacific
China
India
Japan and South Korea
Middle East and Africa
Table of Contents
1. EXECUTIVE SUMMARY
1.1. Market Outlook
1.2. Key Findings
1.3. Commercial Opportunity and Risk
2. RESEARCH SCOPE AND METHODOLOGY
2.1. Market Definition and Boundary
2.2. Physical and Certified Mass-Balance Supply
2.3. Revenue Recognition and Double-Counting Controls
2.4. Historical and Forecast Period
2.5. Revenue Estimation and Segment Forecast Framework
3. INDUSTRY LANDSCAPE
3.1. Biomethane-to-Bio-LNG Value Chain
3.2. Biogas Upgrading and Purification
3.3. Onsite and Centralised Liquefaction
3.4. Renewable Gas Certification
3.5. Distribution, Bunkering and Retail Fuel Supply
4. MARKET DYNAMICS
4.1. Heavy-Duty Transport Decarbonisation
4.2. Maritime Fuel Compliance
4.3. Feedstock Availability and Competition
4.4. Liquefaction Costs and Plant Utilisation
4.5. Methane Slip and Lifecycle Accounting
4.6. Offtake Contracting and Project Financing
5. LIQUEFIED BIOGAS MARKET BY FEEDSTOCK
5.1. Agricultural Manure and Crop Residues
5.2. Food and Industrial Organic Residues
5.3. Source-Separated Municipal and Commercial Organics
5.4. Landfill Gas and Wastewater-Derived Gas
6. LIQUEFIED BIOGAS MARKET BY APPLICATION
6.1. Heavy-Duty Road Transportation
6.2. Marine Fuel and Bunkering
6.3. Off-Grid Power Generation
6.4. Industrial Heating and Other Uses
7. LIQUEFIED BIOGAS MARKET BY PRODUCTION AND SUPPLY PATHWAY
7.1. Direct Liquefaction of Digester-Derived Biomethane
7.2. Direct Liquefaction of Recovered Landfill Gas
7.3. Certified Grid Mass-Balanced Bio-LNG Supply
7.4. Liquefaction Technology and Energy Use
8. LIQUEFIED BIOGAS MARKET BY GEOGRAPHY
8.1. North America
8.1.1. United States
8.1.2. Canada
8.2. South America
8.2.1. Brazil
8.3. Europe
8.3.1. Germany
8.3.2. Netherlands
8.3.3. Nordic Countries
8.3.4. United Kingdom
8.3.5. France and Italy
8.3.6. Rest of Europe
8.4. Asia Pacific
8.4.1. China
8.4.2. India
8.4.3. Japan and South Korea
8.5. Middle East and Africa
9. COMPETITIVE ENVIRONMENT
9.1. Bio-LNG Producers and Renewable Gas Suppliers
9.2. Liquefaction and Plant Technology Providers
9.3. Fuel Marketing and Marine Bunkering
9.4. Partnerships and Offtake Agreements
9.5. Recent Project Developments
10. COMPANY PROFILES
10.1. Gasum Oy
10.2. St1 Biokraft AS
10.3. Suomen Lantakaasu Oy
10.4. Nordsol B.V.
10.5. EnviTec Biogas AG
10.6. Nord Gas Solutions
10.7. Titan Clean Fuels (Molgas Group)
10.8. Shell plc
10.9. TotalEnergies SE
10.10. Linde plc
10.11. Air Liquide S.A.
11. APPENDIX
11.1. Definitions and Conversion Factors
11.2. Scope Exclusions
11.3. Research Methodology
11.4. Source Documents
11.5. Abbreviations
Navigate
Trusted by the world's leading organizations











