
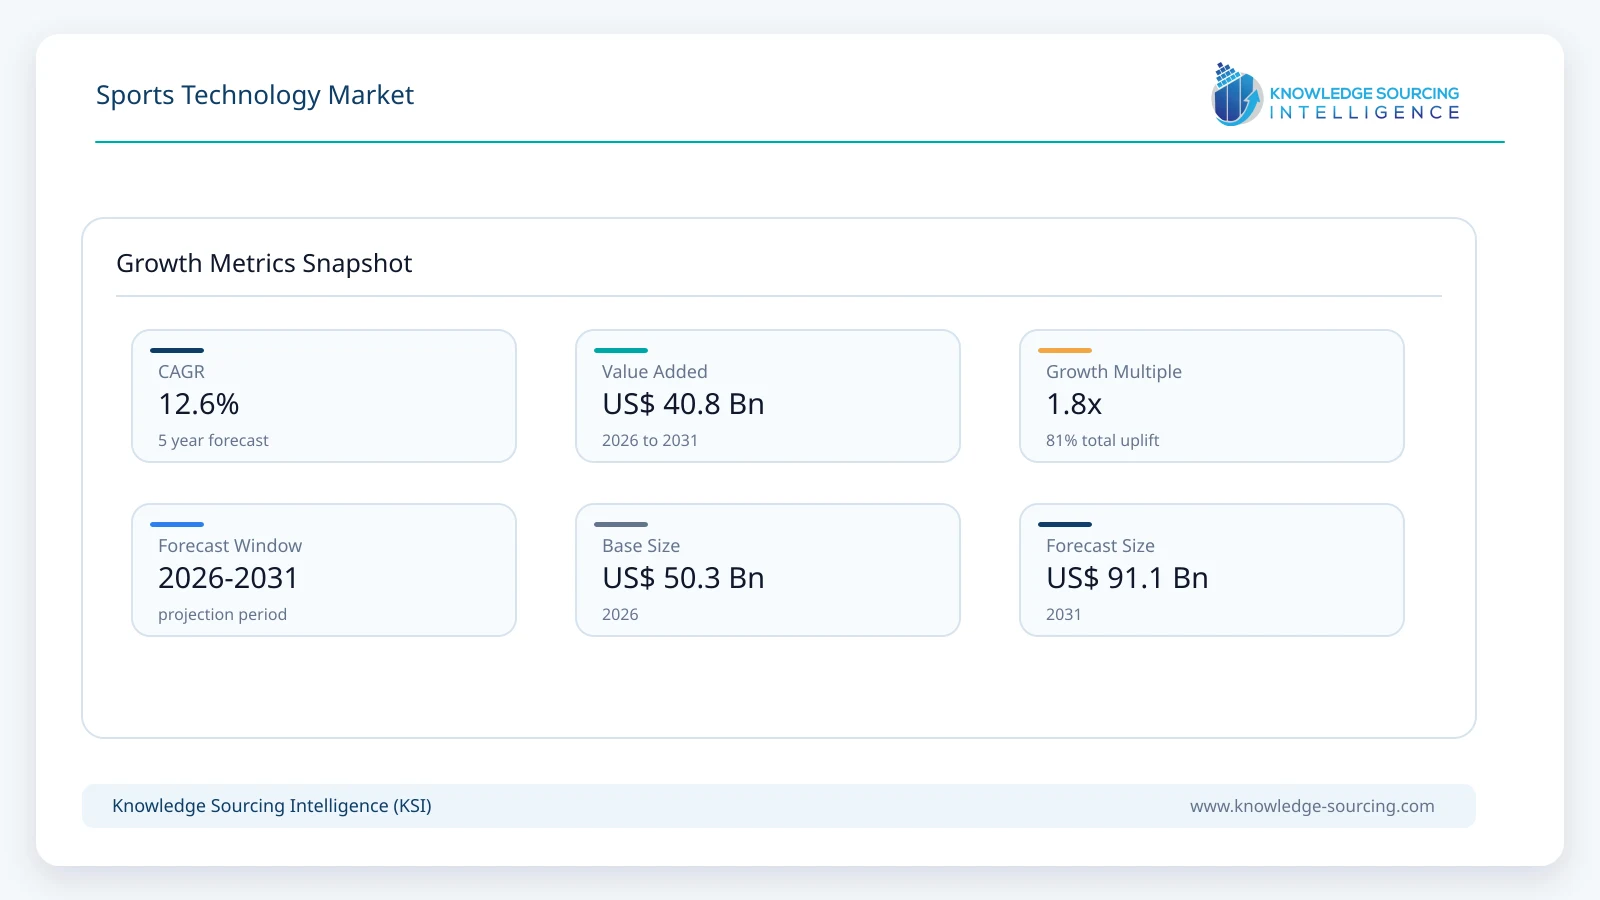
The sports technology market is forecast to grow from USD 50.3 billion in 2026 to USD 91.1 billion by 2031, representing a CAGR of approximately 12.6% during the forecast period.
Highlights:
- 1Sports analytics accounts for approximately 27% of global market value in 2026.
- 2Soccer represents approximately 38% of sports technology spending globally in 2026.
- 3Asia Pacific is projected to grow at approximately 14.7% annually through 2031.
- 4Smart stadium technology is projected to grow at approximately 14.7% annually through 2031.
- 5Europe contributes approximately USD 15.0 billion to the market in 2026.
- 6Catapult reported FY2026 revenue of USD 140.7 million, up 19% in constant currency.
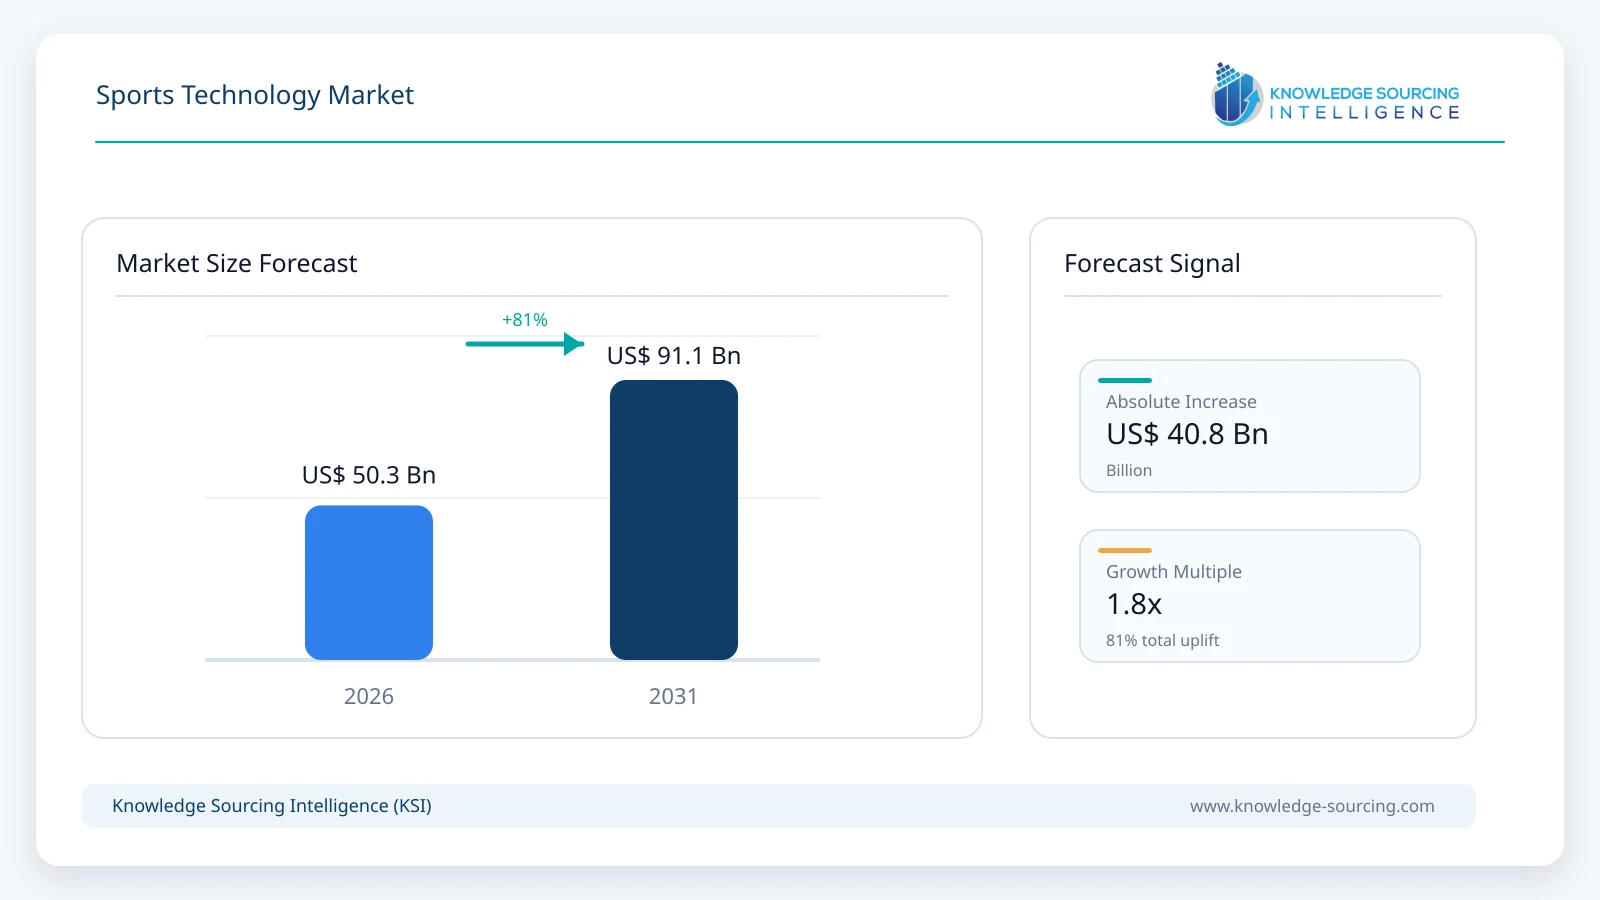
Sports technology involves the use and integration of software, connected equipment, analytics platforms, digital infrastructure and physical devices that improve athlete performance, officiating, venue operations and the viewing experience. The existing market structure covering wearable devices, digital signage, smart stadiums, sports analytics and services remains commercially relevant because technology investment now occurs across both sporting performance and the broader sports-entertainment ecosystem. The market is forecast to increase from USD 50.3 billion in 2026 to approximately USD 91.1 billion by 2031 as leagues, teams, stadium operators, broadcasters and technology partners increase spending on real-time data, connected venues, AI-enabled analysis and personalized digital experiences.
Professional sport increasingly generates data at a scale that was not technically or economically practical a decade ago. FIFA stated that the 2026 FIFA World Cup uses 16 optical tracking cameras in each of the tournament’s 16 stadiums, generating more than 150 million tracking data points per match. The technology supports semi-automated offside decisions, three-dimensional match reconstruction, media applications and the FIFA AI Pro analysis platform available to participating teams.
Fan-facing infrastructure is expanding at the same time. By the conclusion of the FIFA World Cup round of 16 in July 2026, FIFA reported more than 6.25 million spectators, 20 billion video views across its platforms, approximately 161,000 kilometres of fibre deployed and 13 petabytes of data transported through tournament and broadcast networks. Private 5G infrastructure across all 16 stadiums supports applications including referee-camera services. The scale illustrates why venue networking, cloud infrastructure, digital content delivery and real-time analytics are becoming integral parts of major sporting events rather than supplementary technology investments.
Commercial suppliers are also recording sustained growth. Catapult, which provides athlete monitoring, video analysis and performance technologies, reported FY2026 revenue of USD 140.7 million, increasing approximately 19% in constant currency, while annual contract value reached USD 133.8 million. Sportradar generated EUR 1.29 billion in 2025 revenue, up approximately 17%, including EUR 242 million from Sports Content, Technology & Services, which increased 22%. These results support continued expansion in professional analytics, performance technology and data commercialization.
Major Market Drivers
AI, Tracking and Analytics Are Becoming Core Competitive Infrastructure
Sports organizations are moving from basic performance measurement toward integrated data systems that support player recruitment, training, tactical analysis, injury-risk management, officiating and live media products. This creates demand not only for analytics software but also for tracking cameras, connected wearables, cloud infrastructure and professional services. FIFA’s deployment of Football AI Pro, AI-enabled 3D player avatars and advanced semi-automated offside technology during the 2026 World Cup demonstrates how computer vision and AI are becoming embedded directly into elite competition. Each tournament stadium uses 16 optical tracking cameras, and FIFA reports that more than 150 million tracking data points can be generated during a match.
The same transition is visible at club level. On June 29, 2026, Bayer 04 Leverkusen expanded its Stats Perform relationship to integrate Opta Vision across recruitment and match-analysis workflows. The system combines event and player-tracking data with AI-enriched metrics covering off-ball movement, phases of play, pressure intensity and tactical shape. Catapult’s FY2026 results also show continued professional adoption, with annual contract value increasing to USD 133.8 million and the company adding hundreds of professional teams during the year. Analytics therefore increasingly forms part of day-to-day sporting operations rather than a specialist function used only by the largest organizations.
Digital Fan Engagement and Connected Venues Are Expanding Technology Spending
Sports properties increasingly compete for audiences across broadcast television, streaming platforms, mobile applications, social media and venue experiences. Technology spending consequently extends from team performance into content delivery, audience personalization, connected stadiums, digital signage, real-time statistics and interactive media. IBM and Wimbledon introduced additional AI-powered fan experiences for the 2026 Championships, including Key Moments and an enhanced Match Chat that combines live data, historical information, photos and video within conversational responses. The partnership also modernized Wimbledon’s underlying digital platforms to serve global audiences.
The 2026 US Open provides another example. IBM and the USTA introduced an AI-based Serve Quality feature using 21 body-and-racquet data points tracked 50 times per second. IBM stated that the system was expected to generate approximately 1.2 billion data points across the tournament’s singles matches, while the USTA and IBM’s digital platforms serve more than 14 million global tennis fans annually. Large events are therefore becoming technology environments in which performance data is repurposed simultaneously for athletes, broadcasters, officials and fans.
Major Market Restraints
Athlete Data Privacy, Ownership and Governance
Greater use of biometric wearables, computer vision and AI increases the volume of sensitive athlete and consumer data collected by teams and technology providers. Performance systems can contain location, workload, physiological and health-related information, while connected venues process identity, payment and behavioural data. Sports organizations therefore need explicit controls covering access, storage, retention, consent and commercial use. Data-governance requirements become particularly demanding for multinational leagues whose athletes and supporters are subject to different privacy frameworks.
The issue is becoming more important as sports data is reused across multiple applications. The same positional information can support coaching, broadcasting, officiating and betting products, but contractual rights and permitted uses may differ between each channel. Technology suppliers need to demonstrate security and traceability while leagues and clubs increasingly negotiate ownership of data generated during competition. Compliance requirements can lengthen sales cycles and restrict how rapidly new AI or biometric products move from pilot programs into full commercial deployment.
Integration Cost and Fragmented Technology Infrastructure
Sports organizations frequently operate a combination of legacy stadium infrastructure, multiple analytics platforms, separate video systems, proprietary wearable formats and independent ticketing or fan-management applications. Adding new technology without connecting these systems can create additional data silos rather than operational improvement. Large venues also require networking, edge computing, cybersecurity, cameras, displays and physical installation alongside software subscriptions.
The financial barrier is particularly relevant outside top-tier professional leagues. Leading clubs can justify sophisticated systems through broadcast revenue, sponsorship and player-asset protection, while smaller teams and grassroots organizations have more limited technology budgets. Hardware prices are declining and cloud delivery is widening access, but implementation, training and integration remain significant costs. Suppliers able to offer interoperable platforms and lower-complexity deployment are consequently better positioned to expand sports technology beyond the elite professional market.
Sports Technology Market Trends
Computer Vision Is Expanding the Amount of Data Collected from Live Sport
Computer vision increasingly allows organizations to collect detailed performance information without requiring every athlete to wear a dedicated sensor. Stats Perform states that its current computer-vision systems can collect more than two million data points from an individual football match, providing a significantly deeper dataset than conventional event logging. FIFA’s World Cup deployment similarly combines multiple optical cameras with three-dimensional player models and AI-assisted analysis.
This expands the commercial usefulness of tracking data. Clubs can evaluate off-ball movement and tactical structure, broadcasters can create richer visualizations, and officials can access more precise spatial information. The integration of event and tracking datasets is also making analytics more valuable for recruitment because players can be evaluated on movement and positioning rather than only traditional actions such as shots, passes or tackles.
Generative AI Is Moving Into Fan-Facing Sports Products
Generative AI is increasingly being used to convert large sports datasets into explanations, summaries and personalized digital experiences. Wimbledon expanded its AI functionality in 2026 through conversational Match Chat and Key Moments, while the US Open introduced similar personalized tools together with AI-derived serve analysis.
The significance lies in reducing the gap between raw statistics and usable content. Sports organizations can automatically convert live information into narratives, highlights, insights and interactive questions without manually producing every piece of content. This makes deeper data economically useful to a much larger audience and increases demand for AI platforms, structured sports data and cloud infrastructure.
Official Data Rights Are Becoming More Valuable Technology Assets
Live sports data is becoming a commercial product in its own right as broadcasters, digital media companies and regulated sportsbooks require accurate low-latency feeds. FIFA selected Stats Perform on January 12, 2026 as its first official worldwide betting-data and betting-streaming distributor. The agreement covers all 104 FIFA World Cup 2026 matches and multiple FIFA competitions through 2029.
Sportradar’s financial performance similarly demonstrates demand for sports data and related technologies. The company generated EUR 1.29 billion in 2025 revenue, with Sports Content, Technology & Services revenue increasing 22% to EUR 242 million. Rights holders therefore increasingly evaluate technology not only as an operating cost but also as infrastructure for monetizing official data and digital content.
Technology Is Extending Beyond Elite Teams
Professional teams remain the highest-value customers for advanced performance systems, but lower hardware costs, cloud software and automated video analysis are making technology accessible to smaller organizations. Catapult’s strategy increasingly combines athlete monitoring, video, scouting and content solutions across a wider professional-team base, while vendors are simplifying deployment and moving more functions into subscription software.
This broadens the addressable market from major leagues toward academies, collegiate programs, semi-professional teams and specialized training organizations. The transition is gradual because budgets remain materially lower outside elite sport, but recurring software models reduce the need for large upfront IT investments.
Sports Technology Market Segmentation Analysis
By Type
Sports Analytics
Sports analytics accounts for approximately 27% of global sports technology market value in 2026, making it the largest modeled type. The segment includes performance analysis, scouting and recruitment platforms, tactical analytics, official data systems, video intelligence and AI-enabled decision-support tools.
Analytics is projected to reach approximately 29% of global market value by 2031 as computer vision and AI increase the amount of data available from sporting events and improve its practical use. Growth is particularly strong where analytics is integrated directly into coaching and operational workflows rather than provided as standalone statistics. FIFA’s deployment of Football AI Pro and Bayer Leverkusen’s integration of Opta Vision demonstrate this shift toward combined event, tracking and AI-generated insight.
By Sport
Soccer
Soccer accounts for approximately 38% of sports technology market value in 2026, making it the largest sport-specific demand segment. Its position reflects the global scale of professional football, large media-rights values and extensive technology use across officiating, player monitoring, scouting, tactical analysis, ticketing, venue operations and fan engagement.
The 2026 FIFA World Cup demonstrates the intensity of technology use at the highest level. Advanced semi-automated offside technology, AI-enabled player models, referee cameras, private 5G networks and Football AI Pro are being used alongside extensive digital and broadcast infrastructure. FIFA reported that the tournament’s 16 stadiums were supported by more than 100,000 miles of fibre and approximately 4,000 network devices. Soccer remains the largest sports technology segment through 2031, while cricket and basketball also expand strongly as professional leagues increase investment in tracking, officiating and fan platforms.
By Geography
North America
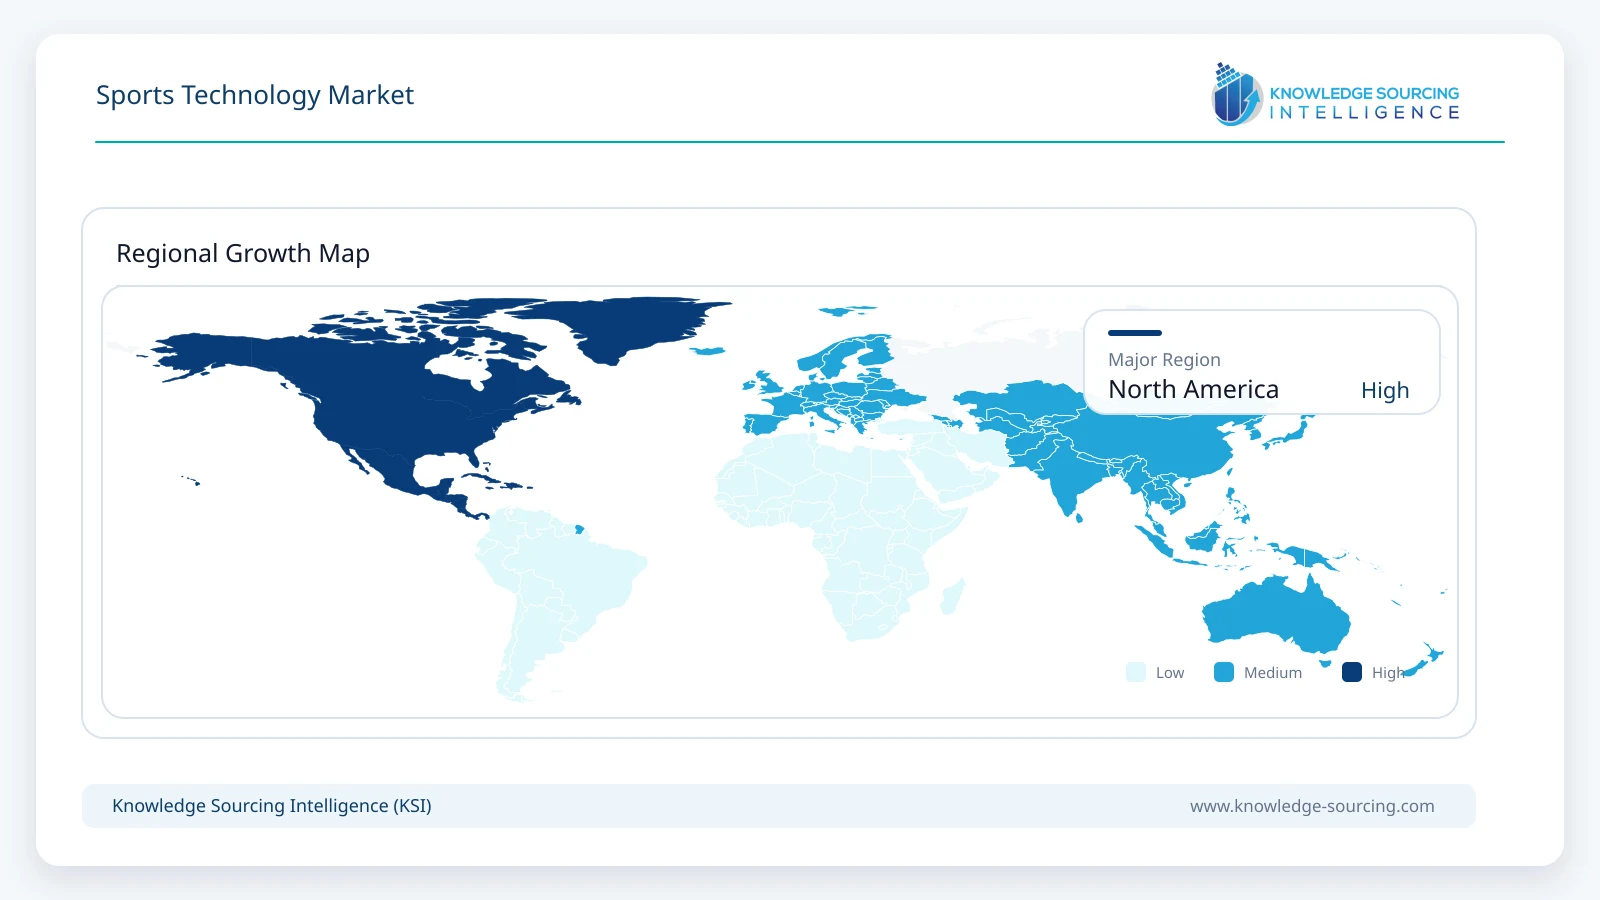
North America accounts for approximately 34% of the global sports technology market in 2026, making it the largest regional market. The region combines major professional leagues, collegiate athletics, large venue investments, sports media companies and a mature technology ecosystem. Teams across American football, basketball, baseball, ice hockey and soccer use performance systems, automated video, analytics and connected venue technologies extensively.
The region also provides a strong commercialization environment for sports data and AI. Genius Sports works with organizations including the NFL and NCAA and reported total revenue of USD 669.5 million in 2025, an increase of 31%, while its media technology revenue increased 37%. By Q2 2026, the company had raised full-year group revenue guidance to more than USD 1.0 billion following continued expansion and acquisitions.
North America remains the largest regional market through 2031, although Asia Pacific gains share faster as professional sports investment, digital viewing and venue development expand across China, India, Japan, South Korea and Australia.
Competitive Landscape
The sports technology market includes specialized performance-technology companies, sports-data suppliers and global enterprise technology providers. Catapult competes across athlete monitoring, video analysis and scouting, while Stats Perform, Sportradar and Genius Sports occupy important positions in official data, AI, media technology and sports intelligence. IBM, Cisco, SAP and Oracle participate through cloud, AI, connectivity, analytics and venue technology, while Sony’s Hawk-Eye Innovations is closely associated with tracking and officiating systems.
Competition increasingly depends on ownership or access to proprietary datasets, integration across multiple use cases and the ability to convert real-time information into operational decisions. Specialized vendors retain an advantage through sport-specific products and workflows, while larger enterprise technology providers contribute infrastructure and AI capabilities that can scale across global events.
Recurring software and data contracts are also changing competitive economics. Catapult’s FY2026 annual contract value increased to USD 133.8 million, while Genius Sports and Sportradar continue expanding through long-term rights and technology agreements. Vendors with deeply embedded products can increase revenue through additional analytics, video, scouting and fan-engagement modules rather than continually acquiring entirely new customers.
Recent Developments
August 2026: IBM and the USTA introduced new AI-powered features for the 2026 US Open, including Serve Quality, Key Moments and an enhanced Match Chat experience. Serve Quality tracks 21 body-and-racquet data points 50 times per second and is expected to generate approximately 1.2 billion data points during the tournament.
July 2026: Catapult launched IMPECT Video Scouting, extending its football scouting and video-analysis capabilities following the integration of IMPECT into its product portfolio.
June 2026: FIFA detailed the deployment of Referee View, AI-enabled Player Avatars and FIFA AI Pro at the 2026 World Cup through its technology partnership with Lenovo.
June 2026: Bayer 04 Leverkusen expanded its Stats Perform partnership to integrate Opta Vision into recruitment and match-analysis workflows.
June 2026: Wimbledon and IBM launched enhanced AI-powered fan experiences and modernized digital platforms for the 2026 Championships.
January 2026: FIFA selected Stats Perform as its first official worldwide betting-data and betting-streaming distributor, including exclusive rights covering all 104 matches of the FIFA World Cup 2026.
Market Outlook
The sports technology market is expected to expand supported by greater professional use of performance analytics, computer vision and connected wearables. This growth is also being complemented by continuing investment in digital fan engagement, stadium infrastructure and official sports data.
Sports analytics gains market share as artificial intelligence converts larger tracking datasets into tactical, recruitment and media applications. Smart-stadium investment also grows faster than the overall market as venue operators upgrade connectivity, security, digital signage and fan services. Wearable technology continues expanding in absolute value but grows more gradually as the professional segment becomes established.
Soccer remains the largest sport-specific market throughout the forecast period, supported by global league economics and extensive technology deployment. Asia Pacific records the fastest regional growth, while North America remains the largest market in 2031.
Sports Technology Market Scope:
| Report Metric | Details |
|---|---|
| Total Market Size in 2026 | USD 50.3 billion in 2026 |
| Total Market Size in 2031 | USD 91.1 billion by 2031 |
| Forecast Unit | Billion |
| Growth Rate | 12.6% |
| Study Period | 2021 to 2031 |
| Historical Data | 2021 to 2024 |
| Base Year | 2025 |
| Forecast Period | 2026 – 2031 |
| Segmentation | Technological Outlook, Type, Sports, Geography |
| Companies |
|
Market Segmentation
By Technological Outlook
Artificial Intelligence and Machine Learning
Computer Vision and Optical Tracking
Wearable Sensors and Athlete Monitoring
Internet of Things
Cloud and Edge Computing
Private 5G and Venue Connectivity
Augmented and Virtual Reality
Generative AI for Fan Engagement and Content
By Type
Wearable Devices
Digital Signage
Smart Stadium
Sports Analytics
Services
By Sports
Soccer
Basketball
Tennis
Cricket
Others
By Geography
North America
By Type
By Sports
By Country
United States
Canada
Mexico
South America
By Type
By Sports
By Country
Brazil
Argentina
Others
Europe
By Type
By Sports
By Country
Germany
France
United Kingdom
Spain
Italy
Others
Middle East and Africa
By Type
By Sports
By Country
Saudi Arabia
UAE
South Africa
Others
Asia Pacific
By Type
By Sports
By Country
China
India
Japan
South Korea
Australia
Others
Table of Contents
1. INTRODUCTION
1.1. Market Overview
1.2. Market Definition
1.3. Scope of the Study
1.4. Market Segmentation
1.5. Currency
1.6. Assumptions
1.7. Base and Forecast Years Timeline
1.8. Key Benefits for Stakeholders
2. RESEARCH METHODOLOGY
2.1. Research Design
2.2. Research Process
2.3. Primary Research Framework
2.4. Secondary Research Framework
2.5. Data Triangulation
2.6. Forecast Methodology
3. EXECUTIVE SUMMARY
3.1. Key Findings
3.2. Analyst View
4. MARKET DYNAMICS
4.1. Market Drivers
4.1.1. AI, Computer Vision and Tracking Becoming Core Performance Infrastructure
4.1.2. Connected Stadium and Digital Fan-Engagement Investment
4.1.3. Commercialization of Official Sports Data and Real-Time Content
4.1.4. Wider Adoption of Professional Technology Across Lower-Tier Sports Organizations
4.2. Market Restraints
4.2.1. Athlete Biometric Data Privacy, Ownership and Commercial-Use Restrictions
4.2.2. High Venue Integration Cost and Fragmented Legacy Infrastructure
4.2.3. Lack of Interoperability Across Wearable, Video and Analytics Platforms
4.2.4. Limited Technology Budgets Across Grassroots and Smaller Professional Organizations
4.3. Market Opportunities
4.4. Porter’s Five Forces Analysis
4.4.1. Bargaining Power of Suppliers
4.4.2. Bargaining Power of Buyers
4.4.3. Threat of New Entrants
4.4.4. Threat of Substitutes
4.4.5. Competitive Rivalry in the Industry
4.5. Industry Value Chain Analysis
4.6. Strategic Recommendations
5. TECHNOLOGICAL OUTLOOK
5.1. Artificial Intelligence and Machine Learning
5.2. Computer Vision and Optical Tracking
5.3. Wearable Sensors and Athlete Monitoring
5.4. Internet of Things
5.5. Cloud and Edge Computing
5.6. Private 5G and Venue Connectivity
5.7. Augmented and Virtual Reality
5.8. Generative AI for Fan Engagement and Content
6. SPORTS TECHNOLOGY MARKET BY TYPE
6.1. Introduction
6.2. Wearable Devices
6.3. Digital Signage
6.4. Smart Stadium
6.5. Sports Analytics
6.6. Services
7. SPORTS TECHNOLOGY MARKET BY SPORTS
7.1. Introduction
7.2. Soccer
7.3. Basketball
7.4. Tennis
7.5. Cricket
7.6. Others
8. SPORTS TECHNOLOGY MARKET BY GEOGRAPHY
8.1. North America
8.1.1. By Type
8.1.2. By Sports
8.1.3. By Country
8.1.3.1. United States
8.1.3.2. Canada
8.1.3.3. Mexico
8.2. South America
8.2.1. By Type
8.2.2. By Sports
8.2.3. By Country
8.2.3.1. Brazil
8.2.3.2. Argentina
8.2.3.3. Others
8.3. Europe
8.3.1. By Type
8.3.2. By Sports
8.3.3. By Country
8.3.3.1. Germany
8.3.3.2. France
8.3.3.3. United Kingdom
8.3.3.4. Spain
8.3.3.5. Italy
8.3.3.6. Others
8.4. Middle East and Africa
8.4.1. By Type
8.4.2. By Sports
8.4.3. By Country
8.4.3.1. Saudi Arabia
8.4.3.2. UAE
8.4.3.3. South Africa
8.4.3.4. Others
8.5. Asia Pacific
8.5.1. By Type
8.5.2. By Sports
8.5.3. By Country
8.5.3.1. China
8.5.3.2. India
8.5.3.3. Japan
8.5.3.4. South Korea
8.5.3.5. Australia
8.5.3.6. Others
9. COMPETITIVE ENVIRONMENT AND ANALYSIS
9.1. Major Players and Strategy Analysis
9.2. Market Share Analysis
9.3. Mergers, Acquisitions, Agreements and Collaborations
9.4. Competitive Dashboard
10. COMPANY PROFILES
10.1. Catapult Sports Ltd.
10.2. Stats Perform
10.3. Sportradar AG
10.4. Genius Sports Limited
10.5. IBM Corporation
10.6. Cisco Systems, Inc.
10.7. SAP SE
10.8. Oracle Corporation
10.9. Sony Group Corporation
10.10. WHOOP, Inc.
10.11. KINEXON Sports & Media GmbH
10.12. Fujitsu Limited
11. APPENDIX
Navigate
Trusted by the world's leading organizations











