Report Overview
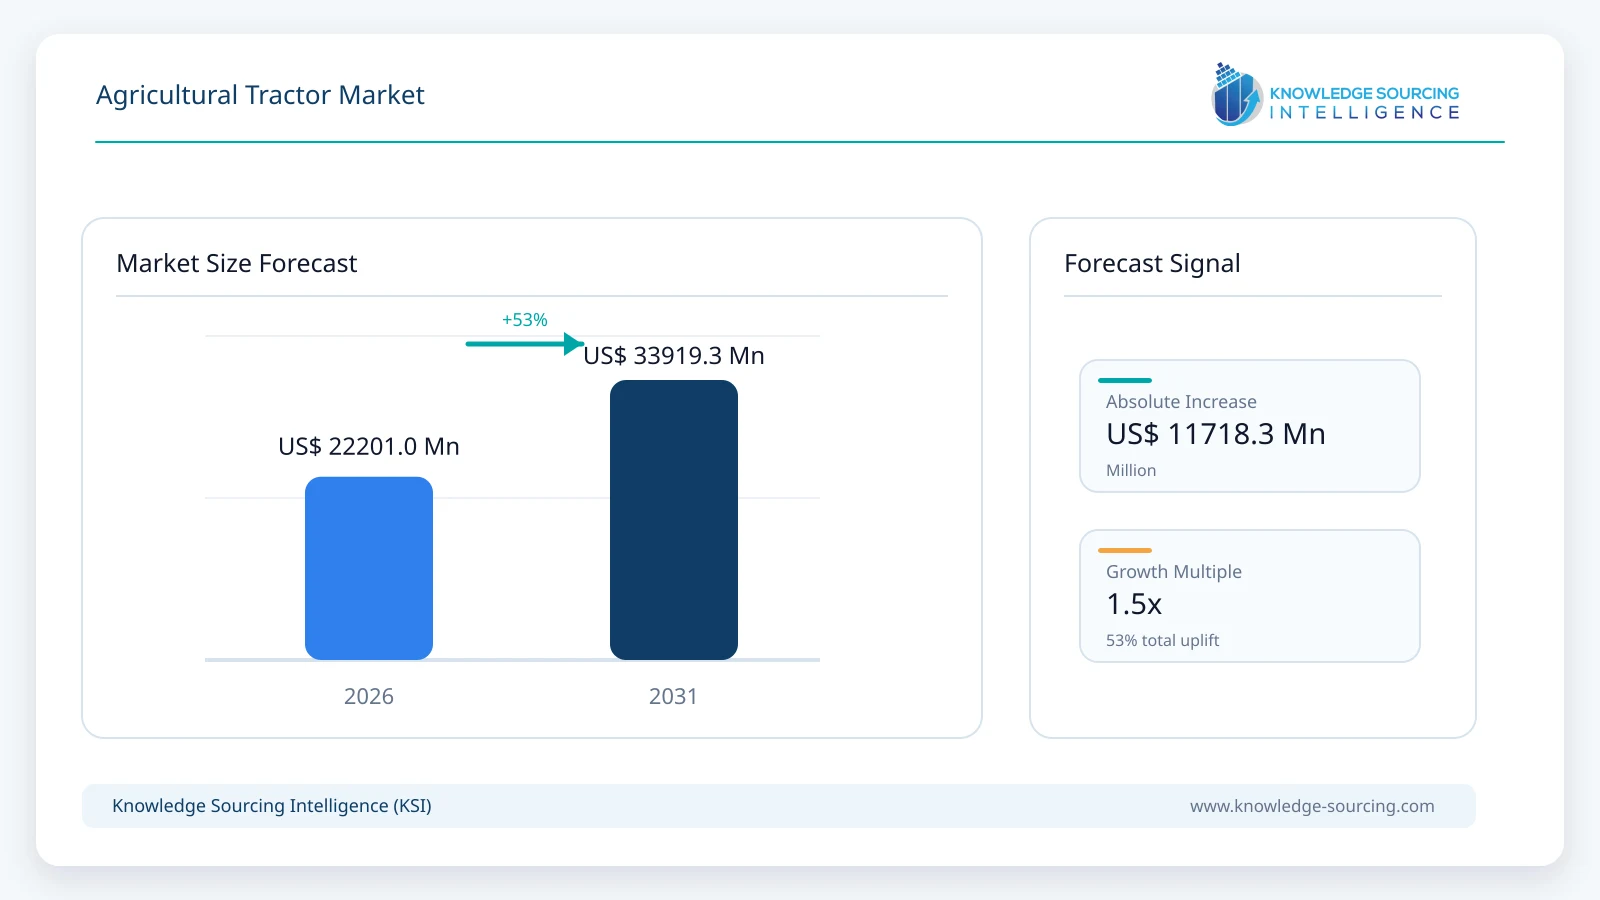
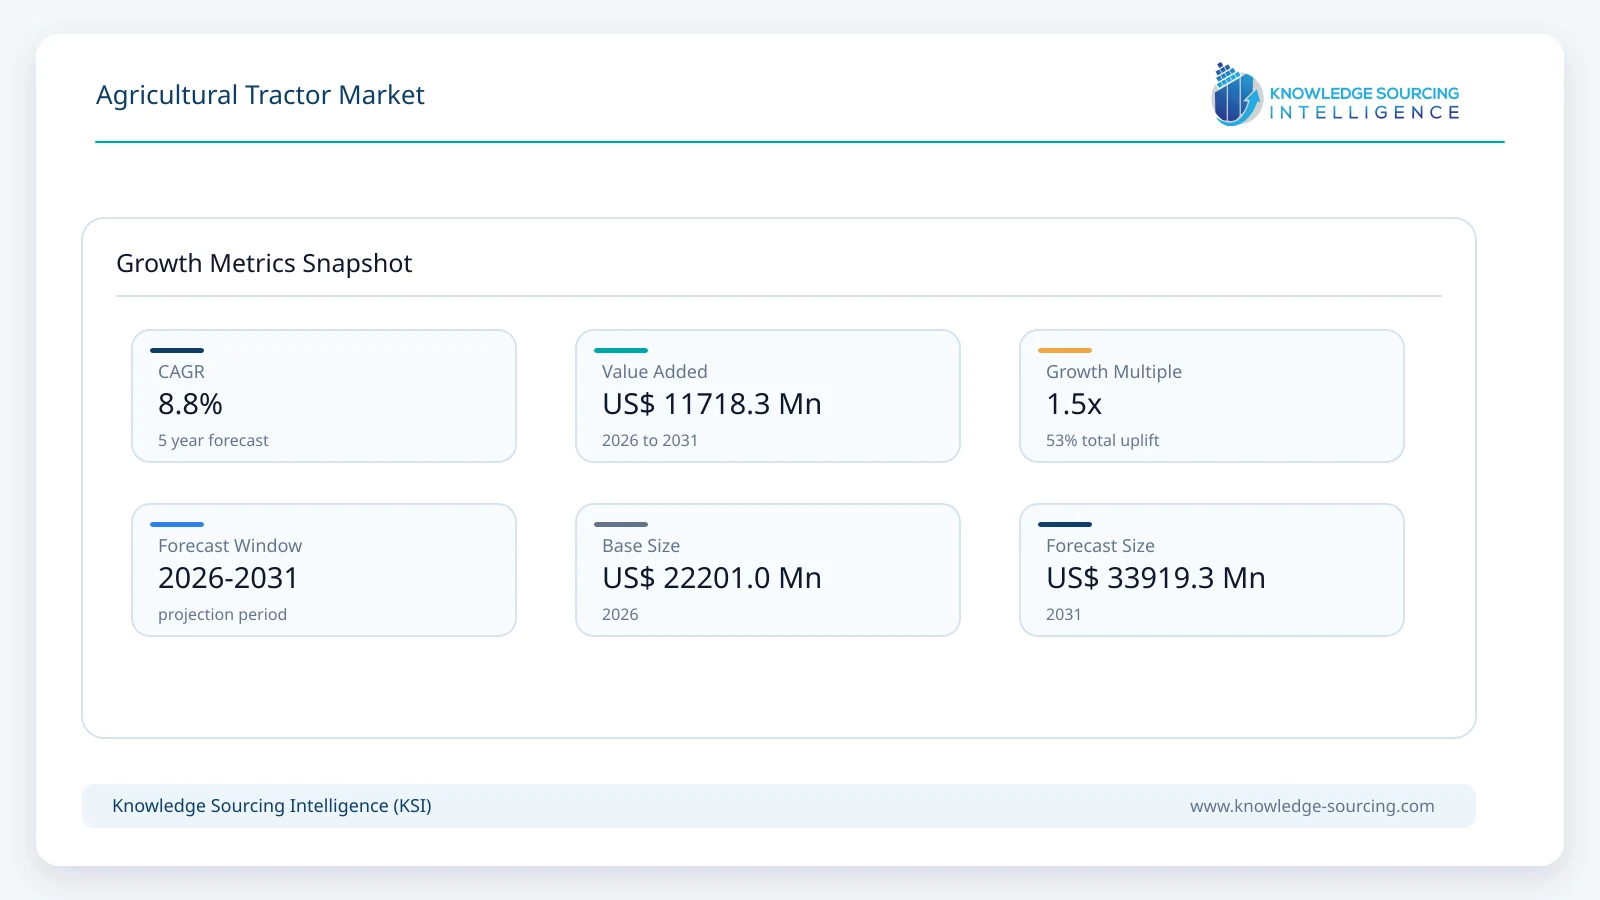
The Agricultural Tractor Market is forecast to grow at a CAGR of 8.85%, reaching USD 33,919.25 million in 2031 from USD 22,200.97 million in 2026.
Highlights:
- 1Increasing farm mechanizationis driving demand for agricultural tractors across the Asia-Pacific.
- 2Growing technological advancementsare enhancing tractor efficiency and reducing emissions.
- 3Rising small-scale farmingis boosting demand for less than 40 HP tractors.
- 4Expanding government subsidiesare promoting tractor adoption in agricultural economies.
The market for agricultural tractors is growing due to the increase in precision farming and the growing demand for agricultural farm equipment, including agricultural tractors. Also, the government’s rising support for farm mechanization, through subsidies, incentives, and assistance for purchasing agricultural equipment, is significantly boosting agricultural tractor production. Moreover, the continuous technological advancements in tractor manufacturing enhance the efficiency of tractors, driving the growth of the agricultural tractor market by improving the performance and capabilities of these machines.
The global agricultural tractor market refers to the production and sales of agricultural tractors and related products like accessories, attachments, and parts of agricultural tractors, like engines. The market consists of various types of engines, such as less than 40 HP engines, between 41 HP to 100 HP, and more than 100 HP tractors for farms such as small and fragmented farms, mid-sized farms, and large farms. It is sold for its application in farming, livestock farming, specialized farming such as orchards, horticulture, growers, etc. The market consists of utility tractors, row crop tractors, orchard tractors, and other types of tractors. The market is dominated by manual tractors, particularly in regions of the Asia-Pacific, while autonomous tractors are significantly in demand in developed countries.
Agricultural Tractor Market Growth Drivers:
Increasing farm mechanization is driving market growth
There is a substantial rise in the demand for agricultural equipment, including agricultural tractors. The growing precision farming is giving a major boost to the use of agricultural technologies. The use of advanced technologies such as GPS, automated steering systems, sensors, and many others is significantly benefiting agriculture, driving demand for agricultural tractors.
Also, the government’s increasing support for creating awareness among farmers for using agricultural tractors is driving the growth of the market. This increasing demand is evident from the data released by the Tractor and Mechanization Association, stating that the total retail sales in India increased from 125,418 in October 2023 to 151,772 in October 2024. Thus, the increasing farm mechanization, along with continued government support, will be driving the market growth.
Technological advancement is boosting the market
The growing technological advancements in the agricultural tractor market are offering a boost to market growth. The growing use of sensors, geo-mapping, remote sensing, automated steering, and high-powered engines is offering efficiency in the usage of agricultural tractors. For example, Kubota Corporation’s Grand L60’s engine lineup is redesigned for clearer emissions and to offer economical fuel. The company employed direct rail injection to save fuel. It also combines a Diesel Particulate Filter (DPF) Muffler and Exhaust Gas recirculation system (EGR) to reduce emissions. This highlights that technological development is a key area to be focused on.
Agricultural Tractor Market Segment Analysis:
By engine power, the “Less than 40 HP” tractor will grow significantly
The agricultural tractor market based on engine power is segmented into less than 40 HP, 41 HP to 100 HPand More than 100 HP. During the forecast period, the “less than 40 HP” tractor will grow significantly.
The market for less than 40 HP tractors will be driven by demand from small to medium-sized farms. Expanding small-scale gardeners, orchard growers, hobby growers, and livestock farmers will offer a boost to the market demand. The rising small landholding due to the growing population is the major factor boosting its market demand, as less than 40 HP agricultural tractors are best suited for small and fragmented landholdings.
Additionally, stringent government regulations aimed at reducing carbon emissions are providing a substantial boost to the market, encouraging the adoption of these environmentally friendly products. Moreover, the major factor that drives this dominance is the growing prevalence of small and fragmented land holdings, particularly in the Asia-Pacific region.
Agricultural Tractor Market Geographical Outlook:
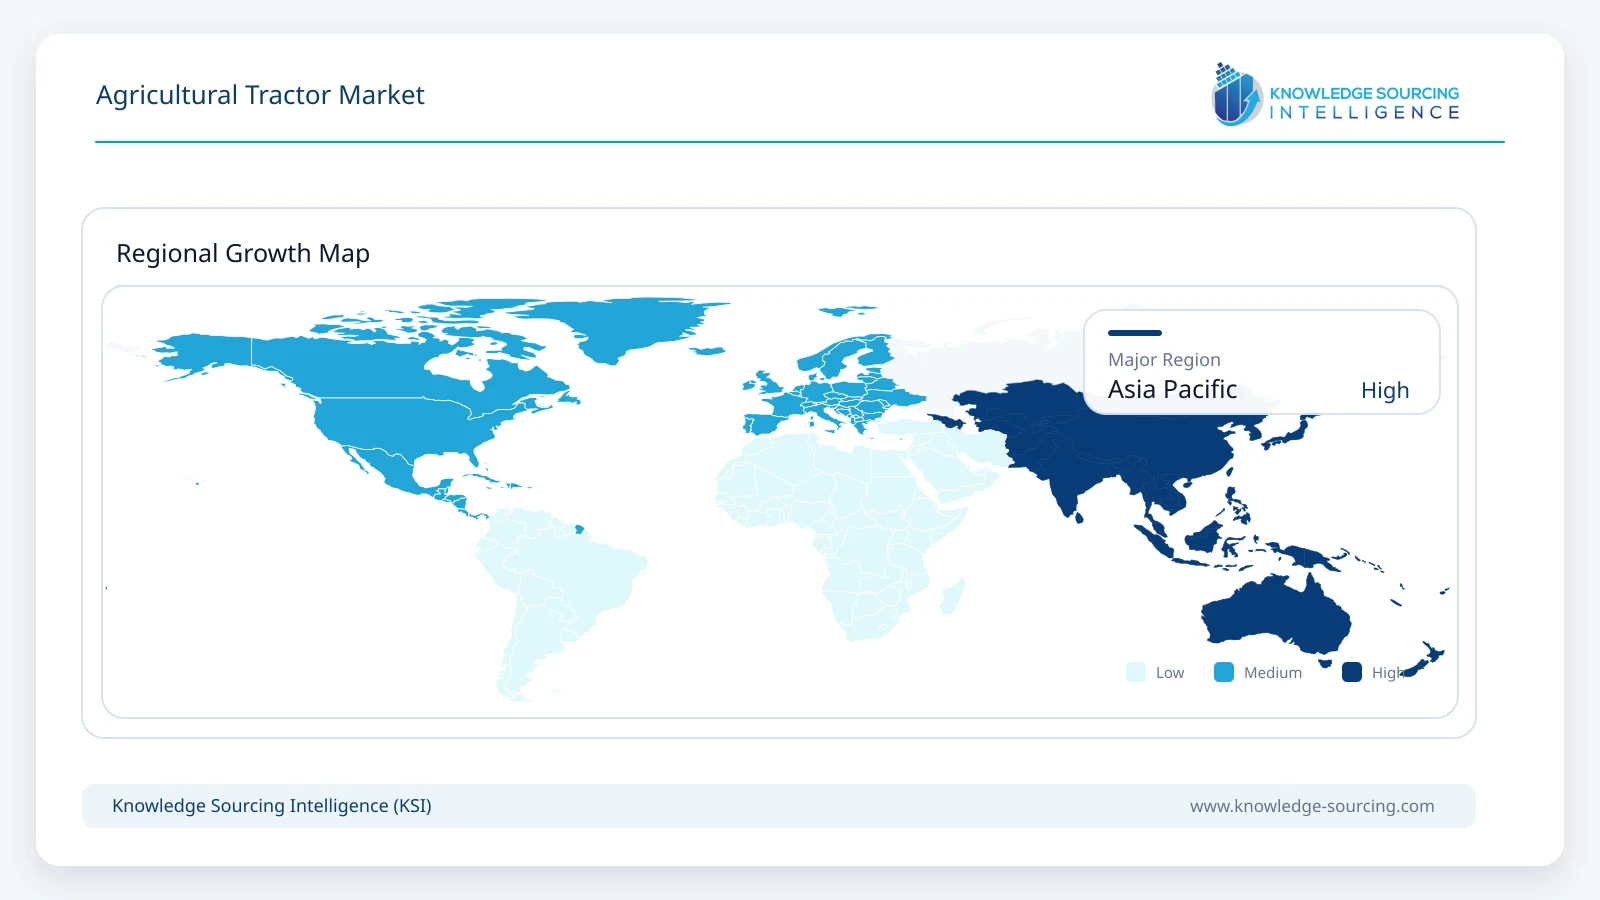
Asia-Pacific market will be the fastest-growing market
Based on Geography, the Asia-Pacific market is estimated to grow at the fastest rate during the forecast period. The market will be driven by growing agricultural economies such as India and other economies like China, Japan, etc., where the demand for agricultural tractors is high. Also, the growing mechanization and government support will be driving the market. For example, India is one of the leading global economies where agriculture plays a major role in GDP contribution, and with the rapid population growth, the food demand and consumption scale have witnessed a significant jump in the nation.
On the other hand, the North American and European markets will hold a significant share of the market. The prevalence of large-scale farming, along with rising technological advancements, will be driving the region’s growth.
Agricultural Tractor Market Recent Developments:
March 2026: John Deere launched six redesigned 8R and 8RX Series tractors at Commodity Classic 2026, introducing models up to 540 HP with Intelligent Power Management and enhanced precision agriculture technologies, including AutoTrac™, AutoPath™, and JDLink™ Boost.
February 2026: AGCO Corporation announced that its Fendt, Massey Ferguson, and PTx brands would showcase new tractor technologies, precision farming solutions, and autonomous farming innovations during Commodity Classic 2026, highlighting next-generation productivity-focused equipment.
List of Top Agricultural Tractor Companies:
Mahindra & Mahindra Limited
Deere & Company
Tractors and Farm Equipment Limited (TAFE)
CNH Industrial N.V.
Kubota Corporation
AGCO Corporation
Escorts Kubota Limited
Agricultural Tractor Market Scope
| Report Metric | Details |
|---|---|
| Total Market Size in 2026 | USD 22,200.97 million |
| Total Market Size in 2031 | USD 33,919.25 million |
| Forecast Unit | Million |
| Growth Rate | 8.85% |
| Study Period | 2021 to 2031 |
| Historical Data | 2021 to 2024 |
| Base Year | 2025 |
| Forecast Period | 2026 – 2031 |
| Segmentation | Engine Power, Type, Vehicle Type, Mode of Operation, Geography |
| Geographical Segmentation | North America, South America, Europe, Middle East and Africa, Asia Pacific |
| Companies |
|
Market Segmentation
By Engine Power
- Less than 40 HP
- 41 HP to 100 HP
- More than 100 HP
By Type
- Utility Tractors
- Row Crop Tractors
- Orchard Type
- Other Tractors
By Vehicle Type
- Gasoline and Diesel
- Electric
By Mode of Operation
- Manual Tractor
- Autonomous
By Geography
- North America
- USA
- Canada
- Mexico
- South America
- Brazil
- Argentina
- Others
- Europe
- United Kingdom
- Germany
- France
- Spain
- Others
- Middle East and Africa
- Saudi Arabia
- UAE
- Others
- Asia Pacific
- China
- Japan
- South Korea
- Australia
- India
- Indonesia
- Thailand
- Others
Geographical Segmentation
North America, South America, Europe, Middle East and Africa, Asia Pacific
Table of Contents
1. INTRODUCTION
1.1. Market Overview
1.2. Market Definition
1.3. Scope of the Study
1.4. Market Segmentation
1.5. Currency
1.6. Assumptions
1.7. Base and Forecast Years Timeline
1.8. Key Benefits to the Stakeholder
2. RESEARCH METHODOLOGY  
2.1. Research Design
2.2. Research Processes
3. EXECUTIVE SUMMARY
3.1. Key Findings
3.2. CXO Perspective
4. MARKET DYNAMICS
4.1. Market Drivers
4.2. Market Restraints
4.3. Porter’s Five Forces Analysis
4.3.1. Bargaining Power of Suppliers
4.3.2. Bargaining Power of Buyers
4.3.3. Threat of New Entrants
4.3.4. Threat of Substitutes
4.3.5. Competitive Rivalry in the Industry
4.4. Industry Value Chain Analysis
4.5. Analyst View
5. AGRICULTURAL TRACTOR MARKET BY ENGINE POWER
5.1. Introduction
5.2. Less than 40 HP
5.3. 41 HP to 100 HP
5.4. More than 100 HP
6. AGRICULTURAL TRACTOR MARKET BY TYPE
6.1. Introduction
6.2. Utility Tractors
6.3. Row Crop Tractors
6.4. Orchard Type
6.5. Other Tractors
7. AGRICULTURAL TRACTOR MARKET BY VEHICLE TYPE
7.1. Introduction
7.2. Gasoline and Diesel
7.3. Electric
8. AGRICULTURAL TRACTOR MARKET BY MODE OF OPERATION
8.1. Introduction
8.2. Manual Tractor
8.3. Autonomous
9. AGRICULTURAL TRACTOR MARKET BY GEOGRAPHY
9.1. Introduction
9.2. North America
9.2.1. By Engine Power
9.2.2. By Type
9.2.3. By Vehicle Type
9.2.4. By Mode of Operation
9.2.5. By Country
9.2.5.1. USA
9.2.5.2. Canada
9.2.5.3. Mexico
9.3. South America
9.3.1. By Engine Power
9.3.2. By Type
9.3.3. By Vehicle Type
9.3.4. By Mode of Operation
9.3.5. By Country
9.3.5.1. Brazil
9.3.5.2. Argentina
9.3.5.3. Others
9.4. Europe
9.4.1. By Engine Power
9.4.2. By Type
9.4.3. By Vehicle Type
9.4.4. By Mode of Operation
9.4.5. By Country
9.4.5.1. United Kingdom
9.4.5.2. Germany
9.4.5.3. France
9.4.5.4. Spain
9.4.5.5. Others
9.5. Middle East and Africa
9.5.1. By Engine Power
9.5.2. By Type
9.5.3. By Vehicle Type
9.5.4. By Mode of Operation
9.5.5. By Country
9.5.5.1. Saudi Arabia
9.5.5.2. UAE
9.5.5.3. Others
9.6. Asia Pacific
9.6.1. By Engine Power
9.6.2. By Type
9.6.3. By Vehicle Type
9.6.4. By Mode of Operation
9.6.5. By Country
9.6.5.1. China
9.6.5.2. Japan
9.6.5.3. South Korea
9.6.5.4. Australia
9.6.5.5. India
9.6.5.6. Indonesia
9.6.5.7. Thailand
9.6.5.8. Others
10. COMPETITIVE ENVIRONMENT AND ANALYSIS
10.1. Major Players and Strategy Analysis
10.2. Market Share Analysis
10.3. Mergers, Acquisitions, Agreements, and Collaborations
10.4. Competitive Dashboard
11. COMPANY PROFILES
11.1. Mahindra & Mahindra Limited
11.2. Deere & Company
11.3. Tractors and Farm Equipment Limited (TAFE)
11.4. CNH Industrial N.V.
11.5. Kubota Corporation
11.6. AGCO Corporation
11.7. Escorts Kubota Limited
11.8. CLAAS KGaA mbH
11.9. Yanmar Holdings Co., Ltd.
11.10. SDF Group (Same Deutz-Fahr)
11.11. International Tractors Limited (Sonalika)
Navigate
Trusted by the world's leading organizations


