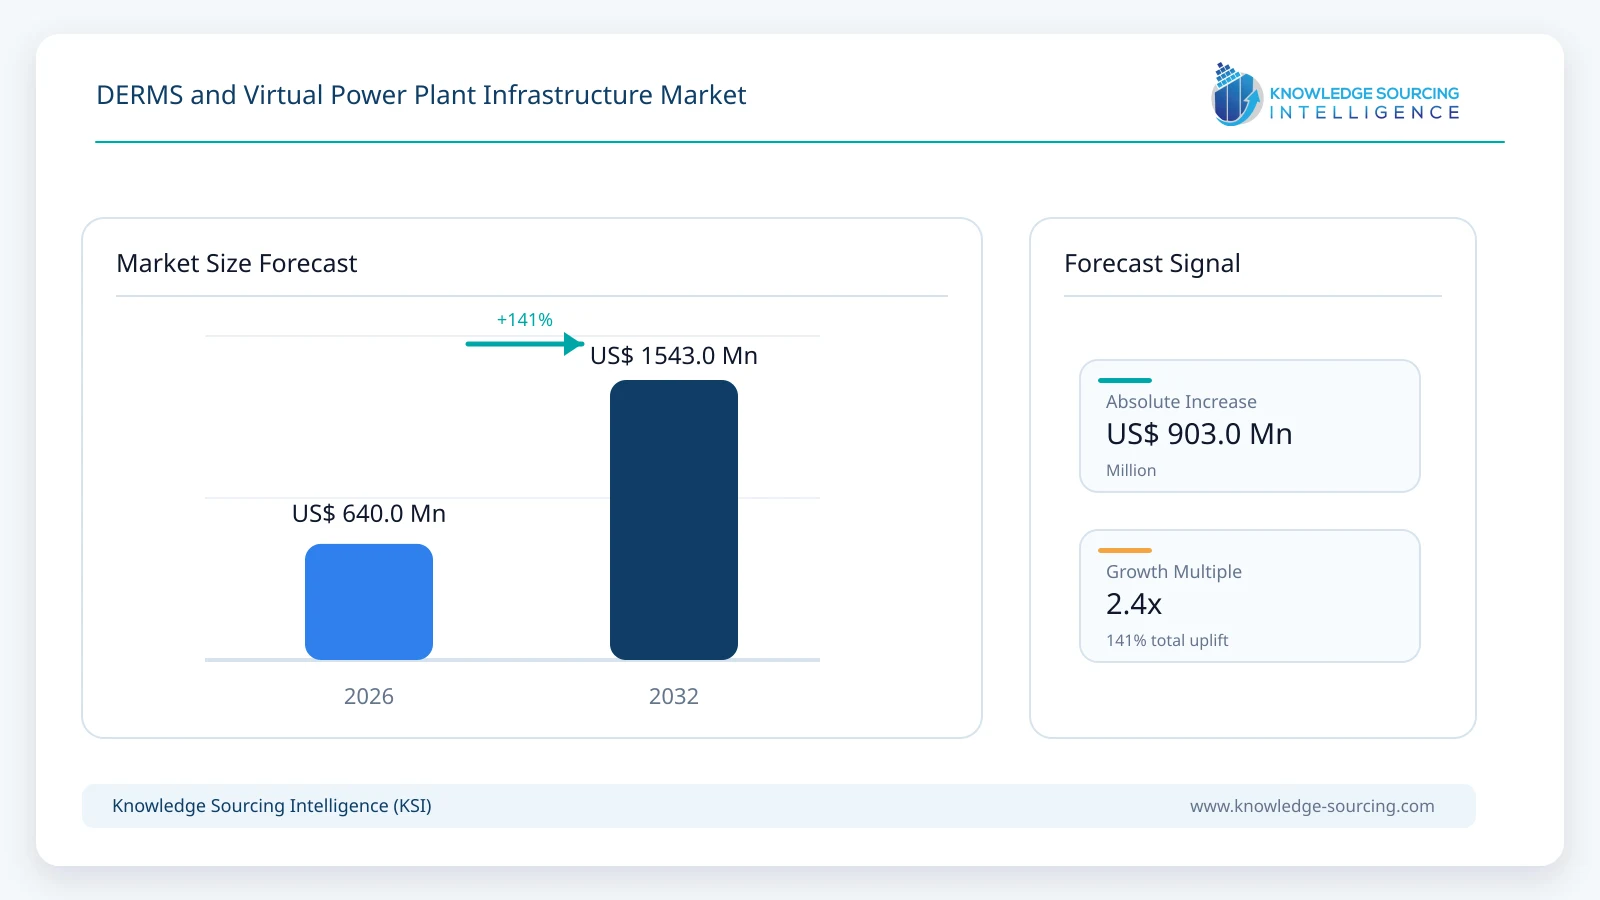
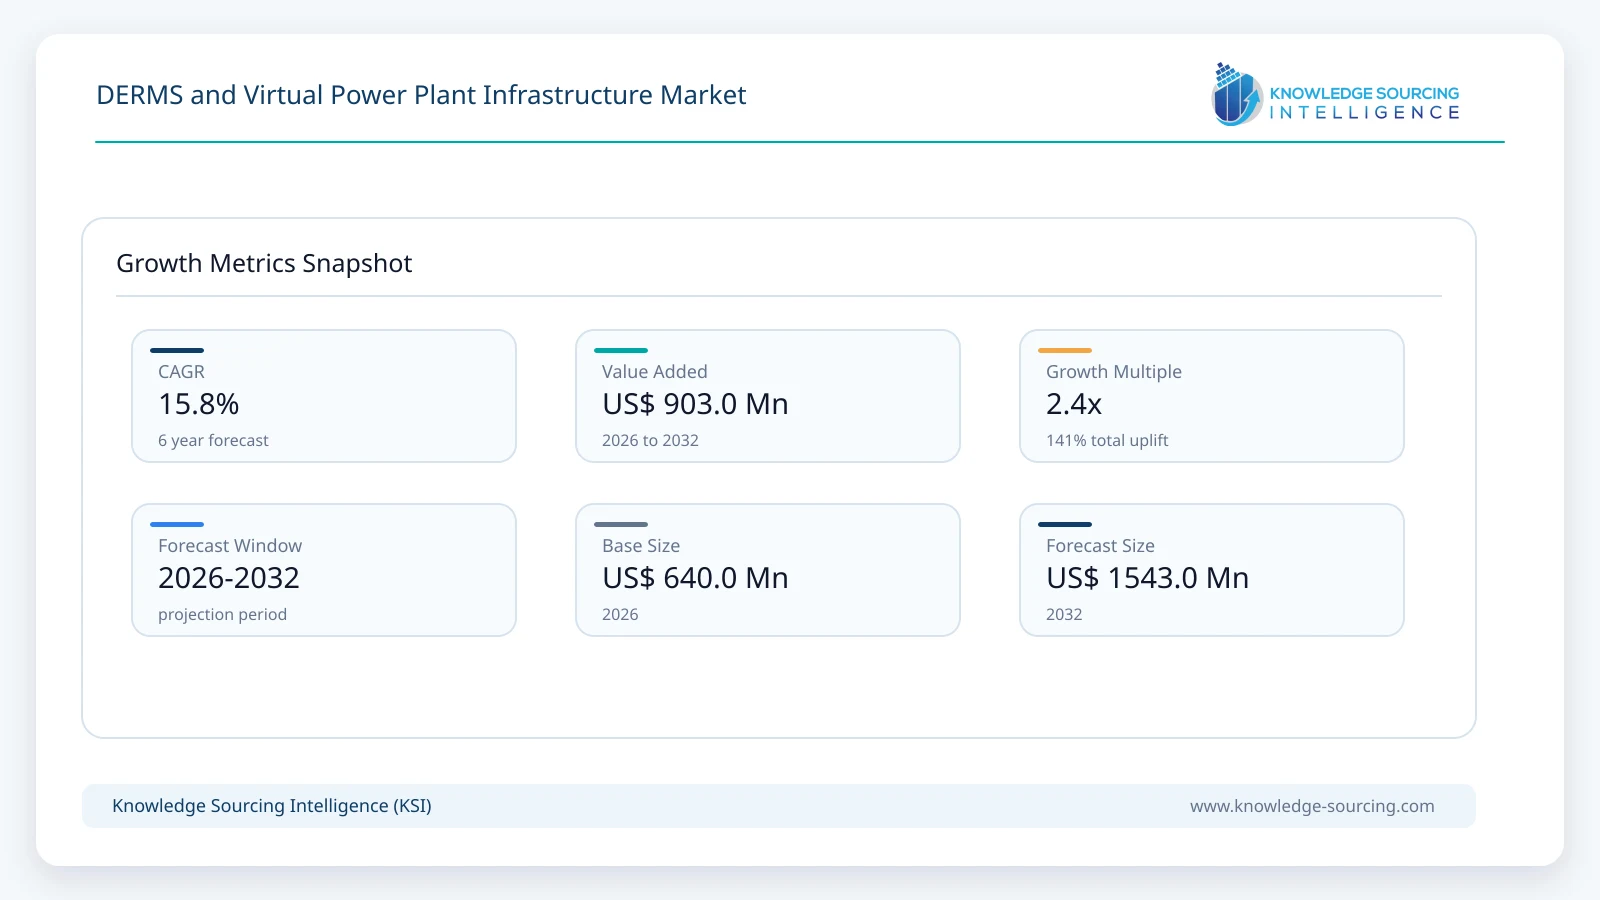
The global DERMS and VPP digital-infrastructure market is forecast to grow at a CAGR of 15.8%, reaching USD 1,543.0 million in 2032 from USD 640.0 million in 2026.
Highlights:
- 1The U.S. Department of Energy identified roughly 33 GW of North American VPP capacity in its 2025 update, highlighting the growing scale of coordinated distributed flexibility.
- 2EnergyHub reports over 3.4 GW of dispatchable flexibility and 2.5 million managed devices, while Uplight reports 8.5 GW of flexible load, using different coverage definitions.
- 3FERC Order No. 2222 expands the regulatory route for aggregated resources but market implementation timelines and technical participation rules continue to differ by region.
- 4Wholesale participation, device interoperability, customer opt-out behaviour and local feeder constraints determine how much enrolled flexibility is actually available when called.
Market Overview
Utility DERMS and VPP products approach grid flexibility from different directions. DERMS starts with the feeder, transformer and network constraints. It determines which connected resources can respond safely under current conditions. VPP platforms start with enrolled customers and devices, predicting availability and issuing dispatch instructions. As VPP portfolios expand, a dispatch optimized only for wholesale prices can create congestion or voltage problems on local feeders. Integration of network constraints with device orchestration is therefore increasingly valuable.
GE Vernova and EnergyHub are working together on GridOS DERMS and grid-edge device control, illustrating the move from separate software tools toward coordinated workflows. Utilities continue to use a combination of enterprise distribution software and specialist device-orchestration platforms. Operators must reconcile network models, communications protocols, SCADA and ADMS integration, cyber controls and customer consent. These integration requirements create material implementation revenue and switching costs but lengthen sales cycles.
The VPP business case depends on dependable flexible capacity, not registered device totals. Aggregators must model device availability and deploy portfolios large enough to absorb these uncertainties. DOE identifies a growing North American VPP fleet and potential for further expansion, but software vendors capture only a fraction of the system savings created by these resources.
Utility enterprise licenses, managed VPP subscription fees, endpoint orchestration, and market-integration projects use different pricing conventions. Enterprise DERMS value is linked to the size and complexity of the distribution operation, while managed VPP fees may reflect enrolled endpoints, dependable kilowatts and service levels. Pricing therefore varies widely across utility-enterprise deployments and managed flexibility portfolios, depending on integration scope, capacity commitments and service responsibilities.
Market Drivers
Distributed Grid Constraints and Flexible Capacity
The underlying constraint is a distribution network designed for largely one-directional flows. New solar and batteries can cause export peaks, while EV charging and electrified heating create local demand peaks. A grid-aware dispatch can relieve a transformer or feeder without a permanent reinforcement where the problem is time-limited. The avoided network cost provides an economic case for DERMS, but flexibility only substitutes for capital construction when its availability is sufficiently dependable and geographically located.
VPP Procurement and Revenue Stacking
Utilities increasingly procure flexibility as an alternative to peaking supply or emergency network reinforcement. Battery, thermostat and EV programs have different event durations and customer impacts, allowing aggregators to shape response more flexibly than a single-device portfolio. Wholesale-market access under FERC Order No. 2222 offers an additional revenue stream in some jurisdictions, although retail/wholesale coordination and duplicate compensation rules limit simple revenue stacking. Software value comes from delivering reliable dispatch and settlement rather than the nominal capacity enrolled.
Interoperability and Customer Engagement
An aggregator may control devices from multiple manufacturers with different APIs, response times, and cybersecurity processes. Maintaining device adapters, enrollment, consent, forecasting, and performance verification can represent a continuing service obligation. This favors platform vendors with mature integration libraries and established utility relationships, while also creating an opening for interoperable solutions that reduce vendor lock-in.
Market Restraints
Enrolled Versus Dependable Capacity
Connected capacity cannot be treated as firm capacity available in every hour. Customer behaviour, device charging state, battery reserves, communications outages and feeder constraints change deliverability. Utilities therefore apply eligibility, baseline and performance rules before depending on VPP capacity for resource adequacy. Overstating dispatchable megawatts can expose aggregators to penalties and damage the economics of managed-service contracts.
Implementation and Cybersecurity Costs
Operational DERMS requires credible network models, telemetry, control authority, operator workflows and testing under normal and contingency states. Integrating these capabilities into older ADMS installations can take longer than deploying a stand-alone customer enrollment application. Cybersecurity requirements intensify when hundreds of thousands of connected devices can receive automated dispatch signals. These costs constrain speed of adoption even where flexible assets are already installed.
Market Rules and Procurement Friction
FERC Order No. 2222 addresses participation barriers but does not guarantee uniform commercial access on a common timeline. Market operators must adopt detailed aggregation, metering, distribution-review and settlement procedures. Utilities also face rate-design and cost-recovery decisions when flexibility is procured instead of a conventional capital project. Software deployment consequently follows regulation and operating practice, not just device adoption.
Segment Analysis
By Platform Type
Utility DERMS occupies the control-room application layer and is purchased to manage network constraints, interconnection operating limits, and grid-edge asset visibility. VPP aggregation platforms organize customer-side devices and deliver dispatchable services for utilities, retailers, or wholesale-market aggregators. Customer engagement, device integration and flexibility trading are frequently bundled with core platforms, influencing procurement decisions and recurring service revenue. The competitive advantage increasingly lies in translating physical network constraints into usable customer dispatch at acceptable operating cost.
By Distributed Resource
Battery portfolios provide short-notice dispatch and relatively measurable delivered power, but depend on state of charge and customer backup preferences. Flexible EV charging can shift substantial demand at low marginal infrastructure cost when connectivity and driver requirements are respected, while vehicle-to-grid needs additional compatible equipment and tariffs. Thermostats support a broad enrolled device base, but their response is weather-sensitive and frequently short-duration. Solar, water heaters, heat pumps and commercial loads offer additional flexibility, with control complexity increasing as portfolios become more diverse.
By Application and Buyer
Peak capacity and resource adequacy remain major reasons to procure managed flexibility, while local congestion relief, renewable hosting-capacity management and wholesale balancing provide additional purchasing routes. Distribution utilities buy grid-aware applications, aggregators buy market optimization and device management, and energy retailers may buy customer orchestration integrated with energy billing.
Regional Analysis
North America
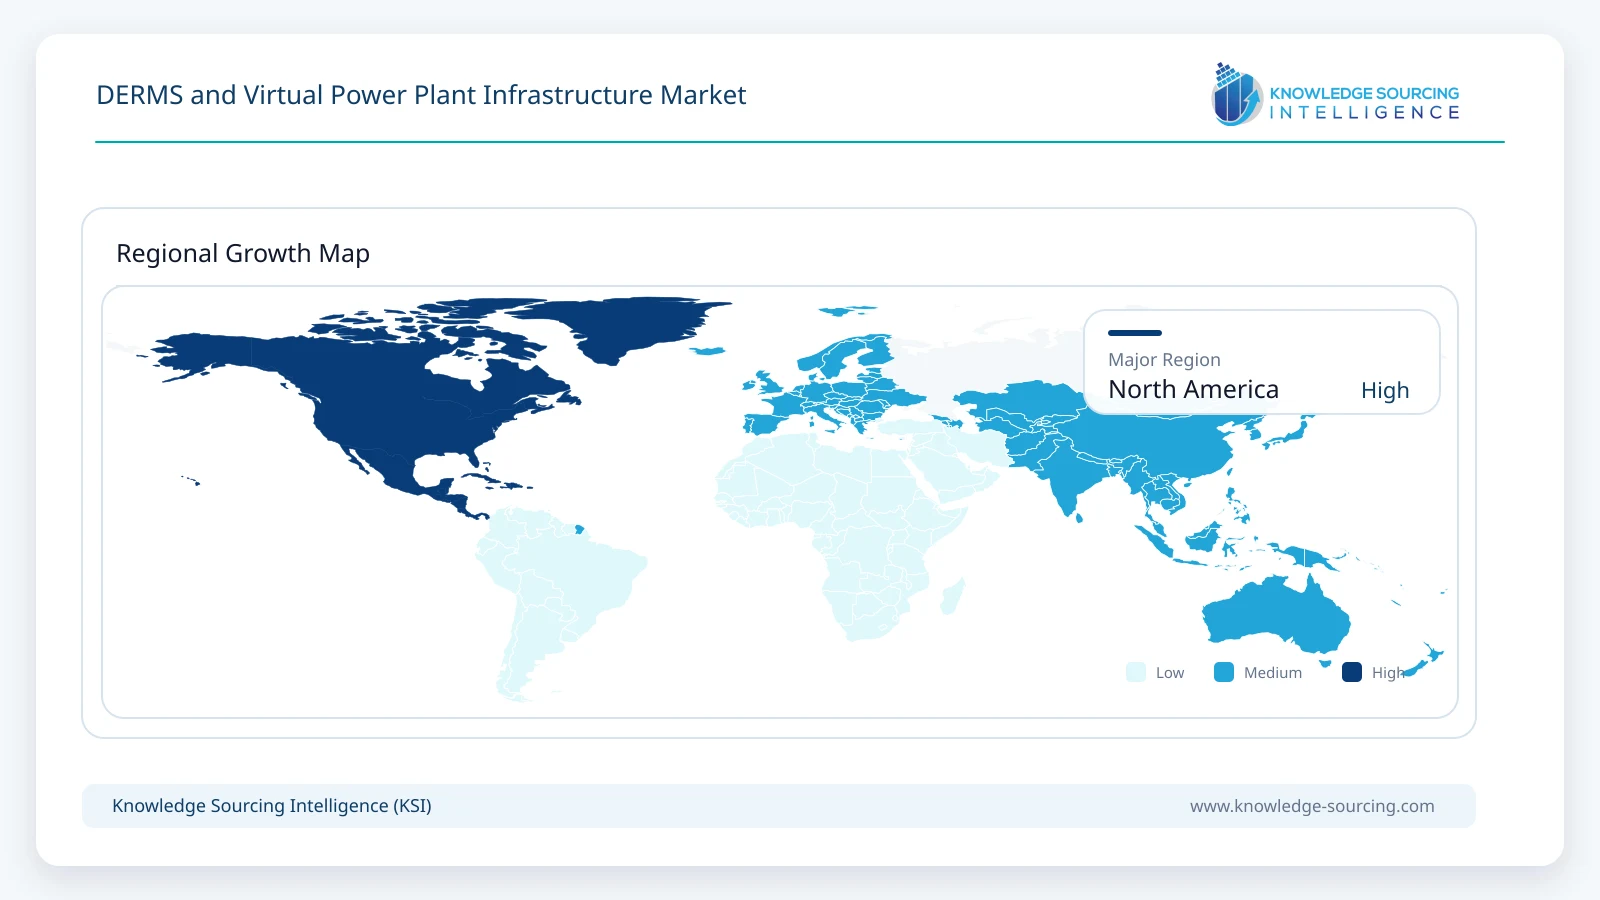
North America combines utility flexibility programs, rapidly growing customer battery adoption, managed EV charging and wholesale-market reform. The 2025 DOE update cites 33 GW of existing regional VPP capacity and identifies a significantly larger potential future contribution.
EnergyHub, Uplight, Tesla, Virtual Peaker and other vendors serve grid-edge flexibility programs, while GE Vernova, Schneider Electric, Itron and OATI provide utility-facing distribution software. FERC Order No. 2222 creates a pathway toward wider market participation, but the schedules differ by ISO and RTO. Utility procurement therefore remains an important revenue route even where wholesale aggregation is not yet operational at scale.
Competitive and Technology Landscape
GE Vernova, Schneider Electric and Itron have strong grid-operations relationships. EnergyHub, Uplight, Virtual Peaker and Tesla serve customer-side aggregation and managed flexibility. OATI provides utility and market software; Emerson participates through AspenTech, while Mitsubishi Electric participates through Smarter Grid Solutions. Kraken, Leap, Piclo and GridBeyond support retail and market flexibility, although their services are not identical to full utility-control-room DERMS.
Corporate ownership and platform integration are reshaping competition. Schneider Electric includes AutoGrid, Emerson owns AspenTech, and Mitsubishi Electric owns Smarter Grid Solutions. Kraken operates independently following its separation from Octopus Energy. Competitive differentiation increasingly depends on product scope, utility integrations, dependable dispatch capacity and responsibility for measured performance.
Recent Developments
September 2026: Octopus Energy completed an investment in Uplight, which reported 8.5 GW of managed flexible load across more than 85 utilities.
February 2026: GE Vernova launched GridOS for Distribution, combining distribution operation, grid modelling and DER orchestration.
2026: GE Vernova and EnergyHub advanced integration between utility DERMS and customer-edge DER orchestration.
2026: EnergyHub reported 3.4 GW of dispatchable flexibility and more than 2.5 million devices under management in its annual review.
2026: Utility and aggregator preparations continued for different regional implementation dates under FERC Order No. 2222.
DERMS and Virtual Power Plant Infrastructure Market Scope:
| Report Metric | Details |
|---|---|
| Total Market Size in 2026 | USD 640.0 million |
| Total Market Size in 2032 | USD 1,543.0 million |
| Forecast Unit | USD Million |
| Growth Rate | 15.8% |
| Study Period | 2021 to 2032 |
| Historical Data | 2021 to 2024 |
| Base Year | 2025 |
| Forecast Period | 2026 – 2032 |
| Segmentation | Platform Type, Distributed Resource, Application, Buyer and Delivery Model |
| Companies |
|
Market Segmentation
By Platform Type
Utility DERMS
VPP Aggregation and Orchestration
Device and Customer Platforms
Market Optimization and Trading
By Distributed Resource
Behind-the-Meter Batteries
EVs and Managed Charging
Smart Thermostats and Heating Loads
Solar and Water Heating
Commercial Flexible Loads
By Application
Resource Adequacy and Peak Reduction
Demand Shaping
Ancillary and Wholesale Services
Feeder Constraint Management
Resilience and Grid Support
By Buyer and Delivery Model
Electric Utilities and DSOs
Retailers and Aggregators
Enterprise Platform Deployments
SaaS and Managed Service Models
By Geography
North America
Europe
Asia Pacific
China
Rest of World
Table of Contents
1. EXECUTIVE SUMMARY
1.1. Market Opportunity and Key Findings
1.2. Software Commercialization Outlook
1.3. Competitive and Procurement Trends
2. RESEARCH SCOPE AND METHODOLOGY
2.1. Platform Revenue Boundary
2.2. Licenses, SaaS and Managed Fees
2.3. Grid-Aware and Device-Level Control
2.4. Installed Platform and Dispatchable GW Model
2.5. Forecast Assumptions
3. DERMS AND VPP INFRASTRUCTURE ARCHITECTURE
3.1. Utility Grid-Aware DERMS
3.2. Device and Customer Orchestration
3.3. Telemetry and Communications
3.4. Aggregation and Dispatch
3.5. Market Bidding and Settlement
3.6. Security and Interoperability
4. MARKET SIZE AND FORECAST, 2026–2032
4.1. Global Platform Revenue
4.2. Active Utility Deployments
4.3. Managed and Dispatchable Capacity
4.4. Subscription and Implementation Economics
4.5. Forecast Scenarios
5. MARKET BY PLATFORM TYPE
5.1. Utility DERMS
5.2. VPP Aggregation and Orchestration
5.3. Device and Customer Platforms
5.4. Market Optimization and Trading
6. MARKET BY DISTRIBUTED RESOURCE
6.1. Behind-the-Meter Batteries
6.2. EVs and Managed Charging
6.3. Smart Thermostats and Heating Loads
6.4. Solar and Water Heating
6.5. Commercial Flexible Loads
7. MARKET BY APPLICATION
7.1. Resource Adequacy and Peak Reduction
7.2. Demand Shaping
7.3. Ancillary and Wholesale Services
7.4. Feeder Constraint Management
7.5. Resilience and Grid Support
8. MARKET BY BUYER AND DELIVERY MODEL
8.1. Electric Utilities and DSOs
8.2. Retailers and Aggregators
8.3. Enterprise Platform Deployments
8.4. SaaS and Managed Service Models
9. REGIONAL MARKET
9.1. North America
9.2. Europe
9.3. Asia Pacific
9.4. China
9.5. Rest of World
10. UTILITY ECONOMICS AND PROCUREMENT
10.1. Network Deferral and Capacity Value
10.2. Platform Implementation and Integration
10.3. Customer Incentives and Performance
10.4. Regulatory Market Access
11. COMPETITIVE LANDSCAPE
11.1. Utility Control-Room Platforms
11.2. VPP and Edge Orchestration
11.3. Market Optimization and Services
11.4. Device Ecosystem and Integrations
12. COMPANY PROFILES
12.1. GE Vernova
12.2. Schneider Electric / AutoGrid
12.3. EnergyHub
12.4. Uplight
12.5. Tesla
12.6. Itron
12.7. OATI
12.8. Emerson / AspenTech
12.9. Kraken Technologies
12.10. Virtual Peaker
12.11. Leap
12.12. Piclo
12.13. GridBeyond
12.14. Mitsubishi Electric / Smarter Grid Solutions
13. APPENDIX
13.1. Definitions
13.2. Source Register
13.3. Forecast Methodology
Navigate
Trusted by the world's leading organizations