
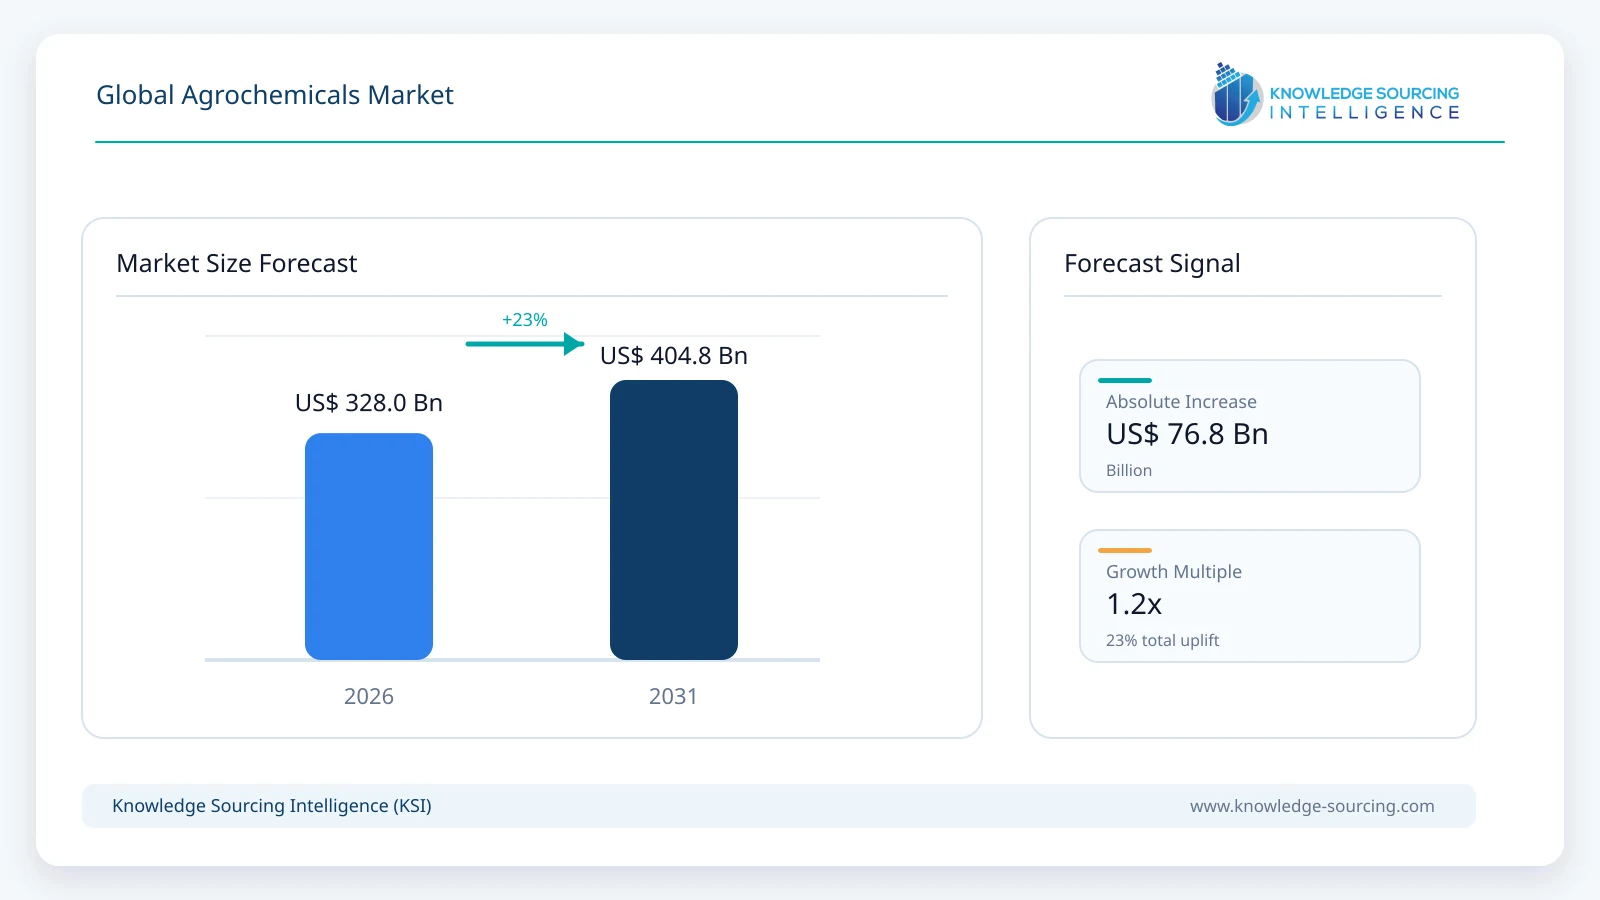
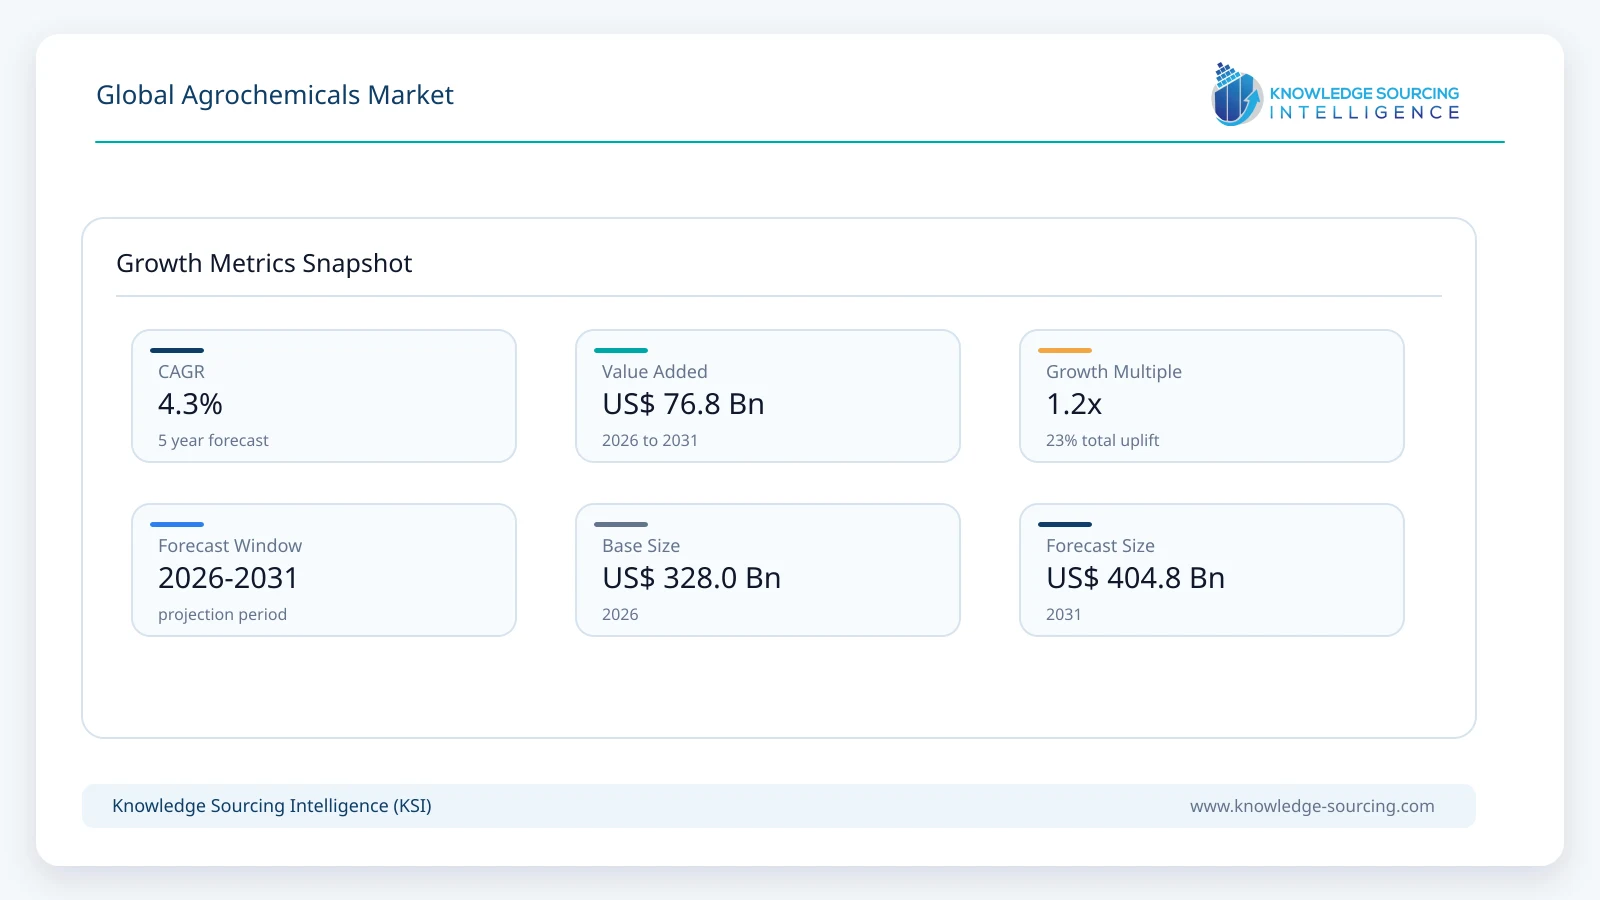
The Global Agrochemicals Market is expected to expand at a CAGR of 4.3%, reaching USD 404.8 billion in 2031 from USD 328.0 billion in 2026.
Highlights:
- 1Fertilizers account for approximately 78% of 2026 market value, with nutrient pricing and large-volume crop applications sustaining the largest revenue pool.
- 2Cereals represent approximately 45% of 2026 agrochemical spending by crop type, reflecting extensive cultivated area and recurrent nutrient and weed-control requirements.
- 3New herbicide and fungicide modes of action are commercially valuable where resistance reduces the reliability of established crop-protection programmes.
- 4Nitrogen-stabilizing additives and water-soluble fertilizers are creating differentiated product demand without replacing the need for conventional nutrients.
- 5Biological pesticide development continues, but registration status, storage stability and repeatable field performance determine commercial adoption.
- 6Supplier performance depends on farm-gate affordability, approved product availability and disciplined distribution, not simply on the number of new formulations launched.
The market encompasses fertilizers and pesticides supplied for agricultural crop production. Fertilizer categories cover nitrogenous, phosphatic and potassic products, including formulations sold as finished plant nutrients. The pesticide market includes conventional crop-protection chemistry and qualifying biological pesticides. Input manufacturers earn revenue from the products supplied to agricultural customers; crop output, seeds, complete application equipment and unrelated industrial chemicals fall outside the market.
Crop nutrition has a resource-intensive manufacturing structure, with natural gas, ammonia, phosphate rock and potash influencing production economics. Crop-protection producers face a different set of constraints: product efficacy, regulatory registrations, application labels and resistance management. Sales through agricultural retailers link the businesses commercially, but a tonne of nutrient material cannot be valued or forecast using the economics of a patented insecticide.
Market Overview
According to FAO’s 30 July 2026 release, agricultural use of inorganic fertilizers reached 197 million tonnes of nutrients in 2024, including about 115 million tonnes of nitrogen, 44 million tonnes of phosphorus and 38 million tonnes of potassium. Use had recovered from the 2022 disruption but remained below its 2020 peak. These volume measures establish the scale and persistence of agricultural nutrition, although they do not indicate product revenue or the price paid for a finished fertilizer formulation.
In crop protection, a manufacturer can command a premium for a relatively small quantity of chemistry when it addresses a resistant weed or damaging disease. Syngenta’s October 2026 collaboration with Kyoyu Agri on cyclopyranil for Asian rice crops illustrates the product-development route, while Corteva’s introduction of Verpixo in United States sugarbeets shows the importance of a registered mode of action for a specific crop disease. Registration, stewardship and distribution access affect how quickly a novel active ingredient translates into sales.
Market Trends
Specialty Fertilizers Are Being Manufactured Closer to Key Users
ICL opened a water-soluble fertilizer production facility in Maharashtra on 18 March 2026, bringing specialty nutrient manufacturing closer to Indian buyers. Crop programmes using fertigation or intensive horticulture require products that dissolve consistently and deliver predictable nutrient concentrations. Local production reduces reliance on some cross-border movements of finished formulations, an advantage when delivery timing matters as much as the quoted product price.
For specialty producers, the margin opportunity lies in formulation quality and access to technical distributors rather than simple scale alone.
Nitrogen Stabilization Is Moving into Fertilizer Formulation
BASF introduced its Ampliqan nitrification inhibitor in China on 15 September 2026 for producers of nitrogen fertilizers. Slowing the conversion of ammonium into nitrate can reduce loss exposure under suitable soil conditions, potentially improving the agronomic value of an existing nutrient purchase. The immediate manufacturing customer may be the fertilizer blender, not the grower buying a separate additive.
A nitrogen-stabilized product must still justify its premium through locally demonstrated yield or nutrient-efficiency gains.
Crop-Protection Portfolios Are Adjusting to Resistance Pressure
Repeated use of established herbicide and fungicide mechanisms increases selection pressure in weeds and pathogens. Syngenta and Kyoyu Agri are targeting resistant rice weeds through a Group 14 PPO-inhibiting herbicide, while Corteva’s Verpixo introduced a Group 21 fungicide option to United States sugarbeet growers in May 2026. The two programmes serve different crops but respond to a similar commercial problem: declining reliability of repeated chemistry.
Manufacturers must combine field efficacy with registration investment and resistance-management guidance. A newly launched product is unlikely to replace an entire spray programme; tank-mix compatibility, application windows and rotations with other effective mechanisms often matter more to growers than the novelty of the active alone.
Biological Crop Protection Is Entering Broader Portfolios
Syngenta Group reported further development of its biologicals business in its 2025 results, alongside conventional crop protection. Biological pesticides offer pest-specific control options and can fit integrated pest-management programmes, but viable organism content, formulation stability and variation in field conditions create manufacturing and marketing demands distinct from standard synthetic chemistry.
Commercial adoption is more credible where the supplier can support storage, application instructions and agronomic trials through existing channels.
Input Prices and Physical Demand Are Diverging
The World Bank’s April 2026 commodity outlook reported renewed fertilizer-price pressure in early 2026, demonstrating how disruptions to feedstocks and transport can move selling prices without equivalent increases in nutrient consumption. A manufacturer may report higher nominal sales while farmers reduce discretionary application rates or shift purchasing toward lower-cost grades.
Crop-protection companies face a different price mechanism, with generic competition, product mix and distributor inventories affecting realizations. Nutrien and Syngenta’s 2026 financial disclosures show why volume and margin must be assessed separately when comparing crop inputs across years.
Segment Analysis
By Type: Fertilizers
Nitrogenous, phosphatic and potassic products collectively dominate agrochemical turnover because crop production requires large recurring purchases of essential nutrients. The fertilizer category is forecast to reach approximately USD 311.73 billion by 2031, with steady demand underpinned by planted acreage and replacement of nutrients removed through harvest. Natural gas exposure is significant for nitrogen manufacturers; phosphate and potash producers depend on different resource deposits and trade routes.
FAO recorded nitrogen nutrient use at 115 million tonnes in 2024, substantially above either phosphorus or potassium. Despite this physical scale, fertilizer revenue cannot be allocated in direct proportion to nutrient tonnage, because product composition and selling prices differ. The category’s estimated 4.0% annual expansion conceals larger swings in commodity prices and growing demand for coated, soluble or stabilized formulations in specific crops.
By Crop Type: Cereals
Rice, wheat and maize are the principal recurring markets for broad-acre fertilizer and crop-protection programmes. Wheat requires seasonal nitrogen decisions linked to yield and protein objectives; rice often combines water management with herbicide choices suited to paddy conditions; maize producers place substantial emphasis on nutrient timing and early weed control. The scale of these crops gives suppliers repeat demand even when input rates vary from season to season.
Cereal-related agrochemical revenue is expected to approach USD 174.08 billion by 2031, implying about 3.4% annual growth from 2026. A large installed distribution base supports established products, while resistance management can change the value of individual treatment programmes. Advances such as the proposed cyclopyranil rice herbicide have potential in particular growing systems, but their commercial contribution depends on country registrations and successful field adoption.
Market Drivers
Yield Requirements on Established Agricultural Land
Commercial cereal and oilseed output depends on replacing harvested nutrients and protecting crop stands through vulnerable growth stages. Reduced nitrogen availability can constrain yield formation well before grain filling; early weed competition can cause damage that later treatment cannot fully reverse. These requirements provide a recurring purchasing base for input suppliers across large farming regions.
The purchasing mix changes with field conditions rather than simply rising every year. Growers adjust nutrient rates to soil tests and yield expectations, and they use fungicides or insecticides where the likely avoided loss exceeds treatment cost. Manufacturers with dependable agronomic evidence are better placed to retain customers during weaker commodity-price cycles.
Precision Nutrition in Irrigated and High-Value Crops
Water-soluble fertilizers and enhanced-efficiency products can justify higher unit prices in orchards, vegetables and protected cultivation, where a small quality improvement carries considerable economic value. ICL’s Maharashtra facility serves a market in which fertigation can make timing and solubility as important as nutrient content.
Adoption is constrained by the supporting equipment and the quality of local technical advice. Suppliers gain from repeat purchases when application recommendations work over successive seasons, but the same product may not deliver a sufficient premium in rain-fed, low-margin grains. This creates distinct growth profiles within the wider fertilizer category.
Need for New Resistance-Management Tools
Herbicide-resistant weeds and fungal diseases place pressure on farms relying on a narrow set of crop-protection mechanisms. Corteva’s May 2026 Verpixo launch addressed Cercospora leaf spot in sugarbeets using a Group 21 mode of action; Syngenta’s October 2026 agreement targets weed resistance in rice. These programmes illustrate the potential for approved, differentiated chemistry to replace less effective treatment choices.
The value proposition rests on yield protection rather than novelty alone.
Public Measures Supporting Nutrient Accessibility
Fertilizer subsidies, import arrangements and production incentives influence whether growers can purchase required nutrients before planting. The effect is especially material where farming businesses have limited cash reserves and must commit spending ahead of harvest. Local supply security can also reduce the risk of missing short seasonal application windows.
Such measures do not necessarily translate into higher producer margins. Price controls, procurement tenders and changes in subsidy reimbursement can alter channel economics, while subsidized volumes may favour standard products over more expensive formulations. Country policy therefore affects the market through purchasing access as well as supplier pricing.
Development of Biological and Efficiency-Enhanced Inputs
Biopesticides, nitrification inhibitors and specialty nutrient formulations broaden the range of products available to agronomists. Manufacturers can address particular needs such as biological pest suppression, reduced nitrogen losses or more consistent fertigation. BASF’s Ampliqan launch shows how a crop-input company can create value through an additive incorporated into a familiar fertilizer.
These purchases grow when growers see a consistent benefit under their own climatic and soil conditions. Registration, cost per treated hectare, product stability and the availability of technical support distinguish commercially repeatable products from promising demonstrations.
Market Restraints
Exposure to Feedstock Prices and Trade Disruptions
Natural gas, ammonia, sulfur, phosphate rock and potash feedstock costs can change the selling price of fertilizers within a relatively short period. International freight and export restrictions amplify those movements. The World Bank’s 2026 assessment highlights the vulnerability of nominal market value to price shocks unrelated to physical farm demand.
When input costs rise quickly, farmers may lower application rates, substitute grades or delay purchases. A subsequent price correction can reduce supplier revenue even as tonnage recovers, complicating inventory and investment decisions for manufacturers and dealers.
Lengthy Product Registration and Reassessment
Crop-protection companies must produce toxicology, residue, environmental and efficacy evidence for each relevant regulatory jurisdiction. A pesticide marketed on one crop in one country cannot automatically be sold for another crop or geography. New chemistry can spend substantial time in trials and approvals before it reaches a commercial invoice.
Changes to approved uses, labelling or residue limits also affect established products. Smaller suppliers may struggle to justify registration expenditure for niche markets, while multinational portfolios carry continuing compliance and stewardship costs.
Farm Cash Flow and Uncertain Crop Returns
Grower purchasing decisions are shaped by the anticipated value of the crop, financing costs and the timing of working-capital requirements. A weaker grain price can lower willingness to purchase an additional fungicide application or premium nutrient product, even when the technology has a credible agronomic benefit.
The impact differs across product families. Essential nutrient replacement and urgent disease control are less discretionary than marginal extra treatments, but even those purchases can be resized if a farm cannot obtain credit on acceptable terms.
Nutrient Losses and Chemical Stewardship Requirements
Runoff, leaching and improper pesticide application can impose environmental and operational costs beyond the product purchase. Farmers and distributors must observe approved rates, handling rules and buffer requirements; manufacturers must design labels and training material that make proper use practical.
Improved formulations may reduce some risks, yet a premium is difficult to sustain without a demonstrable effect on crop performance, handling or compliance. The extra testing and technical support add expense even where no immediate price premium is achievable.
Counterfeit Products and Uneven Distribution Quality
Seasonal demand and extensive rural dealer networks can leave buyers exposed to mislabelled, adulterated or counterfeit fertilizers and crop-protection products. Poor product performance damages the grower’s outcome and can also undermine confidence in legitimate branded formulations.
Manufacturers invest in traceable packaging, authorized distribution and dealer training to protect customers. Enforcement and supply-chain capability vary considerably between markets, leaving responsible suppliers with costs that may not be fully reflected in selling prices.
Regional Outlook
North America
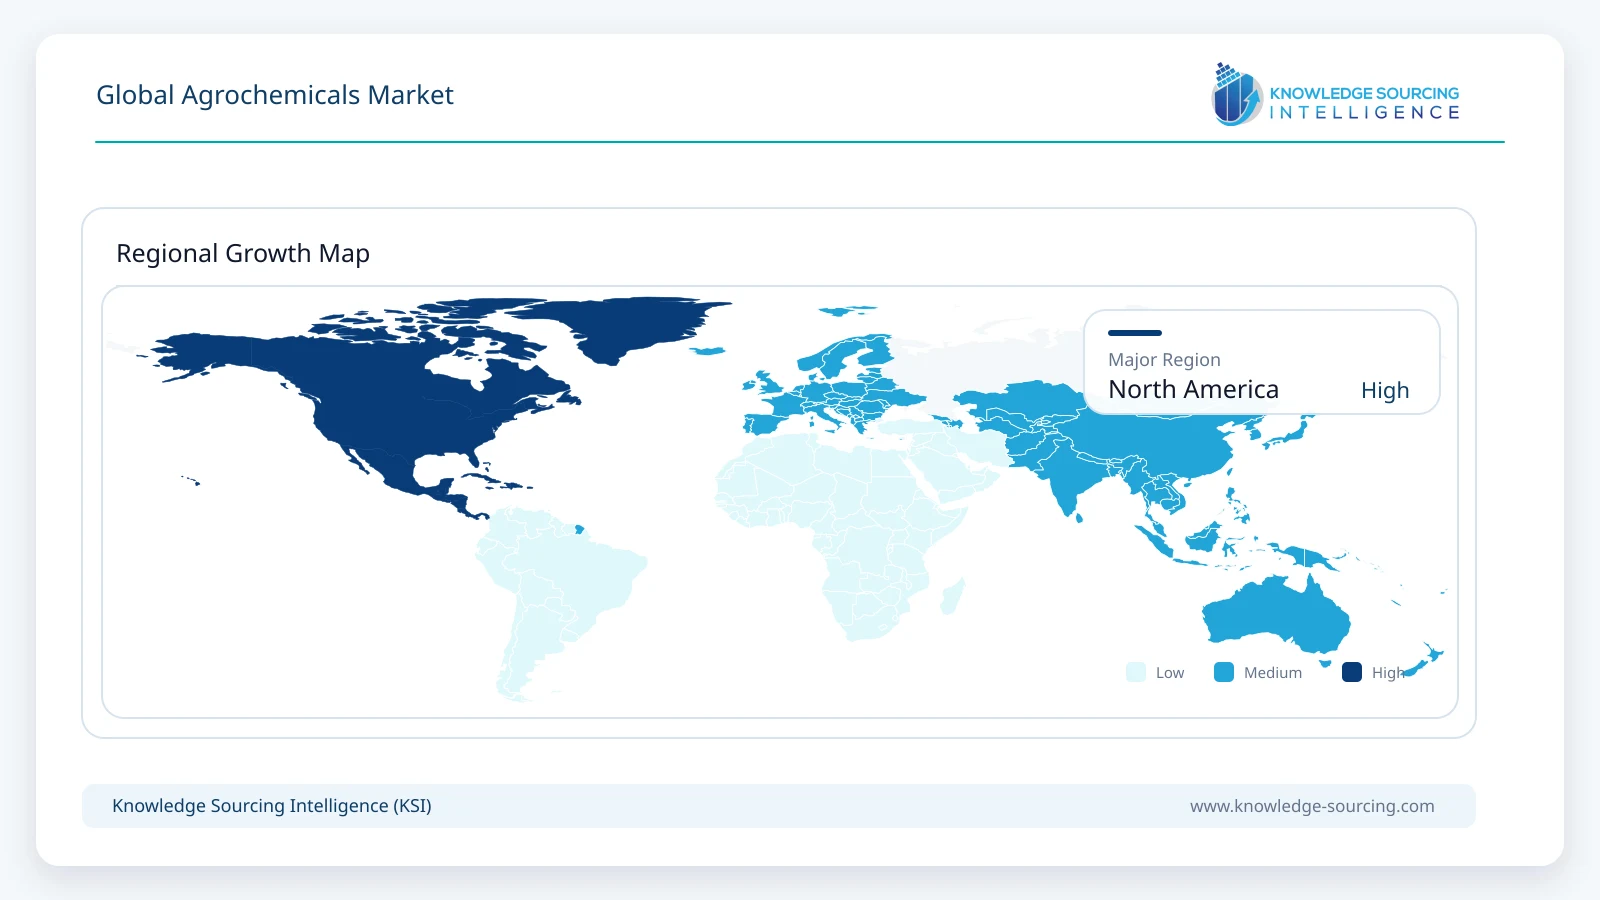
North America accounts for an estimated 32% of global agrochemical revenue in 2026, or approximately USD 104.96 billion, and remains the largest regional value pool through the forecast period. Large maize, soybean and wheat farms purchase substantial baseline nutrients and crop-protection inputs through organized dealer networks. Premium products succeed where the farmer can link an application to yield, quality or operational savings rather than a general promise of technical improvement.
Regional value is forecast to reach around USD 125.50 billion by 2031, equivalent to approximately 3.6% annual growth. Fertilizer sales are sensitive to import parity, energy and product inventories; crop-protection suppliers face herbicide resistance, regulatory demands and competition from generic formulations. The region’s growth therefore depends heavily on product mix and realized prices rather than major increases in cultivated area.
Asia Pacific
Asia Pacific is estimated to contribute approximately 26% of market revenue in 2026, supported by the scale of Chinese and Indian crop production and an extensive network of local input suppliers. Rice, wheat, horticulture and oilseed systems create widely different fertilizer and pesticide requirements. India’s expanding specialty nutrient capacity and China’s demand for nitrogen-efficiency formulations show why basic nutrient volumes do not capture every commercial opportunity.
The regional market is forecast to reach approximately USD 113.36 billion in 2031, advancing at about 5.9% per year and lifting its global share to 28%. Broad-acre growers remain price-sensitive, while higher-value crops can support soluble fertilizers and targeted crop protection. Supplier success will depend on local registrations, accessible distribution and field evidence suited to regional growing conditions.
Competitive Landscape
Fertilizer manufacturing is characterized by scale, resource access and high fixed costs, while crop protection relies more on chemistry, regulatory dossiers and formulation capabilities. Nutrien, Mosaic, Yara and CF Industries have substantial exposure to commodity nutrient products. ICL combines mineral fertilizer operations with water-soluble and specialty plant nutrition. These companies compete on delivered economics, production reliability and access to regional markets rather than a single uniform product specification.
BASF, Bayer, Syngenta, Corteva, FMC, UPL and Nufarm manufacture crop-protection chemistry or finished formulations, using different combinations of proprietary actives and established products. Syngenta Group also encompasses ADAMA, so the two should not be counted as independent parent-company rivals. Crop Science businesses frequently include seeds and other activities; those revenues must not be confused with pesticide turnover when assessing competitive positions.
Recent Developments
12 October 2026: Syngenta and Kyoyu Agri announced a collaboration to develop cyclopyranil-based Group 14 herbicide solutions for selected Asian rice markets, addressing weeds resistant to existing modes of action. Commercial rollout depends on local approvals.
15 September 2026: BASF launched Ampliqan, a nitrification inhibitor for China’s fertilizer industry, enabling manufacturers to formulate nitrogen products aimed at improving nutrient-use efficiency.
26 August 2026: CF Industries, JERA and Mitsui broke ground on the Blue Point One low-carbon ammonia project in Louisiana. The project is a construction milestone, not proof of current commercial agricultural output.
3 August 2026: Bayer introduced Xivana Smart fungicide in India for high-value horticulture crops, broadening options against downy mildew and late blight.
13 May 2026: Corteva launched Verpixo fungicide with Adavelt active in the United States sugarbeet market following EPA registration, adding a Group 21 resistance-management option.
18 March 2026: ICL Group opened its Maharashtra water-soluble fertilizer manufacturing facility, expanding local access to specialty crop nutrition products in India.
Market Outlook
Through 2031, nutrient manufacturers will continue to balance large-volume agricultural demand against volatile feedstocks, freight and selling prices. Crop-protection suppliers will place greater emphasis on products that solve identifiable problems in resistance management or specific crop applications. Higher-value biological and efficiency-enhanced products should broaden choice, although approval requirements and uneven field performance will prevent uniform uptake across regions.
A supplier’s durable position will depend on reliable manufacturing, agronomic proof and access to the right distribution channel. Commodity inputs will remain indispensable in cereal systems, while specialty nutrients and registered protection products can capture additional value where their contribution to farm returns is measurable.
Agrochemicals Market Scope
| Report Metric | Details |
|---|---|
| Total Market Size in 2026 | USD 328.0 billion |
| Total Market Size in 2031 | USD 404.8 billion |
| Forecast Unit | Billion |
| Growth Rate | 4.3% |
| Study Period | 2021 to 2031 |
| Historical Data | 2021 to 2024 |
| Base Year | 2025 |
| Forecast Period | 2026 – 2031 |
| Segmentation | Type, Crop Type, Geography |
| Companies |
|
| Customization Scope | 15% Free Customization included with purchase — Request Custom Breakdown → |
| Sample & Data Access | PDF Sample, Excel Databook & Analyst Briefing — Download Free Sample → |
Market Segmentation
By Type
Fertilizers
Nitrogenous Fertilizers
Phosphatic Fertilizers
Potassic Fertilizers
Pesticides
Organophosphates
Pyrethroids
Biopesticides
Neonicotinoids
Others
By Crop Type
Oilseeds
Cereals
Fruits and Vegetables
Others
By Geography
North America
United States
Canada
Mexico
South America
Brazil
Argentina
Rest of South America
Europe
Germany
United Kingdom
France
Italy
Spain
Rest of Europe
Middle East and Africa
Saudi Arabia
United Arab Emirates
South Africa
Rest of Middle East and Africa
Asia Pacific
China
India
Japan
South Korea
Australia
Indonesia
Thailand
Taiwan
Rest of Asia Pacific
Table of Contents
1. EXECUTIVE SUMMARY
1.1. Key Findings
1.2. Analyst View
2. MARKET SNAPSHOT
2.1. Market Definition and Scope
2.2. Market Size and Forecast
2.3. Segmentation Overview
3. BUSINESS LANDSCAPE
3.1. Market Drivers
3.1.1. Yield Protection across Intensively Cultivated Acreage
3.1.2. Specialty Fertilizer Adoption in Irrigated Crops
3.1.3. Herbicide and Fungicide Resistance Management
3.1.4. Public Support for Food Production and Fertilizer Availability
3.1.5. Expansion of Biological and Efficiency-Enhanced Inputs
3.2. Market Restraints
3.2.1. Volatility in Fertilizer Feedstocks and Trade
3.2.2. Regulatory Burden for Crop-Protection Ingredients
3.2.3. Farm Income and Commodity-Price Constraints
3.2.4. Environmental Losses and Resistance-Related Stewardship
3.2.5. Counterfeit Products and Fragmented Rural Distribution
3.3. Market Opportunities
3.4. Porter’s Five Forces Analysis
3.4.1. Supplier Bargaining Power
3.4.2. Buyer Bargaining Power
3.4.3. Threat of New Entrants
3.4.4. Threat of Substitutes
3.4.5. Competitive Rivalry
3.5. Industry Value Chain Analysis
3.6. Policies and Regulations
3.7. Strategic Recommendations
4. TECHNOLOGICAL OUTLOOK
4.1. Nutrient-Use Efficiency Technologies
4.2. Crop Protection Formulation Innovation
4.3. Biological Product Development
5. GLOBAL AGROCHEMICALS MARKET BY TYPE
5.1. Introduction
5.2. Fertilizers
5.2.1. Nitrogenous Fertilizers
5.2.2. Phosphatic Fertilizers
5.2.3. Potassic Fertilizers
5.3. Pesticides
5.3.1. Organophosphates
5.3.2. Pyrethroids
5.3.3. Biopesticides
5.3.4. Neonicotinoids
5.3.5. Others
6. GLOBAL AGROCHEMICALS MARKET BY CROP TYPE
6.1. Introduction
6.2. Oilseeds
6.3. Cereals
6.4. Fruits and Vegetables
6.5. Others
7. GLOBAL AGROCHEMICALS MARKET BY GEOGRAPHY
7.1. Global Overview
7.2. North America
7.2.1. United States
7.2.2. Canada
7.2.3. Mexico
7.3. South America
7.3.1. Brazil
7.3.2. Argentina
7.3.3. Rest of South America
7.4. Europe
7.4.1. Germany
7.4.2. United Kingdom
7.4.3. France
7.4.4. Italy
7.4.5. Spain
7.4.6. Rest of Europe
7.5. Middle East and Africa
7.5.1. Saudi Arabia
7.5.2. United Arab Emirates
7.5.3. South Africa
7.5.4. Rest of Middle East and Africa
7.6. Asia Pacific
7.6.1. China
7.6.2. India
7.6.3. Japan
7.6.4. South Korea
7.6.5. Australia
7.6.6. Indonesia
7.6.7. Thailand
7.6.8. Taiwan
7.6.9. Rest of Asia Pacific
8. COMPETITIVE ENVIRONMENT AND ANALYSIS
8.1. Major Players and Strategy Analysis
8.2. Market Share Analysis
8.3. Mergers, Acquisitions, Agreements and Collaborations
8.4. Competitive Dashboard
9. COMPANY PROFILES
9.1. Nutrien Ltd.
9.2. Yara International ASA
9.3. The Mosaic Company
9.4. ICL Group Ltd.
9.5. CF Industries Holdings, Inc.
9.6. BASF SE
9.7. Bayer AG
9.8. Syngenta Group
9.9. Corteva, Inc.
9.10. FMC Corporation
9.11. UPL Limited
9.12. Nufarm Limited
10. APPENDIX
10.1. Currency
10.2. Assumptions
10.3. Base and Forecast Years Timeline
10.4. Key Benefits for Stakeholders
10.5. Research Methodology
10.6. Abbreviations





Frequently asked questions
What is the projected market size of the Global Agrochemicals Market by 2031?
Expected to reach USD 404.8 billion by 2031.
What is the forecasted CAGR for the Agrochemicals Market (2026-2031)?
The Global Agrochemicals Market is expected to expand at a CAGR of 4.3%.
Which categories are included in the Agrochemicals Market definition?
Fertilizers (nitrogenous, phosphatic, potassic) and pesticides (conventional, biological).
Which segment represents the largest market value in 2026?
Fertilizers account for approximately 78% of 2026 market value.
What crop type drives the most agrochemical spending?
Cereals represent approximately 45% of 2026 agrochemical spending.
What influences supplier performance in the Agrochemicals Market?
Farm-gate affordability, approved product availability, and disciplined distribution.
Cite this report
Knowledge Sourcing Intelligence. (Oct 2026). Global Agrochemicals Market - Strategic Insights and Forecasts (2026-2031). https://www.knowledge-sourcing.com/report/global-agrochemicals-market