Report Overview
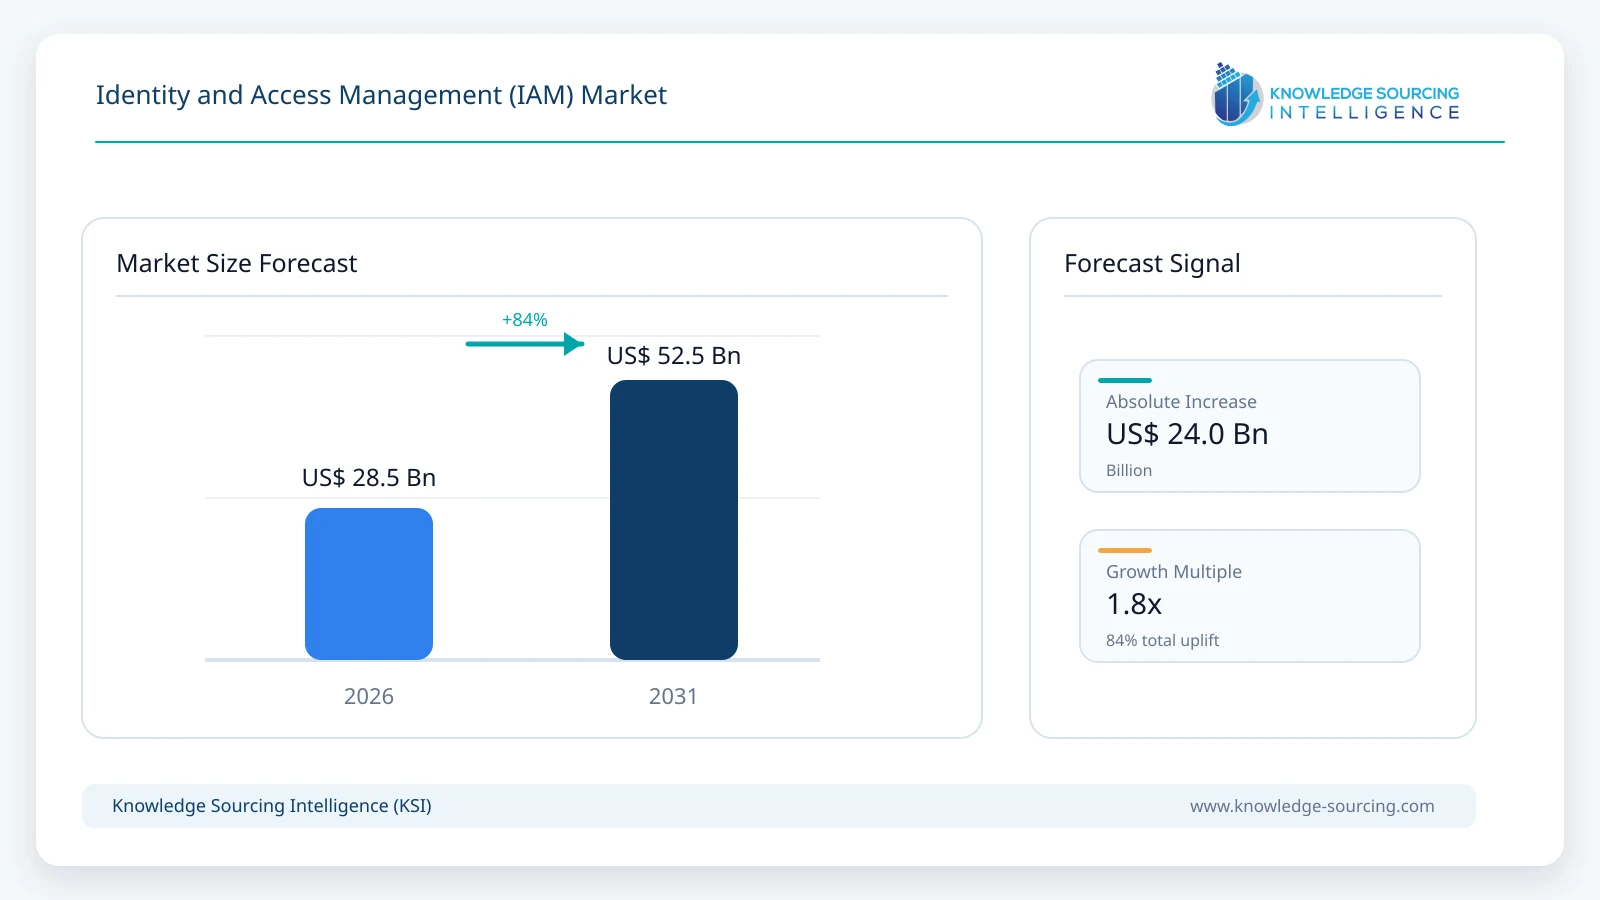
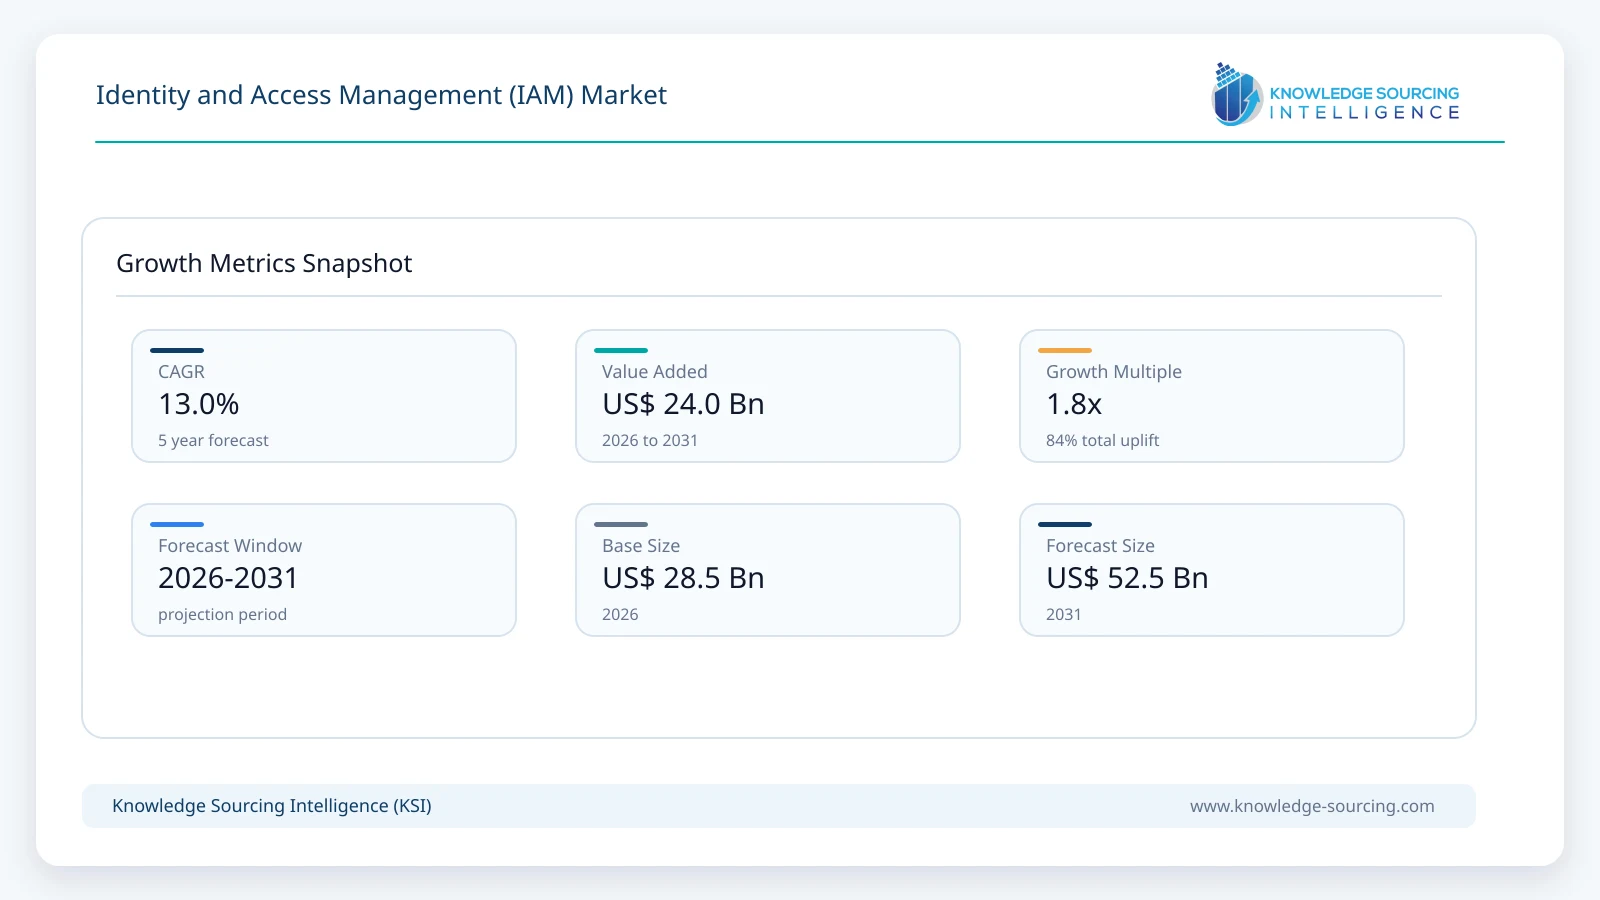
The Identity and Access Management (IAM) Market is forecast to grow at a CAGR of 13.0%, reaching USD 52.5 billion in 2031 from USD 28.5 billion in 2026.
Highlights:
- 1Rising adoption of zero trust security frameworks continues to increase enterprise investment in centralized identity verification and access governance.
- 2Cloud deployment represents the leading implementation model as organizations consolidate identity management across hybrid and multi-cloud environments.
- 3BFSI remains one of the largest demand-generating verticals due to stringent regulatory compliance, fraud prevention requirements, and expanding digital banking services.
- 4Passwordless authentication, adaptive access controls, and AI-assisted identity risk analysis are reshaping enterprise procurement priorities.
- 5Data privacy regulations and cybersecurity mandates are encouraging organizations to strengthen identity governance, privileged access controls, and audit capabilities.
- 6Competition increasingly centers on platform integration, cloud-native architecture, managed identity services, and ecosystem partnerships rather than authentication features alone.
The Identity and Access Management (IAM) market comprises software platforms and associated services that authenticate users, authorize access to digital resources, and govern identities across enterprise networks, cloud environments, applications, devices, and operational technology systems. Organizations rely on IAM to ensure that only verified users and trusted devices can access sensitive information while maintaining compliance with internal security policies and external regulatory requirements. Modern IAM platforms integrate capabilities such as single sign-on (SSO), multi-factor authentication (MFA), privileged access management (PAM), identity governance and administration (IGA), adaptive authentication, passwordless authentication, and lifecycle management into unified security architectures.
Demand for IAM solutions has expanded as organizations continue to distribute applications across public cloud, private cloud, and hybrid infrastructure. Enterprises now manage identities for employees, contractors, partners, customers, and connected machines, substantially increasing the complexity of access governance. Identity has consequently become a primary security control, replacing the traditional reliance on network perimeters. Procurement decisions increasingly prioritize interoperability with existing security infrastructure, automation of user provisioning, risk-based authentication, and support for regulatory reporting rather than standalone authentication functionality.
Enterprise buyers also seek IAM platforms capable of reducing operational overhead while strengthening cyber resilience. Human resource departments, information technology teams, compliance officers, and security operations centers increasingly participate jointly in procurement decisions because identity governance affects workforce onboarding, role management, audit readiness, and incident response. Organizations with geographically distributed operations particularly value centralized identity management that supports consistent policy enforcement across multiple business units and cloud environments.
The supplier ecosystem combines established enterprise software vendors with specialized identity security providers. Competition extends beyond authentication capabilities to include artificial intelligence-assisted risk detection, API integration, developer-friendly identity services, cloud-native deployment, and support for zero trust security architectures. Service providers additionally compete through consulting, implementation, managed identity operations, and continuous compliance monitoring, allowing customers to address skills shortages while accelerating deployment schedules.
Adoption patterns differ across industries according to regulatory obligations and digital maturity. Financial institutions continue to invest heavily in identity governance because of fraud prevention requirements and stringent customer authentication rules. Healthcare organizations prioritize secure clinician access and patient data protection, while government agencies focus on citizen identity services and secure workforce authentication. Manufacturing companies increasingly deploy IAM platforms to manage identities across operational technology environments as industrial automation expands. Retailers and telecommunications providers similarly require scalable identity management to support millions of customer accounts and digital transactions.
Growing software-as-a-service adoption has also shifted purchasing preferences toward subscription-based IAM platforms with continuous feature updates, flexible scalability, and simplified administration. Nevertheless, organizations operating highly regulated or mission-critical environments continue to maintain hybrid deployment strategies that combine cloud-based identity services with on-premise infrastructure to satisfy operational resilience and data sovereignty requirements.
Market Drivers
Expansion of Zero Trust Security Architectures
Organizations are restructuring cybersecurity strategies around continuous identity verification instead of perimeter-based protection. As employees, contractors, and third-party partners access enterprise resources from multiple locations and devices, every access request requires authentication and contextual validation. IAM platforms therefore become foundational components of zero trust implementation.
Enterprise buyers increasingly seek solutions capable of integrating identity governance, privileged access management, endpoint security, and security information and event management platforms. Vendors respond by expanding API connectivity, improving adaptive authentication capabilities, and embedding behavioral analytics into authentication workflows. This integration strengthens customer retention while increasing average contract values through broader platform adoption.
Commercially, zero trust initiatives encourage multi-year procurement programs rather than isolated software purchases, creating recurring revenue opportunities for both software providers and managed security service partners.
Growth of Cloud Applications and Hybrid IT Infrastructure
Organizations now operate business-critical workloads across multiple cloud providers while maintaining legacy on-premise systems. This hybrid operating model creates fragmented identity repositories and inconsistent access policies unless centralized IAM solutions are deployed.
Procurement teams increasingly prioritize identity platforms capable of supporting cloud-native applications alongside traditional enterprise software. Buyers also expect seamless integration with collaboration platforms, enterprise resource planning systems, customer relationship management applications, and developer environments.
Suppliers differentiate themselves by offering cloud-delivered identity services with automated provisioning, scalable authentication infrastructure, and simplified administration. These capabilities reduce implementation complexity and improve operational efficiency, making cloud-based IAM solutions attractive to organizations of varying sizes.
Regulatory Emphasis on Identity Governance and Data Protection
Governments and regulatory authorities continue strengthening cybersecurity and privacy obligations across sectors handling sensitive information. Organizations must demonstrate effective control over user identities, privileged accounts, access approvals, and audit trails during compliance assessments.
This regulatory environment increases demand for identity governance solutions capable of automating access reviews, enforcing segregation of duties, and generating comprehensive compliance reports. Procurement decisions increasingly evaluate governance functionality alongside authentication performance.
Software vendors continue expanding compliance templates, automated reporting capabilities, and policy management features, allowing customers to reduce manual audit preparation while improving operational consistency across regulated environments.
Rising Sophistication of Identity-Based Cyber Threats
Credential theft, phishing campaigns, ransomware attacks, and insider threats increasingly target user identities instead of traditional network infrastructure. Compromised credentials often provide attackers with legitimate access paths, making identity security a strategic investment rather than solely an IT function.
Organizations therefore prioritize multi-factor authentication, privileged session management, continuous authentication, and identity threat detection capabilities. Buyers increasingly evaluate IAM platforms according to their ability to identify abnormal user behavior, automate risk-based responses, and integrate with broader cybersecurity ecosystems.
This evolving threat environment supports continued investment in advanced identity analytics while encouraging vendors to incorporate artificial intelligence into identity verification and anomaly detection processes.
Market Restraints and Challenges
Complex Integration with Legacy Enterprise Systems
Many large enterprises continue operating legacy business applications that were developed before modern identity standards became widely adopted. Integrating these environments with centralized IAM platforms frequently requires customized connectors, extended implementation timelines, and specialized technical expertise.
These challenges increase project costs and delay operational benefits, particularly for organizations with extensive application portfolios. Vendors increasingly address this issue through pre-built integration libraries, migration services, and phased deployment methodologies that reduce implementation risks while preserving business continuity.
Shortage of Skilled Identity Security Professionals
Identity governance projects require expertise across cybersecurity, cloud infrastructure, application integration, regulatory compliance, and enterprise architecture. Many organizations face difficulties recruiting professionals with these multidisciplinary skills, slowing implementation schedules and increasing dependence on external consulting providers.
Managed IAM services have emerged as an important mitigation strategy, allowing organizations to outsource platform administration, policy management, and operational monitoring while maintaining internal oversight of strategic security objectives.
Balancing Security Requirements with User Experience
Organizations must strengthen authentication controls without creating excessive friction for employees, customers, or business partners. Frequent authentication requests, complex password policies, and poorly designed access workflows can reduce productivity and discourage adoption of secure practices.
Procurement teams therefore increasingly evaluate usability alongside security functionality. Vendors respond by introducing passwordless authentication, biometric verification, adaptive authentication policies, and contextual access controls that maintain security while simplifying user interactions.
Major Segment Analysis
Cloud Deployment
Cloud deployment represents the most commercially influential segment within the IAM market because organizations increasingly prefer scalable subscription-based identity platforms that support geographically distributed operations and hybrid infrastructure. Cloud-native IAM solutions enable centralized management of users, applications, and authentication policies without requiring extensive on-premise hardware investments.
Demand is particularly strong among enterprises expanding software-as-a-service adoption and implementing multi-cloud operating models. These organizations require identity platforms capable of maintaining consistent authentication policies across diverse cloud environments while integrating with legacy enterprise applications. Flexibility, rapid deployment, automated updates, and elastic scalability have become important procurement considerations, particularly for businesses experiencing workforce expansion or seasonal fluctuations in user activity.
Competition within this segment increasingly focuses on platform interoperability, uptime reliability, identity analytics, API ecosystems, and managed service capabilities rather than authentication functionality alone. Vendors capable of integrating identity management with broader cybersecurity platforms, developer tools, endpoint protection, and governance solutions strengthen customer retention while expanding recurring subscription revenue.
Although highly regulated sectors continue maintaining certain on-premise identity systems for operational resilience and compliance reasons, hybrid cloud adoption continues to reinforce demand for cloud-based IAM platforms capable of supporting complex enterprise environments. Consequently, cloud deployment remains the principal revenue contributor and the primary area of product innovation across the global Identity and Access Management market.
Regional Analysis
North America
North America represents the most mature regional market for Identity and Access Management solutions due to high enterprise cybersecurity spending, widespread cloud adoption, and stringent regulatory obligations across financial services, healthcare, government, and critical infrastructure. Organizations increasingly invest in identity-centric security architectures as ransomware, credential theft, and insider risks continue to target privileged accounts rather than network perimeters.
Large enterprises remain the primary purchasers of comprehensive IAM platforms, although adoption among mid-sized organizations is accelerating through cloud-based subscription offerings. Procurement decisions increasingly emphasize integration with existing security ecosystems, artificial intelligence-enabled threat detection, and automated governance capabilities. The presence of major technology vendors, cybersecurity innovators, and managed security service providers further strengthens regional demand while encouraging continuous product innovation.
Europe
European demand is strongly influenced by privacy legislation, cybersecurity regulations, and digital identity initiatives. Organizations operating across multiple jurisdictions require IAM platforms capable of supporting complex compliance requirements while maintaining secure access to distributed workforces and business partners.
Financial institutions, public sector organizations, manufacturers, and healthcare providers continue modernizing identity governance to strengthen audit readiness and reduce operational risk. Buyers increasingly evaluate vendors based on data residency capabilities, policy automation, and support for hybrid cloud deployments. While economic uncertainty may delay certain technology investments, identity security generally remains a protected budget category because of regulatory obligations and operational resilience requirements.
Asia Pacific
Asia Pacific is expected to record the fastest expansion in enterprise IAM adoption as governments promote digital public services, enterprises migrate workloads to cloud infrastructure, and businesses expand online customer engagement. China, India, Japan, and South Korea continue investing in cybersecurity infrastructure across banking, telecommunications, manufacturing, and government sectors.
Rapid digitalization has substantially increased the number of digital identities requiring secure administration, including employees, customers, contractors, and connected devices. Enterprises increasingly prefer cloud-delivered IAM platforms because they reduce implementation timelines and simplify management across geographically dispersed operations. However, varying cybersecurity regulations, differing data localization requirements, and uneven cybersecurity maturity across economies create implementation complexity for multinational organizations.
Middle East & Africa and South America
Demand across the Middle East & Africa continues to benefit from national digital government programs, financial sector modernization, and investments in smart infrastructure. Government agencies and regulated industries increasingly prioritize identity governance to strengthen cyber resilience while supporting expanding digital services.
South America demonstrates growing enterprise adoption, particularly within Brazil and Argentina, where financial institutions, telecommunications providers, and retail organizations continue expanding digital customer services. Budget limitations and cybersecurity skills shortages remain important constraints, encouraging greater reliance on managed IAM services and cloud-based deployment models that reduce operational complexity and upfront infrastructure investments.
Competitive Landscape
The Identity and Access Management market remains moderately consolidated, with competition centered on platform breadth, ecosystem integration, cloud-native architecture, and identity intelligence rather than authentication capabilities alone. Enterprise customers increasingly prefer vendors capable of delivering unified identity governance, privileged access management, adaptive authentication, lifecycle administration, and compliance reporting through integrated platforms.
Competition is increasingly shaped by the ability to support hybrid and multi-cloud environments while integrating with broader cybersecurity technologies such as endpoint protection, security information and event management, cloud security, and security orchestration platforms. Vendors also differentiate themselves through developer APIs, artificial intelligence-assisted identity analytics, passwordless authentication, and support for machine identities and non-human accounts.
Strategic partnerships continue to influence competitive positioning as software providers collaborate with cloud service providers, system integrators, and managed security service organizations to accelerate enterprise deployments. Consulting, implementation, and managed identity services have become important competitive differentiators because many customers require assistance with complex migration projects and long-term governance operations.
Companies including Microsoft Corporation, IBM Corporation, Oracle Corporation, Okta, Inc., SailPoint Technologies, Inc., CyberArk Software Ltd., Ping Identity Holding Corp., One Identity LLC, Delinea Inc., Google Cloud, and Cisco Systems, Inc. continue expanding platform interoperability and cloud capabilities to strengthen enterprise retention while addressing increasingly complex identity ecosystems. Competition is expected to intensify as artificial intelligence introduces new categories of machine identities requiring governance comparable to human users.
Recent Developments
June 2026: SailPoint launched Unified Platform Access, expanding its Technology Alliance Partners Program to enable partners to build native identity security applications and accelerate innovation across the SailPoint identity platform.
May 2026: Ping Identity introduced new Identity Control Plane capabilities for the agentic enterprise, adding AI-first identity management, AI agent lifecycle governance, and privileged access controls without exposing sensitive credentials.
March 2026: Okta unveiled its Secure Agentic Enterprise Blueprint and introduced Okta for AI Agents, enabling organizations to discover, govern, authorize, and revoke AI agent identities through a unified IAM framework.
Regulatory and Policy Environment
Identity and Access Management adoption is increasingly influenced by cybersecurity legislation, privacy regulations, and sector-specific compliance frameworks. Organizations handling sensitive financial, healthcare, government, and personal information must demonstrate appropriate authentication controls, access governance, audit logging, and privileged account management to satisfy regulatory expectations.
Data protection regulations require organizations to implement technical measures that prevent unauthorized access while supporting accountability and transparency in identity administration. These obligations have increased investment in automated identity lifecycle management, access certification, segregation-of-duty controls, and comprehensive reporting capabilities that simplify regulatory audits.
Government cybersecurity agencies continue promoting zero trust architectures, stronger authentication standards, and enhanced protection of critical infrastructure. Multi-factor authentication, phishing-resistant credentials, privileged access controls, and continuous identity monitoring increasingly form part of recommended cybersecurity practices for both public and private sector organizations.
Industry standards and security frameworks also influence procurement decisions by encouraging organizations to adopt centralized identity governance capable of supporting continuous compliance across distributed cloud and on-premise environments. As regulatory expectations continue expanding, organizations are expected to integrate identity governance more closely with enterprise risk management and cybersecurity operations.
Outlook and Strategic Implications
Identity security is expected to remain a strategic investment priority as organizations continue expanding cloud adoption, artificial intelligence deployment, and digital business operations. Enterprise procurement is gradually shifting from standalone authentication products toward comprehensive identity security platforms capable of governing employees, contractors, customers, applications, workloads, connected devices, and AI agents through a unified policy framework.
Future investment will increasingly emphasize automation, artificial intelligence-assisted risk analysis, and continuous identity verification. Buyers are expected to prioritize solutions that reduce administrative workloads while strengthening compliance, accelerating user provisioning, and improving visibility into privileged and non-human identities.
Managed IAM services are likely to gain further importance as organizations seek to overcome persistent cybersecurity skills shortages and control operational costs. Subscription-based commercial models, flexible deployment options, and integrated security ecosystems will continue influencing purchasing decisions across enterprises of different sizes.
Competitive differentiation will increasingly depend on platform interoperability, machine identity governance, developer-friendly integration capabilities, and advanced identity analytics rather than basic authentication functionality. Vendors capable of supporting complex hybrid infrastructures while addressing emerging AI-related identity risks are expected to strengthen long-term customer relationships and expand recurring software and services revenue.
Despite favorable demand conditions, implementation complexity, legacy system integration, evolving regulatory requirements, and sophisticated cyber threats will remain important operational risks. Organizations that align IAM investments with broader cybersecurity governance, workforce modernization, and cloud infrastructure strategies will be better positioned to improve operational resilience while maintaining regulatory compliance over the forecast period.
Identity and Access Management (IAM) Market Scope
| Report Metric | Details |
|---|---|
| Total Market Size in 2026 | USD 28.5 billion |
| Total Market Size in 2031 | USD 52.5 billion |
| Forecast Unit | Billion |
| Growth Rate | 13.0% |
| Study Period | 2021 to 2031 |
| Historical Data | 2021 to 2024 |
| Base Year | 2025 |
| Forecast Period | 2026 – 2031 |
| Segmentation | Deployment Model, Service, Vertical, Geography |
| Companies |
|
Market Segmentation
By Deployment Model
By Service
By Vertical
By Geography
Table of Contents
1. EXECUTIVE SUMMARY
2. MARKET SNAPSHOT
2.1. Market Overview
2.2. Market Definition
2.3. Scope of the Study
2.4. Market Segmentation
3. BUSINESS LANDSCAPE
3.1. Market Drivers
3.2. Market Restraints
3.3. Market Opportunities
3.4. Porter’s Five Forces Analysis
3.5. Industry Value Chain Analysis
3.6. Policies and Regulations
3.7. Strategic Recommendations
4. TECHNOLOGICAL OUTLOOK
5. IDENTITY AND ACCESS MANAGEMENT (IAM) MARKET BY DEPLOYMENT MODEL
5.1. Introduction
5.2. On-Premise
5.3. Cloud
6. IDENTITY AND ACCESS MANAGEMENT (IAM) MARKET BY SERVICE
6.1. Introduction
6.2. Integration and Implementation
6.3. Consulting
6.4. Support and Maintenance
6.5. Managed Services
6.6. Others
7. IDENTITY AND ACCESS MANAGEMENT (IAM) MARKET BY VERTICAL
7.1. Introduction
7.2. BFSI
7.3. Government
7.4. Healthcare
7.5. Retail
7.6. IT & Telecom
7.7. Manufacturing
7.8. Energy & Utilities
7.9. Travel & Transportation
7.10. Media & Entertainment
7.11. Others
8. IDENTITY AND ACCESS MANAGEMENT (IAM) MARKET BY GEOGRAPHY
8.1. Introduction
8.2. North America
8.2.1. USA
8.2.2. Canada
8.2.3. Mexico
8.3. South America
8.3.1. Brazil
8.3.2. Argentina
8.3.3. Others
8.4. Europe
8.4.1. United Kingdom
8.4.2. Germany
8.4.3. France
8.4.4. Italy
8.4.5. Spain
8.4.6. Others
8.5. Middle East & Africa
8.5.1. Saudi Arabia
8.5.2. UAE
8.5.3. Others
8.6. Asia Pacific
8.6.1. China
8.6.2. India
8.6.3. Japan
8.6.4. South Korea
8.6.5. Thailand
8.6.6. Others
9. COMPETITIVE ENVIRONMENT AND ANALYSIS
9.1. Major Players and Strategy Analysis
9.2. Market Share Analysis
9.3. Mergers, Acquisitions, Agreements, and Collaborations
9.4. Competitive Dashboard
10. COMPANY PROFILES
10.1. Microsoft Corporation
10.2. IBM Corporation
10.3. Oracle Corporation
10.4. Okta, Inc.
10.5. SailPoint Technologies, Inc.
10.6. CyberArk Software Ltd.
10.7. Ping Identity Holding Corp.
10.8. One Identity LLC
10.9. Delinea Inc.
10.10. Google Cloud
10.11. Cisco Systems, Inc.
11. APPENDIX
11.1. Currency
11.2. Assumptions
11.3. Base and Forecast Years Timeline
11.4. Key Benefits for the Stakeholders
11.5. Research Methodology
11.6. Abbreviations
Navigate
Trusted by the world's leading organizations


