
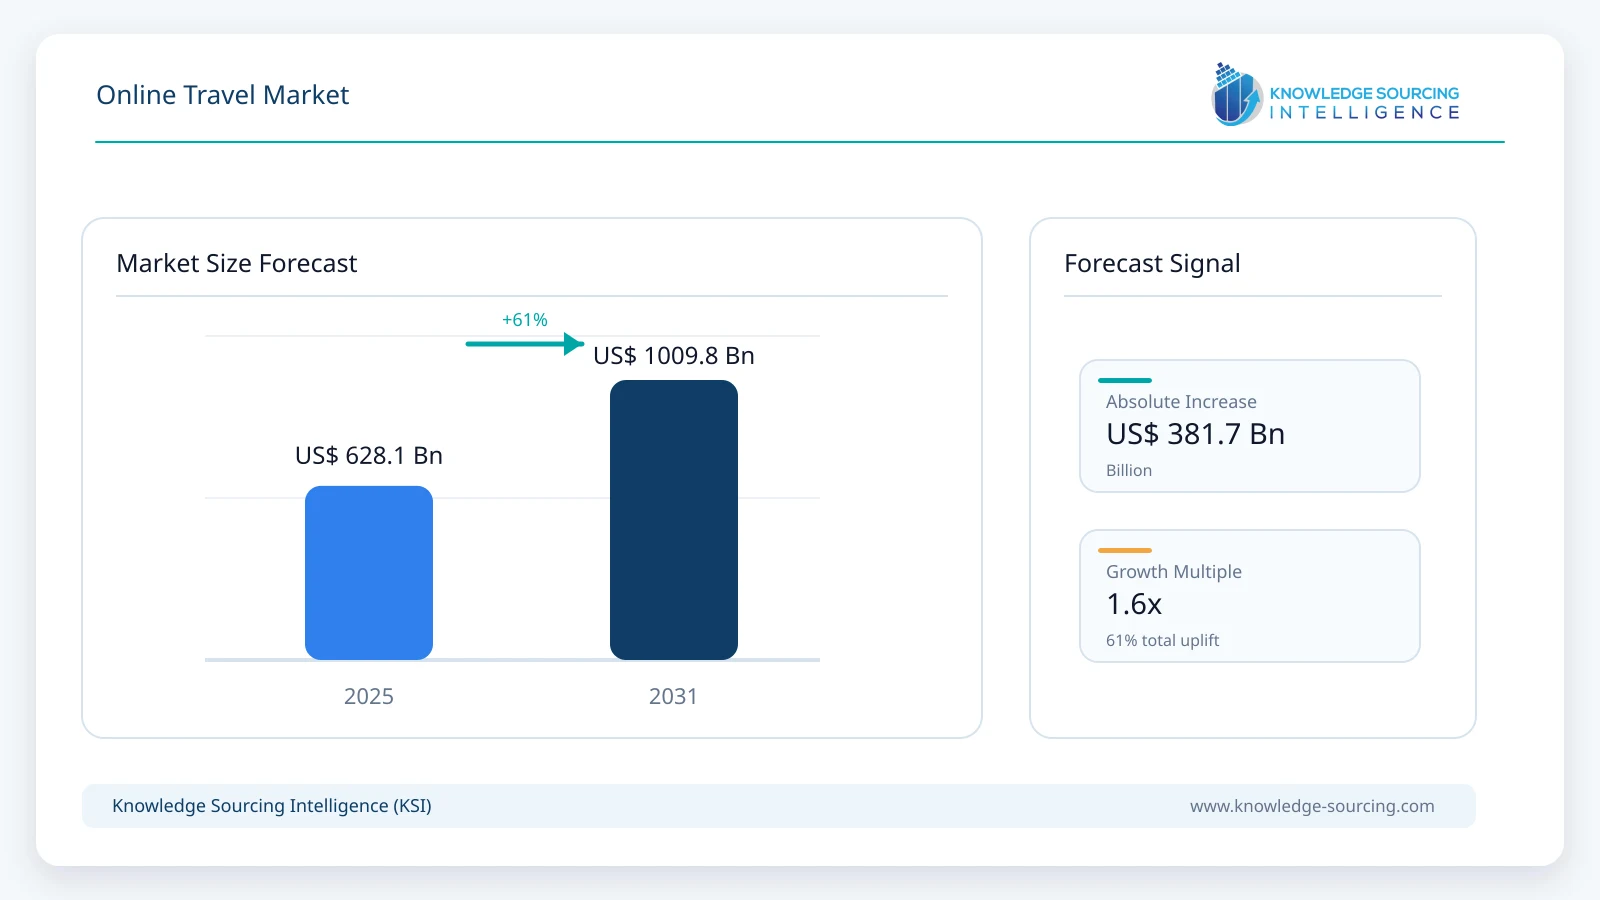
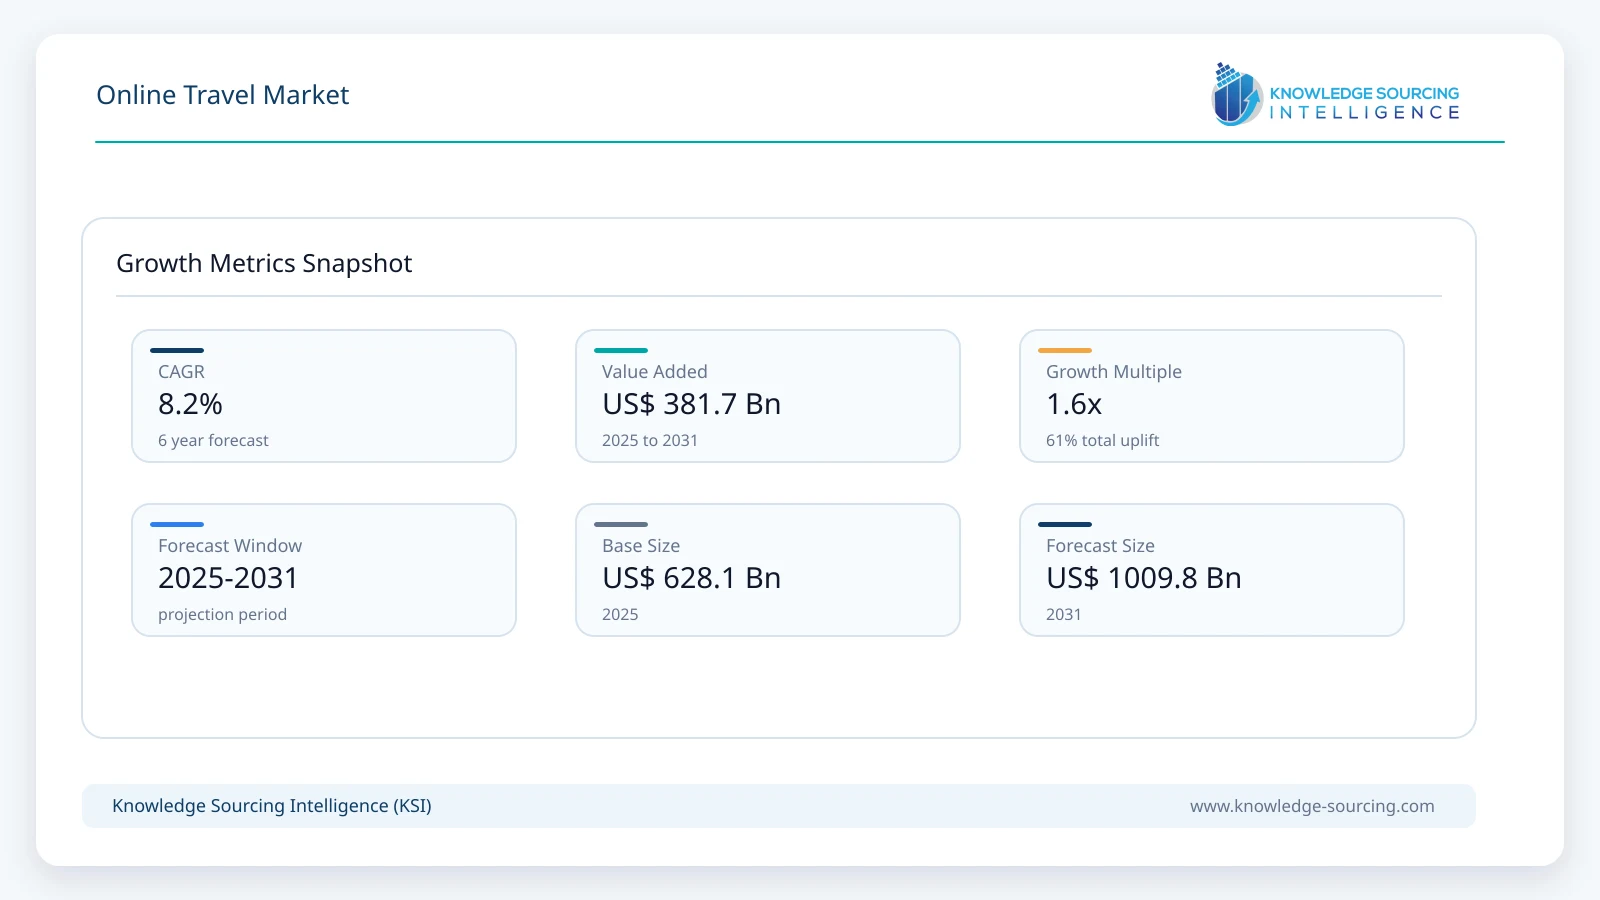
The global online travel market is projected to expand at a CAGR of 8.2%, reaching USD 1,009.8 billion in 2031 from USD 679.9 billion in 2026.
Highlights:
- 1Mobile and tablet bookings account for approximately 68% of global online travel value in 2026.
- 2Hotel and accommodation bookings generate about USD 292.3 billion of online travel value in 2026.
- 3Debit and credit cards account for approximately 55% of online travel transaction value in 2026.
- 4Asia Pacific represents approximately 29% of global online travel value in 2026.
- 5AI is shifting from travel inspiration toward itinerary creation, product comparison and assisted booking.
- 6Platform competition is expanding from single-product bookings toward end-to-end trip ecosystems and loyalty.
Market Overview
For this study, market value represents the gross value of travel services booked through digital consumer channels rather than the net revenue retained by online travel agencies or travel-platform operators. This distinction is necessary because platform revenue generally reflects commissions, merchant margins, advertising and service fees, while the underlying booking value captures the commercial travel transaction itself. The existing KSI segmentation by platform, service type, payment mode and geography remains usable and is therefore retained, with minor terminology cleanup and updated company coverage.
The largest platforms are widening their role across the journey. Booking Holdings continues to develop its Connected Trip model across accommodation, flights, rental cars, restaurants and payments, with AI positioned at the center of the long-term strategy. Expedia Group is integrating AI trip planning into both consumer and B2B channels, while Airbnb is expanding beyond homes into boutique hotels, car rentals, airport pickups, services and experiences. Trip.com Group continues to scale accommodation, transportation and packaged-tour products across Asia and international markets. These strategies increase cross-sell potential and can raise gross booking value per traveler without requiring the same rate of growth in traveler counts.
Market Trends
AI-assisted travel planning is moving closer to the booking transaction
Generative and agentic AI are changing how travelers search and compare options, but trusted travel brands still control most transactions. Expedia Group reported in April 2026 that nearly 70% of surveyed travelers across the United States, United Kingdom and India preferred booking through trusted travel brands rather than AI chatbots or agents, even as AI usage for planning increased. Platforms are responding by embedding AI within existing booking ecosystems rather than treating it only as an external discovery channel. Expedia acquired AI-native trip planner Layla in July 2026, Airbnb expanded AI-powered trip-planning and support functions in its 2026 Summer Release, and Booking Holdings continues to position AI as central to its Connected Trip strategy.
Online travel platforms are broadening into services, mobility and subscription-led ecosystems
The competitive boundary of online travel is widening beyond hotels and flights. Airbnb added car rentals, grocery delivery, airport pickups, boutique hotels and thousands of experiences in its 2026 Summer Release. Expedia Group is expanding ground mobility and B2B travel distribution, while eDreams ODIGEO is extending its Prime subscription model into additional countries and product categories. This changes the unit economics of the market because platforms can increase booking frequency, customer lifetime value, and loyalty by capturing more parts of the same trip. The trend also increases competitive overlap between traditional OTAs, accommodation platforms, mobility companies, airlines and financial-service providers.
Market Drivers
Rising global travel demand and higher online penetration expand transaction value
Global tourism demand remains the fundamental volume driver. UN Tourism estimated 1.52 billion international tourist arrivals in 2025, approximately 60 million more than in 2024, supported by improved air connectivity, visa facilitation and continued recovery in Asia Pacific. Online platforms benefit not only from more trips but also from continued migration away from offline agencies, call centers and fragmented supplier websites. The largest platforms can aggregate global inventory, localized payment methods and customer reviews while reducing search costs for travelers. This supports transaction growth above underlying trip-volume growth, particularly in markets where smartphone penetration and digital payments are still increasing.
Cross-selling, payments and loyalty programs are increasing booking value per customer
Online travel companies are increasingly competing on the share of a traveler's total trip rather than on a single hotel or flight reservation. Booking Holdings' Connected Trip strategy, Expedia's marketplace expansion, Airbnb's move into services and hotels, and eDreams ODIGEO's Prime subscription model all target repeat engagement and broader product attachment. Payments are an important part of this strategy because merchant models, digital wallets, installment options and local payment methods allow platforms to control more of the transaction and personalize offers. Loyalty programs strengthen the same effect by giving travelers an economic reason to consolidate multiple trip components within one ecosystem.
Market Restraint
Customer-acquisition costs, supplier direct channels and AI-led discovery pressure platform economics
The market is growing, but platform economics remain exposed to high traffic-acquisition costs and changes in how travelers discover products. Search engines, social media and AI assistants can influence where users begin trip planning, while airlines and hotel groups continue investing in direct booking, loyalty and member-only pricing. Online travel companies therefore spend heavily on performance marketing, brand advertising and incentives to acquire and retain customers. AI-led discovery adds another layer of uncertainty because a traveler may research through an external assistant and transact elsewhere. Expedia's 2026 research on the 'AI trust gap' shows that trusted brands still retain an advantage at booking, but platforms must continue investing in product quality, loyalty and direct app engagement to protect margins.
Segment Analysis
By Platform - Mobile and Tablet
Mobile and tablet bookings are projected to reach approximately USD 727.1 billion by 2031, supported by app-based loyalty, stored payment credentials, real-time itinerary management and the increasing use of smartphones for in-destination services. Mobile platforms also give travel companies a direct customer relationship that reduces dependence on paid search and enables push notifications, location-aware offers and in-trip cross-selling. The segment is expected to expand faster than desktop booking because emerging-market users often access the internet primarily through smartphones, while established travelers increasingly manage complete trips through apps. Computers remain important for complex itinerary research and higher-consideration corporate or long-haul travel, but their share of transaction value is expected to decline gradually.
By Service Type - Hotels and Accommodation
Hotels and accommodation remain the largest service category and are projected to grow at approximately 8.0% annually between 2026 and 2031. Accommodation economics favor online intermediation because inventory is fragmented across global chains, independent hotels, vacation rentals and boutique properties, making search, comparison and reviews valuable to travelers. Booking Holdings generated most of its 2025 gross-booking growth from accommodation and flights, while Airbnb recorded USD 91.3 billion in gross booking value across homes and its expanding services ecosystem. The category is also broadening as Airbnb adds boutique hotels and traditional OTAs expand alternative accommodation supply. Flights remain the next major transaction pool but generally provide lower margins and less product differentiation than accommodation.
By Payment Mode - Debit and Credit Cards
Debit and credit cards remain the largest payment method, but their share is projected to decline to approximately 52% by 2031 as digital wallets, instant bank payments and country-specific methods gain adoption. Cards retain advantages in cross-border acceptance, chargeback protection, rewards and high-value travel purchases, which makes them difficult to displace entirely. However, platforms are integrating more local payment methods to improve conversion in markets where card penetration is lower or travelers prefer mobile wallets and bank-linked payment systems. UPI in India, digital wallets across Asia and alternative installment options are therefore growing faster than the overall market, particularly for mobile bookings.
By Geography - Asia Pacific
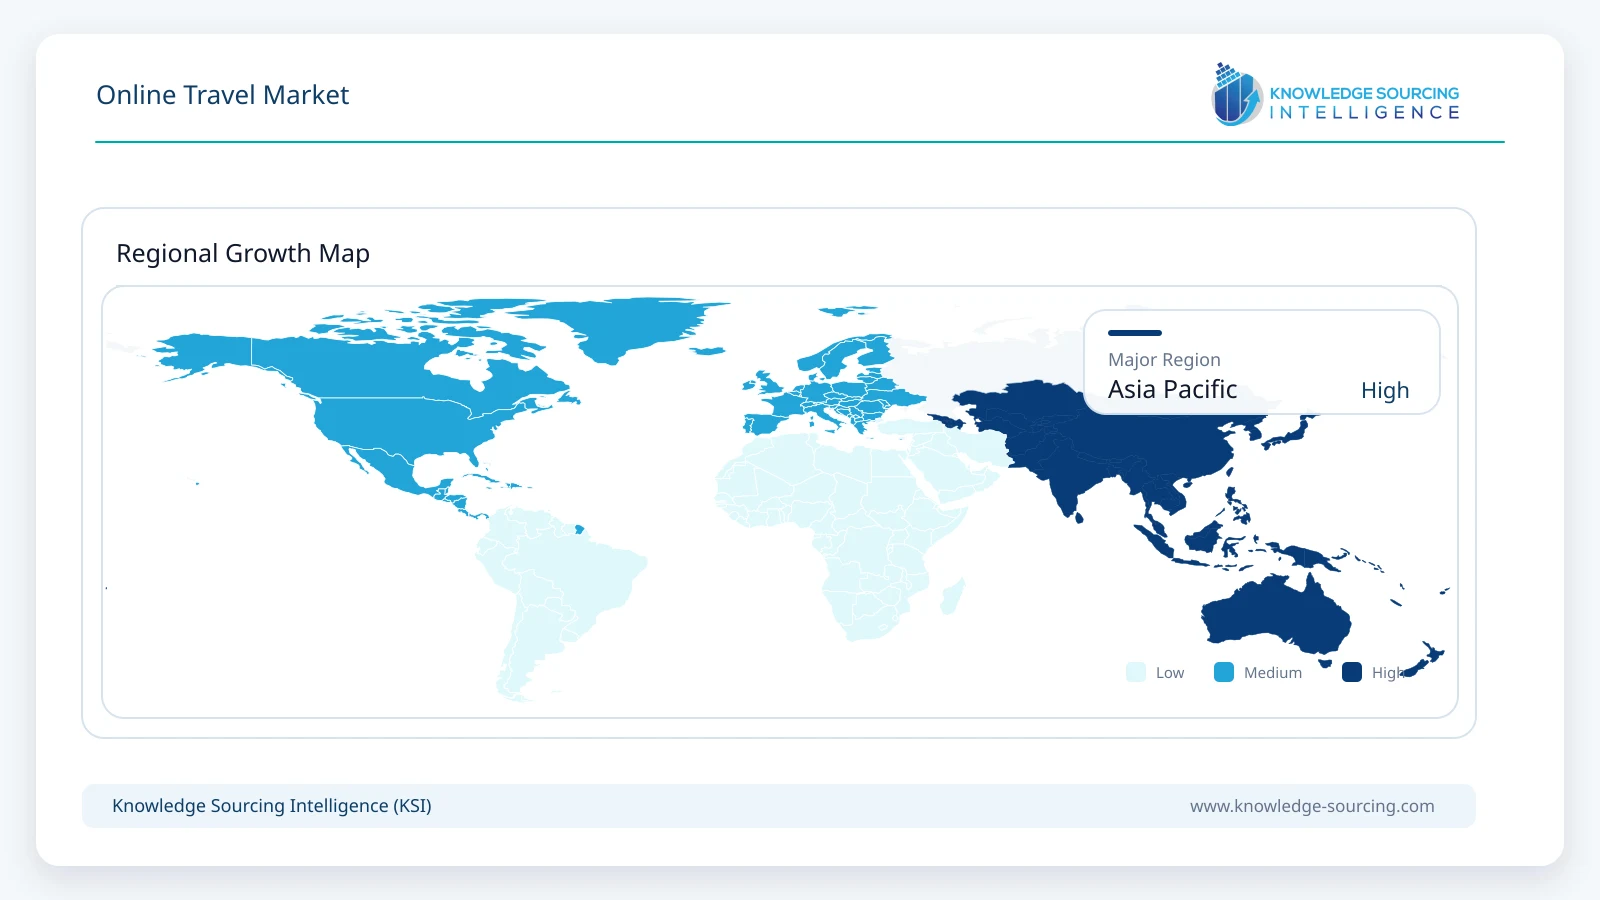
Asia Pacific is projected to grow at approximately 10.0% annually through 2031, faster than the global market. The region combines large domestic travel markets in China and India with strong outbound growth, improving air connectivity and rising online booking penetration across Southeast Asia. Trip.com Group reported 17% revenue growth in 2025, including 21% growth in accommodation revenue, while Airbnb's Asia Pacific gross booking value grew 16% in 2025. India is also producing strong online-travel search interest and mobile-payment adoption, while Indonesia, Thailand and Vietnam benefit from inbound tourism and expanding digital commerce. North America and Europe remain larger mature online-travel markets in absolute transaction value but grow more slowly because digital penetration is already high.
Competitive Environment
The market is led by a small group of scaled global platforms but remains fragmented across regional OTAs, metasearch, vacation rentals and specialist booking services. Booking Holdings, Expedia Group, Airbnb and Trip.com Group operate at global scale, while MakeMyTrip is a major player in India, Despegar remains a leading Latin American platform under Prosus, and eDreams ODIGEO has built a differentiated subscription-led position in Europe. Traveloka, Yatra, EaseMyTrip, lastminute.com, Hopper and Kiwi.com compete through regional strength, mobile products, price comparison or specialized booking propositions.
Competitive advantage increasingly comes from supply breadth, direct customer traffic, loyalty, payments, AI-assisted planning and the ability to cross-sell multiple travel products. Booking Holdings reported USD 186.1 billion in 2025 gross bookings, Expedia Group's Q2 2026 gross bookings reached USD 33.9 billion, and Airbnb generated USD 56.4 billion of gross booking value in the first half of 2026. These scale advantages fund product development and marketing, but regional platforms can remain competitive where local inventory, language, payment methods, or customer support create barriers to global standardization.
Recent Developments
August 2026: eDreams ODIGEO scaled its Prime subscription platform in Poland as part of its broader international expansion toward more than 13 million members by March 2030.
July 2026: Expedia Group acquired AI-native trip-planning platform Layla to strengthen conversational travel discovery, itinerary creation and booking.
June 2026: Air India and Booking.com partnered to offer integrated accommodation booking and traveler rewards through Air India's digital channels.
May 2026: Airbnb expanded beyond homes with car rentals, grocery delivery, airport pickups, boutique hotels and additional AI-powered trip-planning tools.
May 2026: Expedia Group introduced new AI-powered consumer and B2B travel experiences, including natural-language planning and an Intelligent Experience Platform for partners.
Online Travel Market Scope:
| Report Metric | Details |
|---|---|
| Total Market Size in 2026 | USD 679.9 billion |
| Total Market Size in 2031 | USD 1009.8 billion |
| Forecast Unit | Billion |
| Growth Rate | 8.2% |
| Study Period | 2021 to 2031 |
| Historical Data | 2021 to 2024 |
| Base Year | 2025 |
| Forecast Period | 2026 – 2031 |
| Segmentation | Platform, Service Type, Payment Mode, Geography |
| Companies |
|
Market Segmentation
By Platform
Mobile and Tablet
Computers
By Service Type
Hotels and Accommodation
Flights
Vacation Packages
Cars and Ground Mobility
Cruises and Experiences
Others
By Payment Mode
Debit and Credit Cards
UPI and Instant Bank Payments
E-Wallets
Others
By Geography
North America
USA
Canada
Mexico
South America
Brazil
Argentina
Others
Europe
Germany
France
United Kingdom
Spain
Italy
Others
Middle East and Africa
Saudi Arabia
UAE
South Africa
Others
Asia Pacific
China
India
Japan
South Korea
Indonesia
Thailand
Vietnam
Others
Table of Contents
1. EXECUTIVE SUMMARY
2. MARKET SNAPSHOT
2.1. Market Overview
2.2. Market Definition
2.3. Market Segmentation
3. BUSINESS LANDSCAPE
3.1. Market Drivers
3.1.1. Rising Global Travel Demand and Higher Online Penetration Expand Transaction Value
3.1.2. Cross-Selling, Payments and Loyalty Programs Increase Booking Value per Customer
3.2. Market Restraint
3.2.1. Customer-Acquisition Costs, Supplier Direct Channels and AI-Led Discovery Pressure Platform Economics
3.3. Market Opportunities
3.4. Porter's Five Forces Analysis
3.5. Industry Value Chain Analysis
3.6. Policies and Regulations
3.7. Strategic Recommendations
4. TECHNOLOGICAL OUTLOOK
4.1. AI-Assisted Travel Planning and Agentic Booking
4.2. Mobile-First Booking and In-Trip Services
4.3. Digital Payments, Loyalty and Subscription Models
5. ONLINE TRAVEL MARKET BY PLATFORM
5.1. Introduction
5.2. Mobile and Tablet
5.3. Computers
6. ONLINE TRAVEL MARKET BY SERVICE TYPE
6.1. Introduction
6.2. Hotels and Accommodation
6.3. Flights
6.4. Vacation Packages
6.5. Cars and Ground Mobility
6.6. Cruises and Experiences
6.7. Others
7. ONLINE TRAVEL MARKET BY PAYMENT MODE
7.1. Introduction
7.2. Debit and Credit Cards
7.3. UPI and Instant Bank Payments
7.4. E-Wallets
7.5. Others
8. ONLINE TRAVEL MARKET BY GEOGRAPHY
8.1. Introduction
8.2. North America
8.2.1. USA
8.2.2. Canada
8.2.3. Mexico
8.3. South America
8.3.1. Brazil
8.3.2. Argentina
8.3.3. Others
8.4. Europe
8.4.1. Germany
8.4.2. France
8.4.3. United Kingdom
8.4.4. Spain
8.4.5. Italy
8.4.6. Others
8.5. Middle East and Africa
8.5.1. Saudi Arabia
8.5.2. UAE
8.5.3. South Africa
8.5.4. Others
8.6. Asia Pacific
8.6.1. China
8.6.2. India
8.6.3. Japan
8.6.4. South Korea
8.6.5. Indonesia
8.6.6. Thailand
8.6.7. Vietnam
8.6.8. Others
9. COMPETITIVE ENVIRONMENT AND ANALYSIS
9.1. Major Players and Strategy Analysis
9.2. Market Share Analysis
9.3. Mergers, Acquisitions, Agreements and Collaborations
9.4. Competitive Dashboard
10. COMPANY PROFILES
10.1. Booking Holdings Inc.
10.2. Expedia Group, Inc.
10.3. Airbnb, Inc.
10.4. Trip.com Group Limited
10.5. MakeMyTrip Limited
10.6. Prosus
10.7. eDreams ODIGEO
10.8. Traveloka
10.9. Yatra Online, Inc.
10.10. EaseMyTrip
10.11. lastminute.com group
10.12. Hopper Inc.
10.13. Kiwi.com s.r.o.
10.14. Rakuten Group, Inc. (Rakuten Travel)
10.15. Alibaba Group Holding Limited (Fliggy)
10.16. Seera Group
11. APPENDIX
11.1. Currency
11.2. Assumptions
11.3. Base and Forecast Years Timeline
11.4. Key Benefits for Stakeholders
11.5. Research Methodology
11.6. Abbreviations
Navigate
Trusted by the world's leading organizations











