Report Overview
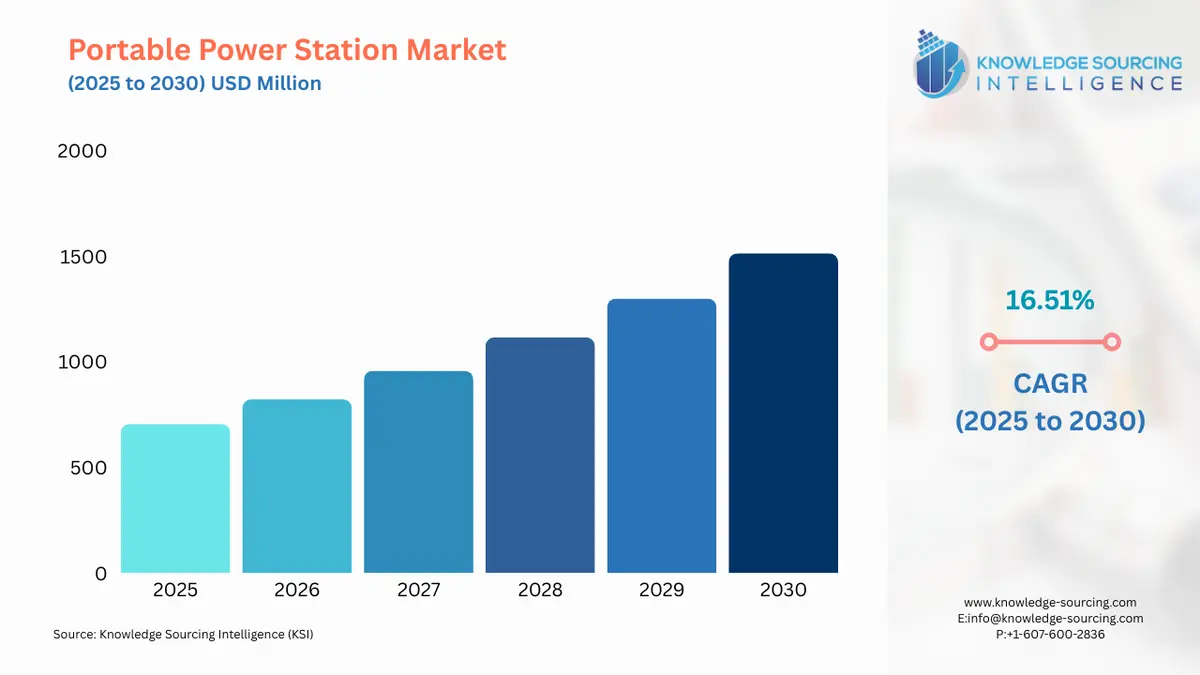
Portable Power Station Market Size:
Portable Power Station Market, growing at a 16.51% CAGR, is projected to achieve USD 1,512.943 million by 2030 from USD 704.803 million in 2025.
Portable power stations are portable devices that are used to provide electrical power in situations where traditional power sources are unavailable or unreliable. They are essentially large rechargeable battery packs with various input/output ports for charging and powering electronic devices. These portable power stations can be used in a variety of situations such as camping trips, outdoor events, and during power outages and are also popular among outdoor enthusiasts who need a reliable source of power to charge their phones, laptops, and other electronic devices while away from home. The primary advantages of using portable power stations are their portability, ease of use, and versatility. They are also environmentally friendly compared to gas-powered generators and are much quieter in operation. With the growth of outdoor activities such as camping, tailgating, and outdoor events, people are looking for reliable and convenient power sources to power their devices and appliances. Portable power stations offer a convenient and easy-to-use solution to this problem. Additionally, the growth of renewable power sources, advancements in battery technology, etc. are a few more factors behind the growth of the portable power stations market.
Portable Power Station Market Growth Drivers:
- The growing travel and tourism sector plays a pivotal role in propelling the expansion of the portable power station market.
Portable power stations are an essential tool for the travel and tourism industry as they provide a convenient and reliable source of power for travellers who want to stay connected and comfortable while on the go. Portable power stations are an eco-friendly alternative to gas-powered generators, making them an excellent choice for eco-tourism as they allow travellers to enjoy nature while minimizing their impact on the environment. Thus, the growing travel and tourism industry is likely to boost the growth of the portable power station market. According to the World Travel and Tourism Council, the travel and tourism industry has witnessed an increase in its contribution to the global GDP, rising by US$ 1 trillion in 2021 also the travel and tourism industry's contribution to the global GDP also increased to 6.1% for the same year. Additionally, the data shows that in 2021, there was a 28% increase in travel and tourism GDP change in Europe and 23.5% in Africa. The Asia Pacific region and the Middle East recorded a 16.0% and 15.9% increase, respectively, in 2021. Therefore, the ongoing expansion of the travel and tourism industry is likely to boost demand for portable power stations, resulting in promising growth for the global portable power stations market.
Portable Power Station Market Geographical Outlook:
- The portable power stations market exhibits the highest growth potential in the North American region due to increased camping activities in the region.
Portable power stations are highly useful in camping as they provide a convenient and reliable source of power for a variety of camping equipment, including lights, heaters, fans, portable stoves, and charging electronic devices and eliminate the need for a noisy and polluting generator, making them an eco-friendly alternative. They are compact and lightweight, making them easy to transport and store, and they typically offer multiple charging options, including solar panels, car adapters, and wall outlets, ensuring that campers can always keep their devices charged even in remote locations. Thus, the growing trend of camping activities in this region will boost the growth of the portable power stations market. For instance, according to the KOA North American Camping Report, the number of active campers went up from 82,291,200 in 2020 to 93,819,400 in 2022. The same source also indicates that the overall camping incidence increased from 67% in 2020 to 71% in 2021 in the United States of America. During 2021, approximately 57 million households went on at least one camping trip, which represents a notable increase from the 48.2 million households that did so in 2020 and the 42 million households in 2019. This report also indicates that the percentage of new camper households increased from 4% in 2019 to 16% in 2021. KOA data also indicates that the number of campers in Canada in 2021 was recorded at around 5 million. Therefore, the increasing popularity of camping in North America is a key factor contributing to the potential growth of the portable power stations market in the region.
Segmentation
- PORTABLE POWER STATIONS MARKET BY BATTERY TYPE
- Lead Acid
- Lithium Ion
- Others
- PORTABLE POWER STATIONS MARKET BY POWER CAPACITY
- Up to 200 W
- 200 to 500 W
- Greater than 500 W
- PORTABLE POWER STATIONS MARKET BY DISTRIBUTION CHANNEL
- Online
- Offline
- Retail Stores
- Specialty Stores
- PORTABLE POWER STATIONS MARKET BY APPLICATION
- Emergency Power
- Off-Grid Power
- PORTABLE POWER STATIONS MARKET BY END-USER
- Residential
- Commercial
- PORTABLE POWER STATIONS MARKET BY GEOGRAPHY
- North America
- USA
- Canada
- Mexico
- South America
- Brazil
- Argentina
- Others
- Europe
- Germany
- France
- United Kingdom
- Spain
- Others
- Middle East and Africa
- Saudi Arabia
- UAE
- Israel
- Others
- Asia Pacific
- China
- India
- Japan
- South Korea
- Indonesia
- Taiwan
- Others
- North America
Market Segmentation
By Battery Type
By Power Capacity
By Distribution Channel
By Application
By End-user
By Geography
Table of Contents
1. EXECUTIVE SUMMARY
2. MARKET SNAPSHOT
2.1. Market Overview
2.2. Market Definition
2.3. Scope of the Study
2.4. Market Segmentation
3. BUSINESS LANDSCAPE
3.1. Market Drivers
3.2. Market Restraints
3.3. Market Opportunities
3.4. Porter’s Five Forces Analysis
3.5. Industry Value Chain Analysis
3.6. Policies and Regulations
3.7. Strategic Recommendations
4. TECHNOLOGICAL OUTLOOK
5. PORTABLE POWER STATIONS MARKET BY BATTERY TYPE
5.1. Introduction
5.2. Lead Acid
5.3. Lithium Ion
5.4. Others
6. PORTABLE POWER STATIONS MARKET BY POWER CAPACITY
6.1. Introduction
6.2. Up to 200 W
6.3. 200 to 500 W
6.4. Greater than 500 W
7. PORTABLE POWER STATIONS MARKET BY DISTRIBUTION CHANNEL
7.1. Introduction
7.2. Online
7.3. Offline
7.3.1. Retail Stores
7.3.2. Specialty Stores
8. PORTABLE POWER STATIONS MARKET BY APPLICATION
8.1. Introduction
8.2. Emergency Power
8.3. Off-Grid Power
9. PORTABLE POWER STATIONS MARKET BY END-USER
9.1. Introduction
9.2. Residential
9.3. Commercial
10. PORTABLE POWER STATIONS MARKET BY GEOGRAPHY
10.1. Introduction
10.2. North America
10.2.1. USA
10.2.2. Canada
10.2.3. Mexico
10.3. South America
10.3.1. Brazil
10.3.2. Argentina
10.3.3. Others
10.4. Europe
10.4.1. Germany
10.4.2. France
10.4.3. United Kingdom
10.4.4. Spain
10.4.5. Others
10.5. Middle East and Africa
10.5.1. Saudi Arabia
10.5.2. UAE
10.5.3. Israel
10.5.4. Others
10.6. Asia Pacific
10.6.1. China
10.6.2. India
10.6.3. Japan
10.6.4. South Korea
10.6.5. Indonesia
10.6.6. Taiwan
10.6.7. Others
11. COMPETITIVE ENVIRONMENT AND ANALYSIS
11.1. Major Players and Strategy Analysis
11.2. Market Share Analysis
11.3. Mergers, Acquisitions, Agreements, and Collaborations
11.4. Competitive Dashboard
12. COMPANY PROFILES
12.1. Jackery Inc.
12.2. EcoFlow Technology Inc.
12.3. Anker SOLIX
12.4. Bluetti Power
12.5. Milwaukee Electric Tool Corporation
12.6. Inergy
12.7. Zendure US USA Inc.
12.8. Mango Power Tech Inc.
12.9. Marxon
12.10. Duracell Inc.
12.11. Lion Energy
13. APPENDIX
13.1. Currency
13.2. Assumptions
13.3. Base and Forecast Years Timeline
13.4. Key benefits for the stakeholders
13.5. Research Methodology
13.6. Abbreviations
LIST OF FIGURES
LIST OF TABLES
Navigate
Trusted by the world's leading organizations


