
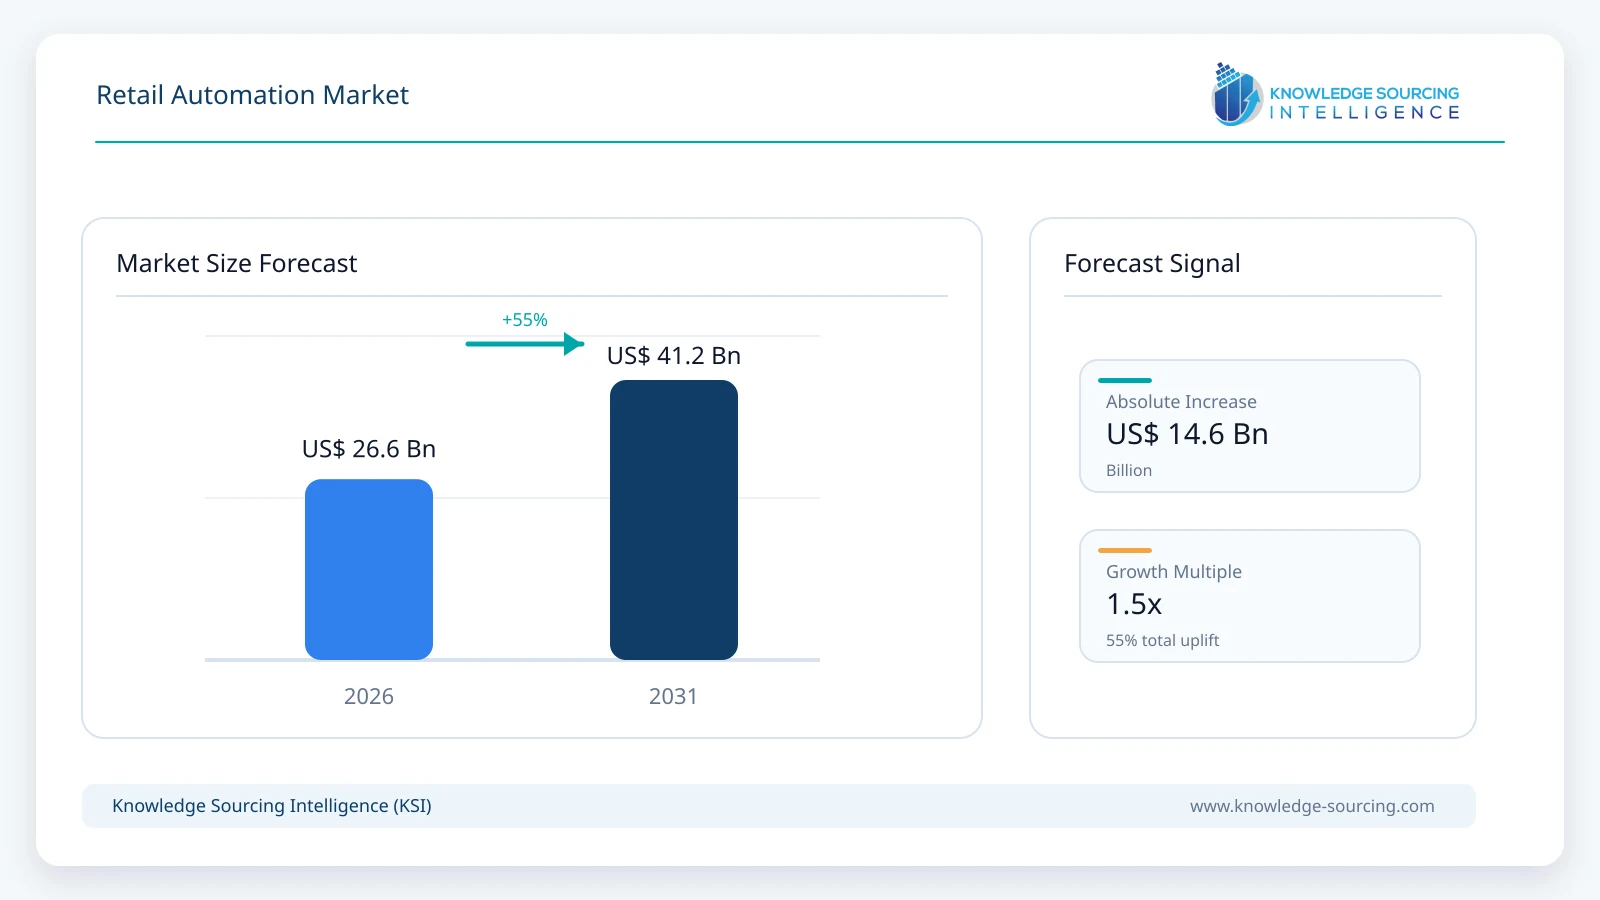
The global retail automation market is estimated at USD 26.6 billion in 2026 and is projected to reach USD 41.2 billion by 2031, representing a CAGR of 9.1% during 2026-2031.
Highlights:
- 1Hardware accounts for an estimated 60% of 2026 market value, while software is the faster-growing component at about 12.0% CAGR.The shift toward SaaS, AI, analytics and orchestration gradually increases software's share of total spending.
- 2Supermarkets and hypermarkets account for an estimated 42% of 2026 demand.Their transaction volumes, SKU complexity, labor intensity and fulfillment requirements support broad adoption across checkout, inventory, shelf and warehouse systems.
- 3Integration cost and operational complexity are becoming more important constraints than hardware availability.Retailers increasingly evaluate whether automation can integrate with legacy POS, ERP, inventory, payment and omnichannel systems without disrupting live store operations.
Retail automation is shifting from isolated checkout and scanning hardware toward connected store, fulfillment and software platforms that combine AI, IoT, robotics, inventory intelligence and automated commerce across physical and digital retail operations.
The market covers hardware and software used specifically to automate retail operations, including point-of-sale and self-checkout systems, vending and kiosk systems, barcode and RFID infrastructure, electronic shelf and inventory technologies, robotics, automated storage and retrieval systems, payment and inventory software, computer vision, AI-enabled store systems and retail fulfillment automation. General-purpose enterprise software, advertising revenue, payment interchange, broad public-cloud revenue and industrial automation not directly attributable to retail operations are excluded to limit double counting.
Retailers are automating because labor economics, inventory accuracy and fulfillment speed increasingly favor connected systems. Walmart has linked its automation program to roughly 65% of stores being serviced by automation, about 55% of fulfillment-center volume moving through automated facilities and potential unit-cost improvement of around 20%. Amazon has deployed more than one million robots across over 300 facilities and says DeepFleet can improve robot travel efficiency by about 10%.
Retail Automation Market Segmentation Dashboard
The table below summarizes the largest and fastest-growing segments across the principal market dimensions.
Segmentation | Largest segment in 2026 | 2026 share | 2026 value | Fastest-growing segment | CAGR, 2026-2031 |
|---|---|---|---|---|---|
By Component | Hardware | 60% | USD 16.0 billion | Software | 12.0% |
By Product | RFID | 29% | USD 7.7 billion | Robotics | 13.1% |
By Technology | Internet of Things (IoT) | 46% | USD 12.2 billion | Artificial Intelligence (AI) | 14.4% |
By Application | Supermarket & Hypermarket | 42% | USD 11.2 billion | Specialty Stores | 10.8% |
By Geography | North America | 34% | USD 9.0 billion | Asia Pacific | 11.6% |
Major Segment Analysis
Hardware Leads with an Estimated 60% Share of 2026 Market Value
Hardware remains largest because automation still requires POS terminals, self-checkout stations, scanners, cameras, RFID readers, shelf infrastructure and robots. Zebra Technologies reported USD 4.42 billion of tangible-product sales in 2025 versus USD 978 million of services and software across its broader business, while Vusion generated EUR 1.53 billion of adjusted revenue with EUR 211 million from value-added software and services.
Software grows faster as retailers move toward cloud deployment, AI analytics, inventory optimization and unified commerce. NCR Voyix's Retail business generated USD 1.84 billion in 2025, including USD 591 million of software revenue and USD 754 million of services revenue. Software is expected to rise from about 40% of market value in 2026 to approximately 45% by 2031.
RFID Leads Named Product Categories; Robotics Grows Fastest at 13.1%
RFID is the largest named product category because item identification and inventory visibility support replenishment, loss prevention and fulfillment. Datalogic reported EUR 500.1 million of 2025 revenue across barcode, mobile computing, RFID, sensors and automation, while Pricer has delivered more than 380 million electronic shelf labels to over 28,000 stores.
Robotics is the fastest-growing product category at approximately 13.1% CAGR. Amazon's one-million-robot fleet and AutoStore's more than 1,950 systems in 65+ countries show that robotic fulfillment has moved beyond pilot-stage adoption.
IoT Is Largest Today; AI Is the Fastest-Growing Technology
Connected scanners, shelves, cameras, RFID readers, POS devices and warehouse systems make IoT the largest enabling-technology category at approximately 46% of 2026 market value. AI grows faster because it increasingly sits above this connected-device layer to interpret images, forecast demand, optimize inventory, detect loss, personalize offers and coordinate robots.
The transition is visible in product strategies. NCR Voyix embeds computer vision and machine learning into self-checkout; Vusion combines intelligent shelf infrastructure, computer vision, AI and real-time retail data; Amazon's DeepFleet AI coordinates the movement of more than one million robots. AI is therefore projected to grow at about 14.4% CAGR through 2031, materially faster than the overall market.
Supermarkets and Hypermarkets Account for an Estimated 42% of 2026 Demand
Large grocery formats combine high transaction volumes, extensive SKU counts, labor-intensive shelf operations, shrink risk and rapidly growing omnichannel fulfillment. This creates demand across nearly every automation category, including self-checkout, POS, electronic shelf labels, RFID, inventory software, computer vision and warehouse robotics.
Recent deployments illustrate the scale. Vusion's March 2026 Walmart Mexico agreement covers all Walmart Express stores and planned Supercenter expansion, including more than 1.7 million electronic shelf labels and over 180,000 smart rails in the initial deployment. Instacart is also expanding Caper smart carts and connected-store technology among grocery customers.
Market Drivers and Restraints
Market factor | Direction | Impact | Time horizon | Most exposed areas |
|---|---|---|---|---|
Labor productivity and cost-to-serve pressure | Driver | 5/5 - Very High | 2026-2031 | Checkout, fulfillment, inventory |
AI, computer vision and agentic commerce | Driver | 5/5 - Very High | 2026-2031 | Software, checkout, pricing, customer experience |
Omnichannel and rapid fulfillment | Driver | 5/5 - Very High | 2026-2031 | Robotics, AS/RS, inventory systems |
Inventory accuracy and shrink reduction | Driver | 4/5 - High | Medium-long term | RFID, computer vision, shelf intelligence |
Integration cost and legacy-system complexity | Restraint | 4/5 - High | 2026-2031 | SMEs, multi-format retailers |
Privacy, cybersecurity and AI governance | Restraint | 3/5 - Material | Medium-long term | Computer vision, personalization, dynamic pricing |
Impact scale: 1/5 indicates a limited effect, 3/5 a material influence on major applications, and 5/5 a structural force capable of changing retailer investment, operating models or automation adoption.
Automation Is Increasingly Justified by Measurable Productivity
Retailers are moving beyond experimental automation toward operating models tied to throughput and cost. Walmart's automation plan linked automated distribution and fulfillment directly with an expected improvement of roughly 20% in average unit costs. Amazon says DeepFleet can reduce robot travel time by 10%. These are operational outcomes rather than generic technology claims, and they strengthen the investment case for retailers with sufficiently large transaction or fulfillment volumes.
AI Is Expanding Automation from Operations into the Shopping Journey
Automation is no longer limited to physical processes. In January 2026, Walmart and Google announced integration between Walmart's shopping capabilities and Gemini using the Universal Commerce Protocol, enabling product discovery, personalization and purchase journeys to move directly into an AI interface. Google separately introduced UCP as an open protocol for agentic commerce and native checkout across AI surfaces.
Integration Complexity Remains a Major Adoption Barrier
The difficult part of retail automation is increasingly integration rather than access to devices. New systems must coexist with POS, ERP, payment, inventory, loyalty, workforce and e-commerce platforms while stores remain operational. This favors vendors offering modular APIs, cloud-to-edge deployment and managed support. It also explains why smaller retailers increasingly prefer SaaS and partner-led deployment instead of large upfront transformation programs.
Geographic Intelligence
Region | 2026 share | 2026 value | Market signal |
|---|---|---|---|
North America | 34% | USD 9.0 billion | Largest market; high labor costs, retailer scale and early automation adoption |
Europe | 29% | USD 7.7 billion | Strong electronic shelf, self-service and warehouse automation base |
Asia Pacific | 28% | USD 7.4 billion | Fastest-growing region at ~11.6% CAGR; e-commerce scale and store digitalization |
South America | 5% | USD 1.3 billion | Growing connected-store and modern-format retail investment |
Middle East & Africa | 4% | USD 1.1 billion | Selective high-growth adoption in modern retail and logistics hubs |
North America leads because large retailers have the capital and fulfillment volumes required to justify automation at scale. Asia Pacific grows fastest as e-commerce expansion and modern-store investment increase automation intensity. Regional shares are derived from vendor revenue distribution, retailer deployments and technology intensity rather than retail sales alone.
Competitive Intelligence
Company | Current disclosed position | Strategic signal |
|---|---|---|
NCR Voyix | USD 1.84 billion Retail revenue in 2025; USD 591 million software revenue | Shift toward cloud-to-edge unified commerce, SaaS and software-led economics |
Diebold Nixdorf | USD 1.01 billion Retail revenue in 2025 | Large installed base across checkout, self-service and distributed retail IT |
Toshiba Tec | Retail Solutions business operating around JPY 350 billion annual sales scale | Global POS, checkout and ELERA platform integration |
Vusion | EUR 1.53 billion adjusted revenue in 2025; value-added services doubled to EUR 211 million | Connected-store platform combining digital shelves, AI and retail data |
AutoStore | More than 1,950 systems in 65+ countries; USD 538.6 million 2025 revenue | High-density automated fulfillment and software-orchestrated storage |
Zebra Technologies | USD 5.40 billion total 2025 sales across data capture, mobile computing, machine vision and software | Broad enterprise device and workflow platform with retail as a major end market |
Competition is moving from individual products toward platform control. Hardware remains essential, but software, orchestration, analytics and managed deployment increasingly determine customer lifetime value. NCR Voyix's hardware outsourcing and Vusion's rapid value-added-service growth illustrate the shift.
Recent Developments and Market Impact
Development | Date | Market implication |
|---|---|---|
Ocado signs a new automated European CFC and later identifies nemlig as the customer | July-August 2026 | Confirms continuing demand for highly automated grocery fulfillment despite earlier restructuring of some partnerships. |
Walmart Mexico expands Vusion connected-store deployment | March 2026 | Moves electronic shelf and connected-store infrastructure into a large Latin American multi-format rollout. |
Walmart and Google announce Gemini-based agentic shopping integration | January 2026 | Extends retail automation from physical operations into AI-led discovery, personalization and checkout. |
Ocado ends exclusivity in most international markets | December 2025 | Allows its robotics and fulfillment platform to compete for a wider global retailer customer base. |
Regulatory and Policy Environment
Camera, customer-profile and AI systems must increasingly account for privacy and transparency requirements. GDPR requires lawful, transparent and purpose-limited personal-data processing, while EU AI Act obligations affect certain biometric and AI uses. The U.S. Federal Trade Commission has also examined data-driven "surveillance pricing."S. FTC.
Key Retail Automation Market Questions Answered
Which component accounts for the largest share of retail automation spending?
Hardware is estimated to account for about 60% of the global market in 2026, equivalent to roughly USD 16.0 billion. Physical checkout, scanning, RFID, shelf and robotic systems still require a large equipment base. Software grows faster, however, and is expected to gain share as cloud deployment, AI analytics and orchestration become more important.
Which retail automation product is growing fastest?
Robotics is the fastest-growing product category at approximately 13.1% CAGR during 2026-2031. The strongest demand comes from fulfillment, storage, picking, transport and sortation. Amazon's million-robot fleet and AutoStore's more than 1,950 installed systems illustrate that robotic retail fulfillment has moved beyond pilot-stage adoption.
Is AI replacing IoT as the main retail automation technology?
Not yet. IoT remains the larger enabling layer. AI is growing faster. Connected devices generate the real-time data that AI systems need for inventory prediction, computer vision, pricing, fraud detection and robotic orchestration. The technologies are therefore complementary rather than substitutes.
Which retail format generates the most automation demand?
Supermarkets and hypermarkets are estimated to represent approximately 42% of 2026 market value. They combine high checkout throughput, large SKU counts, perishables, shrink exposure and omnichannel fulfillment, making automation economically relevant across front-of-store, shelf, inventory and warehouse operations.
Which region is growing fastest?
Asia Pacific is projected to grow fastest at approximately 11.6% CAGR through 2031. The region combines large e-commerce volumes, rapidly modernizing physical retail, high mobile-payment adoption and growing investment in automated fulfillment. North America remains the largest market in 2026.
What is the biggest barrier to retail automation?
Integration complexity is a more persistent barrier than access to automation hardware. Retailers must connect new systems with live POS, ERP, inventory, payment, loyalty and e-commerce environments while avoiding disruption. Upfront capex remains important, particularly for smaller retailers, but SaaS and managed deployment models increasingly reduce that hurdle.
How is agentic AI changing retail automation?
Agentic AI is extending automation into customer discovery and transaction execution. Walmart and Google's 2026 Gemini integration shows how recommendations, account context, baskets and fulfillment can connect within a conversational interface, increasing the importance of APIs and real-time inventory data.
Analyst View
The value pool is shifting from devices toward the intelligence surrounding devices. Hardware will remain the largest component through much of the forecast, but software and recurring services capture a rising share of lifetime economics.
Inventory visibility is becoming the common data layer across store and fulfillment automation. RFID, shelf intelligence, computer vision and connected POS increasingly feed the same decision systems rather than operating as separate technology projects.
The next automation divide will be integration capability, not access to technology. Large retailers can combine devices, data and AI across thousands of locations; smaller retailers will depend more heavily on modular SaaS and managed platforms.
AI will increasingly link physical automation with commerce automation. The same real-time inventory and customer data used to optimize stores and warehouses will increasingly support AI-led discovery, pricing and checkout.
Research Methodology
Market estimates are developed using company revenue, retailer deployment activity, installed automation systems, product and technology mix, replacement cycles, and regional adoption indicators. Company disclosures from major retail-technology vendors are combined with retailer evidence from large-scale adopters to assess market size, segment structure, and the pace of technology adoption.
Segment estimates are constructed independently and reconciled with the overall market to maintain consistency across the forecast. Growth reflects changes in hardware and software mix, AI and robotics adoption, fulfillment automation, retailer investment patterns, and regional deployment intensity rather than the application of a single uniform growth assumption.
Retail Automation Market Scope
| Report Metric | Details |
|---|---|
| Total Market Size in 2026 | USD 26.6 billion |
| Total Market Size in 2031 | USD 41.2 billion |
| Forecast Unit | Billion |
| Growth Rate | 9.1% |
| Study Period | 2021 to 2031 |
| Historical Data | 2021 to 2024 |
| Base Year | 2025 |
| Forecast Period | 2026 – 2031 |
| Segmentation | Component, Product, Technology, Application, Geography |
| Companies |
|
The study covers the global retail automation market from 2021 to 2031 by component, product, technology, application and geography. Detailed annual values, complete subsegment shares, country forecasts, company analysis, assumptions and supporting datasets remain part of the full report. Revenue estimates represent retail-specific automation hardware and software; physical deployments and company revenues are used as validation inputs and are not mechanically treated as market share.
Market Segmentation
By Component
By Product
By Technology
By Application
By Geography
Table of Contents
1. EXECUTIVE SUMMARY
2. MARKET SNAPSHOT
2.1. Market Overview
2.2. Market Definition
2.3. Scope of the Study
2.4. Market Segmentation
3. BUSINESS LANDSCAPE
3.1. Market Drivers
3.2. Market Restraints
3.3. Market Opportunities
3.4. Porter's Five Forces Analysis
3.5. Industry Value Chain Analysis
3.6. Policies and Regulations
3.7. Strategic Recommendations
4. TECHNOLOGICAL OUTLOOK
5. RETAIL AUTOMATION MARKET BY COMPONENT
5.1. Introduction
5.2. Hardware
5.2.1. POS System
5.2.2. Vending Machine
5.2.3. Barcode Scanner
5.2.4. Others
5.3. Software
5.3.1. Payment Processing Software
5.3.2. Inventory Management Software
5.3.3. Others
6. RETAIL AUTOMATION MARKET BY PRODUCT
6.1. Introduction
6.2. RFID
6.3. Robotics
6.4. Automatic Storage & Retrieval System
6.5. Others
7. RETAIL AUTOMATION MARKET BY TECHNOLOGY
7.1. Introduction
7.2. Artificial Intelligence (AI)
7.3. Internet of Things (IoT)
7.4. Others
8. RETAIL AUTOMATION MARKET BY APPLICATION
8.1. Introduction
8.2. Supermarket & Hypermarket
8.3. Specialty Stores
8.4. Fuel Stations
8.5. Others
9. RETAIL AUTOMATION MARKET BY GEOGRAPHY
9.1. Introduction
9.2. North America
9.2.1. USA
9.2.2. Canada
9.2.3. Mexico
9.3. South America
9.3.1. Brazil
9.3.2. Argentina
9.3.3. Others
9.4. Europe
9.4.1. Germany
9.4.2. France
9.4.3. United Kingdom
9.4.4. Spain
9.4.5. Others
9.5. Middle East and Africa
9.5.1. Saudi Arabia
9.5.2. UAE
9.5.3. Others
9.6. Asia Pacific
9.6.1. China
9.6.2. India
9.6.3. Japan
9.6.4. South Korea
9.6.5. Indonesia
9.6.6. Others
10. COMPETITIVE ENVIRONMENT AND ANALYSIS
10.1. Major Players and Strategy Analysis
10.2. Market Share Analysis
10.3. Mergers, Acquisitions, Agreements, and Collaborations
10.4. Competitive Dashboard
11. COMPANY PROFILES
11.1. Zebra Technologies Corporation
11.2. Honeywell International Inc.
11.3. Fujitsu Ltd.
11.4. RapidPricer B.V.
11.5. Toshiba Corporation
11.6. Xerox Corporation
11.7. ECR Software Corporation
11.8. NCR Voyix Corporation
11.9. Datalogic S.p.A (Hydra S.p.A)
12. APPENDIX
12.1. Currency
12.2. Assumptions
12.3. Base and Forecast Years Timeline
12.4. Key benefits for the stakeholders
12.5. Research Methodology
12.6. Abbreviations
LIST OF FIGURES
LIST OF TABLES
Navigate
Trusted by the world's leading organizations











