Report Overview
Solar Connector Market Size:
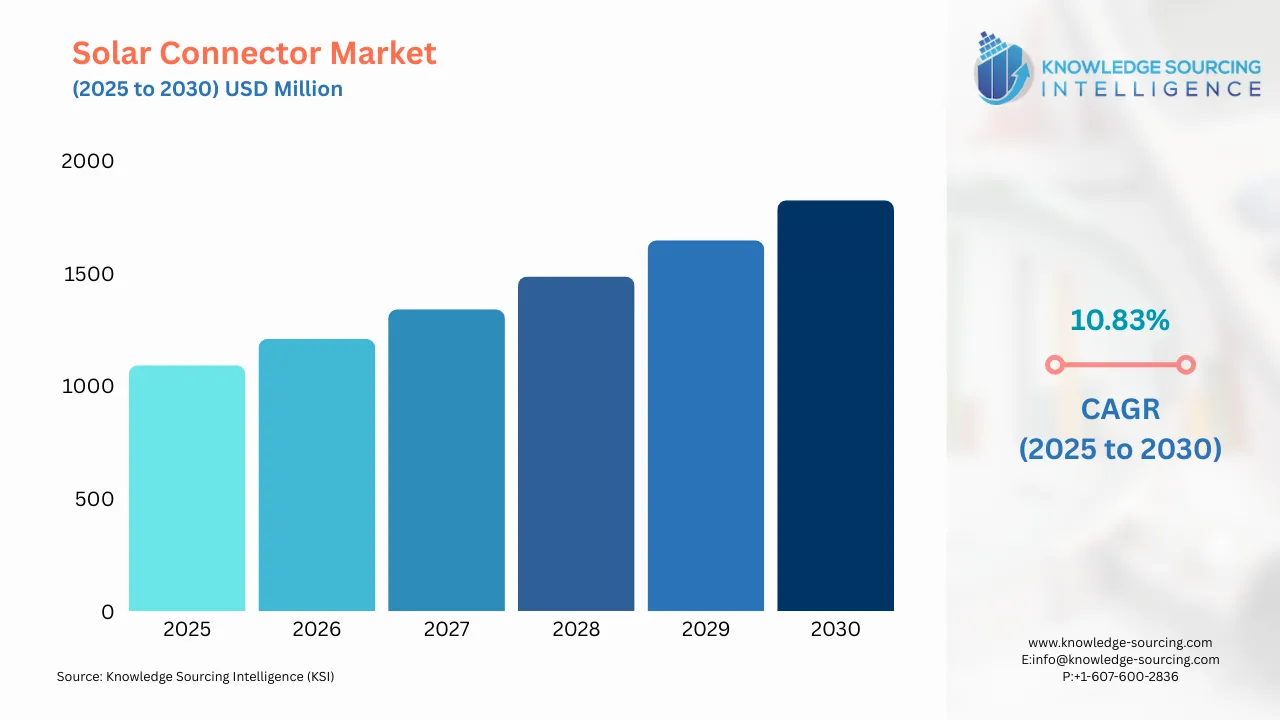
Solar Connector Market is forecasted to rise at a 10.51% CAGR, reaching USD 1986.252 million in 2031 from USD 1,090.788 million in 2025.
Highlights:
- 1Adoption of solar PV is increasing across residential, commercial, and industrial sectors globally.
- 2Manufacturers are launching new connector designs to improve efficiency and simplify installations.
- 3Investors are pouring capital into solar infrastructure, boosting demand for reliable solar connectors.
- 4North America is expanding solar capacity rapidly, driving consistent connector market growth.
Solar connectors play a crucial role in establishing and enhancing electrical connectivity within solar energy systems. Solar connectors are categorized into different types, including MC4, MC3, and Tyco Solarlok, based on their design and specifications. Solar connectors serve a wide range of end users, including residential, commercial, and industrial sectors, thereby enabling efficient electrical connectivity within solar energy systems. The prominent driver propelling the solar connector industry's growth is the substantial increase in solar installation worldwide coupled with favorable investments.
Solar Connector Market Growth Drivers:
High maintenance cost restrains the solar connector market.
The high maintenance costs associated with solar panels are acting as a significant barrier to the growth of the solar connector market. The expenses incurred for maintaining solar systems can range from Rs 1,000 to Rs 3,000 per kilowatt (kW). These costs include regular cleaning, inspection, and repair of the panels, as well as monitoring and replacing components as needed. The financial burden imposed by these maintenance expenses hampers the widespread adoption of solar connectors and poses challenges for businesses and individuals seeking to invest in solar energy solutions.
Solar Connector Market Segmentation Analysis:
Adoption of solar energy by commercial and industrial bolsters the solar connector market.
Solar connectors are used in solar systems to establish reliable connections between solar panels, inverters, and other components. They ensure the seamless transfer of power generated by solar panels to the electrical grid or local consumption points. The growing shift towards sustainability has increased solar PV adoption in commercial and industrial sectors which has simultaneously increased the market demand for solar connectors. According to the International Energy Agency, the global commercial and industrial solar PV power capacity reached 243 GW in 2021, and it experienced significant growth of 22.6% in 2022, reaching a capacity of 298 GW.
Adoption of solar energy by residential drives the solar connector market.
Solar connectors are crucial components in solar systems to ensure the seamless flow of electricity generated by the solar panels to the desired destination, such as batteries, inverters, or the electrical grid. The increasing adoption of solar panels in residential settings can be attributed to the improved efficiency and electricity affordability which is making them an appropriate option for homeowners seeking to reduce their reliance on traditional grid electricity and lower their energy costs. According to the International Energy Agency, the residential sector witnessed significant growth in global solar PV power capacity, reaching 144 GW in 2021. This capacity experienced a remarkable increase of 34.4% in 2022, surging to 195 GW.
Investments in the solar industry drive solar connector market growth.
Solar connectors are used in solar energy systems to facilitate the seamless flow of electricity between solar panels, inverters, and other components. Ensuring optimal performance and efficiency of the solar power system. The increase in adopting solar energy is driven by investments made in solar power projects which leads to advancements in technology, cost reductions, and increased efficiency, creating a positive cycle of growth and further driving the adoption of solar connectors. For instance, in June 2022, Vikram Solar Ltd, an Indian solar panel manufacturer, announced its new venture that aims to invest up to $1.5 billion in the U.S. solar energy supply chain. The venture's first step will involve establishing a factory in Colorado.
Solar Connector Market Geographical Outlook:
North America is predicted to dominate the solar connector market.
North America will account for a significant solar connector market share due to favorable government investments in the solar industry and the widespread adoption of solar energy by commercial, residential, and industrial sectors. For instance, in April 2023, the US Department of Energy a substantial investment of $82 million aimed at bolstering domestic solar manufacturing and recycling, as well as fortifying the American clean energy grid. Additionally, according to the Solar Energy Industries Association, In 2021, the cumulative installed solar capacity for residential purposes in the United States reached 29,311.89 MWdc. up 23.5% in 2022, reaching 23,353.28 MWdc. Additionally, solar installations in the commercial sector witnessed a growth of 10% in 2022 compared to the previous year.
Solar Connector Market Company Products:
SOLARLOK PV4-S DC Crimp Connectors: TE Connectivity offers SOLARLOK PV4-S DC Crimp Connectors, specifically designed to facilitate the connection of solar panels to the power grid, specifically adapted for 1500V DC cable solutions. These connectors find applications in various components of solar energy systems such as solar and micro inverters, combiner boxes, and DC optimizers. The SOLARLOK PV4-S DC Crimp Connectors by TE Connectivity ensure reliable and efficient electrical connectivity, contributing to the seamless integration and performance of solar power installations.
PV-C3M-S 2.5-6: Phoenix Contract offers the PV-C3M-S 2.5-6 Photovoltaic connector, designed specifically for photovoltaic applications and compliant with IEC 62930 standards. This connector utilizes a spring-cage connection method and is suitable for various cable types. With a rated surge voltage of 12.8 kV, the PV-C3M-S 2.5-6 connector ensures reliable and secure electrical connectivity within photovoltaic systems, contributing to their efficient and safe operation.
List of Top Solar Connector Companies:
TE Connectivity
Amphenol Corporation
Phoenix Contract
Japan Aviation Electronics Industry, Ltd
QC Corporation
Solar Connector Market Scope:
| Report Metric | Details |
|---|---|
| Study Period | 2021 to 2031 |
| Historical Data | 2021 to 2024 |
| Base Year | 2025 |
| Forecast Period | 2026 – 2031 |
| Companies |
|
Report Metric | Details |
Solar Connector Market Size in 2025 | USD 1,090.788 million |
Solar Connector Market Size in 2030 | USD 1,823.669 million |
Growth Rate | CAGR of 10.83% |
Study Period | 2020 to 2030 |
Historical Data | 2020 to 2023 |
Base Year | 2024 |
Forecast Period | 2025 – 2030 |
Forecast Unit (Value) | USD Million |
Segmentation |
|
Geographical Segmentation | North America, South America, Europe, Middle East and Africa, Asia Pacific |
List of Major Companies in the Solar Connector Market |
|
Customization Scope | Free report customization with purchase |
Solar Connector Market Segmentation
By Type
MC-4
MC-3
Tyco Solarlok
Others
By Shape
T-Joint
Y-Joint
Others
By Current
Up to 20 Amp
20 to 30 Amp
Greater than 50 Amp
By End-User
Residential
Commercial
Industrial
By Geography
North America
United States
Canada
Mexico
South America
Brazil
Argentina
Others
Europe
Germany
France
United Kingdom
Spain
Others
Middle East and Africa
Saudi Arabia
UAE
Others
Asia Pacific
China
India
Japan
South Korea
Indonesia
Thailand
Others
Our Best-Performing Industry Reports:
Market Segmentation
By Type
By Shape
By Current
By End-user
By Geography
Table of Contents
1. EXECUTIVE SUMMARY
2. MARKET SNAPSHOT
2.1. Market Overview
2.2. Market Definition
2.3. Scope of the Study
2.4. Market Segmentation
3. BUSINESS LANDSCAPE
3.1. Market Drivers
3.2. Market Restraints
3.3. Market Opportunities
3.4. Porter’s Five Forces Analysis
3.5. Industry Value Chain Analysis
3.6. Policies and Regulations
3.7. Strategic Recommendations
4. TECHNOLOGICAL OUTLOOK
5. SOLAR CONNECTOR MARKET BY TYPE
5.1. Introduction
5.2. MC-4
5.3. MC-3
5.4. Tyco Solarlok
5.5. Others
6. SOLAR CONNECTOR MARKET BY SHAPE
6.1. Introduction
6.2. T-Joint
6.3. Y-Joint
6.4. Others
7. SOLAR CONNECTOR MARKET BY CURRENT
7.1. Introduction
7.2. Up to 20 Amp
7.3. 20 to 30 Amp
7.4. Greater than 50 Amp
8. SOLAR CONNECTOR MARKET BY END-USER
8.1. Introduction
8.2. Residential
8.3. Commercial
8.4. Industrial
9. SOLAR CONNECTOR MARKET BY GEOGRAPHY
9.1. Introduction
9.2. North America
9.2.1. USA
9.2.2. Canada
9.2.3. Mexico
9.3. South America
9.3.1. Brazil
9.3.2. Argentina
9.3.3. Others
9.4. Europe
9.4.1. Germany
9.4.2. France
9.4.3. United Kingdom
9.4.4. Spain
9.4.5. Others
9.5. Middle East and Africa
9.5.1. Saudi Arabia
9.5.2. UAE
9.5.3. Others
9.6. Asia Pacific
9.6.1. China
9.6.2. India
9.6.3. Japan
9.6.4. South Korea
9.6.5. Indonesia
9.6.6. Thailand
9.6.7. Others
10. COMPETITIVE ENVIRONMENT AND ANALYSIS
10.1. Major Players and Strategy Analysis
10.2. Market Share Analysis
10.3. Mergers, Acquisitions, Agreements, and Collaborations
10.4. Competitive Dashboard
11. COMPANY PROFILES
11.1. TE Connectivity
11.2. Phoenix Contact
11.3. Amphenol Corporation
11.4. Japan Aviation Electronics Industry, Ltd.
11.5. QC Solar
11.6. Elcom International
11.7. Stäubli International AG
11.8. Leader Group Co., Ltd.
11.9. Betteri
11.10. RISIN ENERGY CO., LIMITED
12. APPENDIX
12.1. Currency
12.2. Assumptions
12.3. Base and Forecast Years Timeline
12.4. Key benefits for the stakeholders
12.5. Research Methodology
12.6. Abbreviations
LIST OF FIGURES
LIST OF TABLES
Navigate
Trusted by the world's leading organizations


