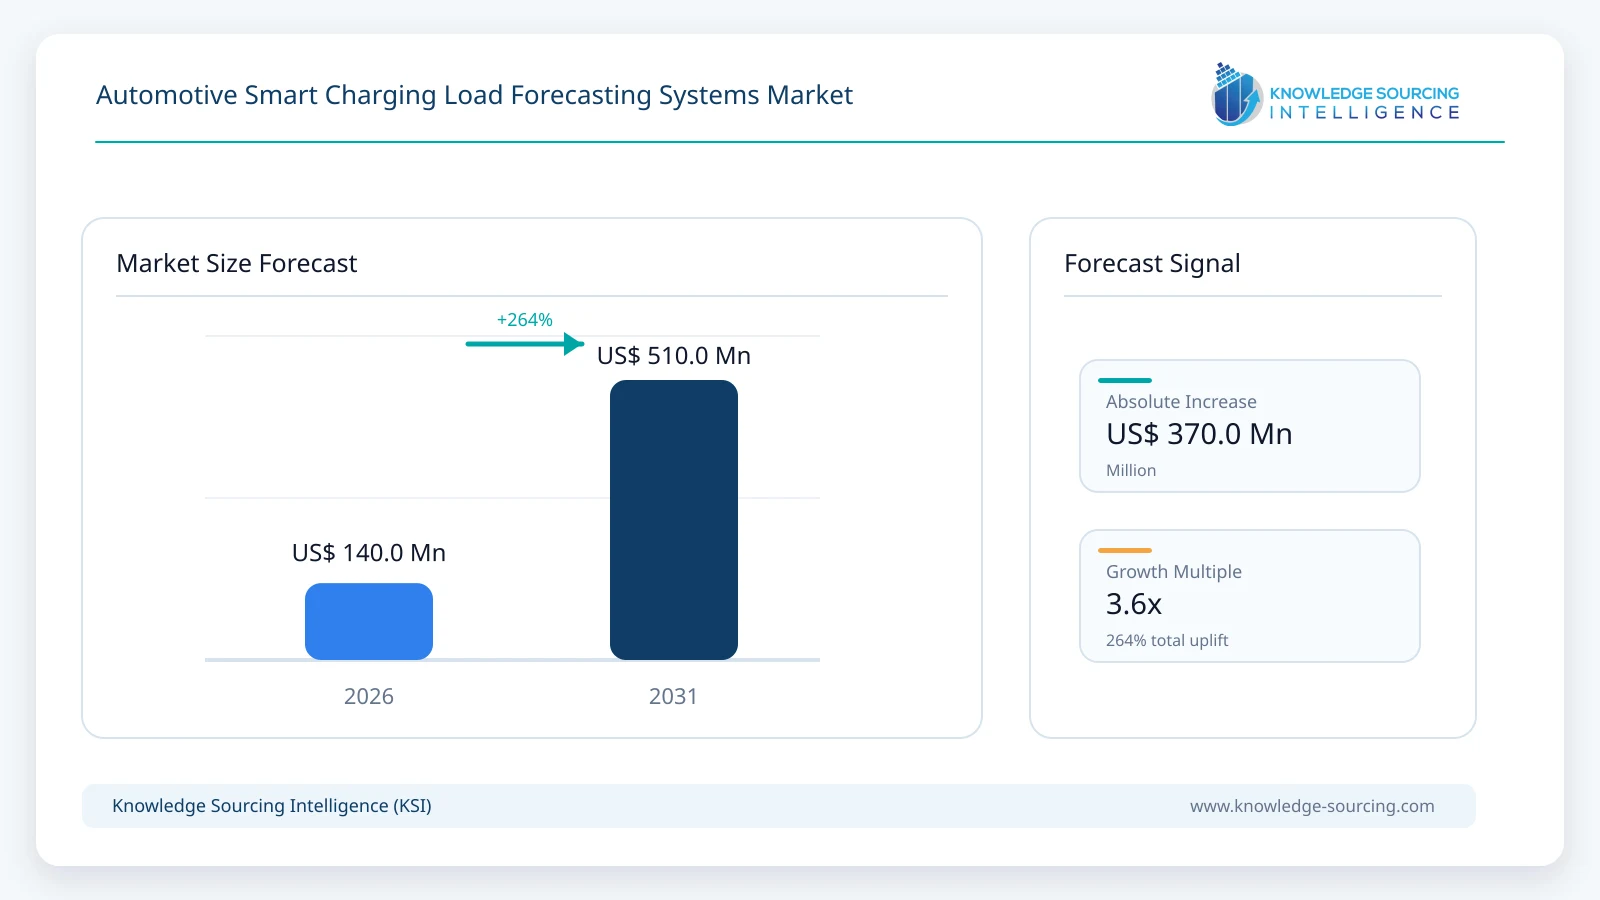
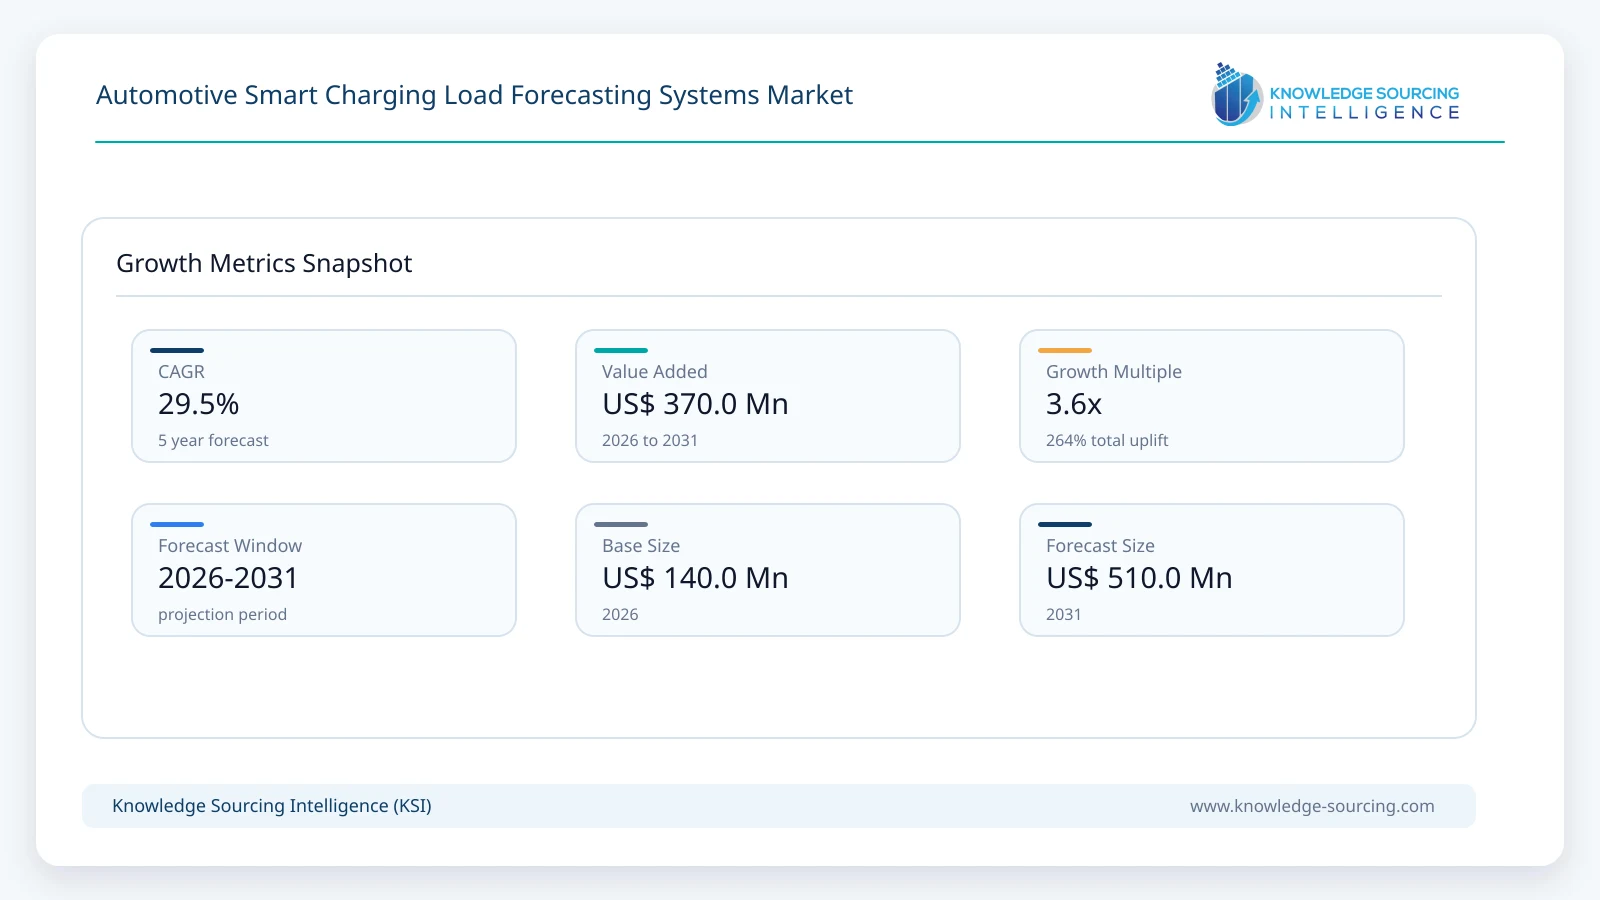
The automotive smart charging load forecasting systems market is projected to grow from USD 140 million in 2026 to USD 510 million by 2031, representing a CAGR of 29.5% over the forecast period.
Highlights:
- 1Site peak-demand and capacity forecasting holds an estimated 32% of global 2026 value as operators evaluate connection limits and demand charges.
- 2Charging-site forecasting subscriptions represent approximately USD 72 million in 2026; utility-facing services and project integration provide the balance.
- 3Machine-learning models account for approximately 38% of 2026 value, while hybrid mobility and grid-aware models are gaining share.
- 4Europe leads the working market at 35% in 2026; Asia Pacific gains share as connected charging and EV scale expand.
- 5Fleet and depot charging accounts for approximately 30% of the 2026 environment mix due to scheduled vehicle operations and large site loads.
- 6Forecast accuracy depends on reliable charger and vehicle data, local grid visibility and continued model calibration.
Public charge point operators face a planning problem in which annual vehicle adoption, daily traffic and instantaneous charging demand move at different speeds. A station can have unused energy capacity for many hours yet produce a short peak when several high-power vehicles arrive together. Forecasting tools combine historical sessions with charger power ratings, dwell times, local conditions and expected occupancy to estimate the load profile that matters to the site connection and electricity bill.
Charging-system suppliers address different points of the forecasting workflow. The ev.energy Eve platform combines operational benchmarks with utility data to support feeder-level growth forecasts, while WeaveGrid links vehicle charging behavior with distribution-network constraints through DISCO. Ampcontrol provides fleet scheduling and energy prediction for depots and terminals, and CGI has described an EV demand-forecasting implementation using spatial-temporal machine learning.
The forecasting software value chain extends from vehicle telematics and charge-point telemetry to data engineering, model calibration, cloud analytics and operator workflow integration. ChargePoint’s 2025 platform update illustrates the value of analyzing utilization patterns alongside energy conditions and charging-station health. A complete charging management product can use forecast outputs to schedule power, but the forecasting function has different validation requirements because its accuracy depends on changing traffic, vehicle mix, weather and the availability of site-level data.
Market Trends
Forecasting Is Becoming Feeder- and Site-Specific
The Energy Systems Integration Group’s March 2026 guide emphasizes the importance of predicting not only the amount of EV load but also when and where it will appear. Distribution planners need different resolution from national energy outlooks because a heavily used depot or highway stop can influence one transformer long before a utility-wide EV forecast changes materially. Charging businesses increasingly assess prospective locations using local traffic, charger power and competing facilities rather than projecting network growth evenly across a territory.
CGI’s June 2026 demand-forecasting case described machine-learning models using historical charging loads, site locations, charger counts, calendar patterns and weather. Its stated forecast horizon extended to three months, supporting electricity procurement and infrastructure planning. A model that predicts a station’s peak half-hour therefore addresses a different procurement decision from one estimating total annual vehicle-kilometres or EV registrations.
Fleet Telemetry Is Strengthening Day-Ahead Load Forecasts
Ampcontrol’s terminal-tractor offering plans charging several days ahead by incorporating vehicle workload, delays and charging availability. For a mixed commercial fleet, an accurate depot load forecast depends on the route actually completed, the return-time distribution and the remaining energy of vehicles arriving for the next shift. Forecast errors affect both the site’s peak electricity charge and the likelihood that vehicles are fully charged before dispatch.
Synop’s March 2026 partnership with WeaveGrid creates a link between commercial charging operations and utility distribution-level orchestration. The two companies described an integration between Synop’s energy management platform and WeaveGrid’s DISCO software to improve charging-load visibility. Commercial partnerships of this type are important because an individual depot can supply operating data that a utility cannot derive reliably from EV registration statistics alone.
Utility Analytics Are Moving from Historic Load to Scenario Forecasts
ev.energy launched Eve in June 2026 with a beta planning interface that lets utility teams examine future flexibility and feeder demand as electric-vehicle penetration changes. The company describes the use of public information, anonymized operational benchmarks and separately authorized utility data. For grid planners, scenario modelling provides an estimate of uncertainty around the forecast rather than assuming every participating vehicle will charge at the same time.
Historical charging data become less representative when drivers change tariff plans, vehicle battery capacities increase or a new workplace charging program changes where people plug in. A practical forecast engine requires regular recalibration and a feedback loop between predicted and observed charging load. These requirements support recurring analytics services beyond a one-off software installation.
Open Protocols Are Improving Data Exchange but Not Predictive Accuracy by Themselves
The Open Charge Alliance’s OCPP 2.x specifications support smarter charging and more standardized data exchange between charging stations and their management systems. OSCP can communicate predicted available capacity from a site owner or network operator to a charging back office. Such interfaces can improve the availability of capacity limits and charger status for a forecast, but neither protocol independently provides a trained demand-prediction model.
Automotive Smart Charging Load Forecasting Systems Market Segment Analysis
By Forecasting Function
Site Peak-Demand and Capacity Forecasting
Site peak-demand and capacity forecasting is estimated to account for 32% of global 2026 revenue because charging operators must understand coincident load before expanding charger counts or selecting grid-connection capacity. Models evaluate historical session timing, rated charger power and expected utilization, then estimate future site peaks under alternative demand scenarios. A high-power hub with uneven arrivals can require forecasting at a much finer interval than a low-power workplace site.
The function’s share is expected to moderate as utilities develop more feeder-level forecasting and fleet operators purchase specialized planning tools. The absolute value still rises because high-power sites face expensive connection upgrades and demand-charge exposure.
By Revenue Component
Charging-Site Forecasting Subscriptions
Charging-site forecasting subscriptions represent USD 72 million of the 2026 working market, reflecting licenses bundled or sold separately to charge point operators, depot owners and commercial properties. Buyers typically need a continually refreshed forecast rather than a one-time installed algorithm because charging utilization and tariffs change as EV adoption grows. Contract pricing depends on the number and complexity of participating sites and data integrations, not simply the number of chargers installed.
The segment is modeled to reach USD 315 million in 2031 as managed multi-site networks add forecasting to routine operating decisions. Where the forecast is part of a full charger-management contract, only its attributable analytic value is included.
By Forecasting Horizon
Real-Time and Intraday
Real-time and intraday forecasting leads the 2026 horizon mix because charger operators must prepare for short power peaks and control-room decisions during active operating periods. Time-series forecasts can combine recent charger utilization with arriving vehicle patterns to anticipate deviations from the normal weekday curve. Short-horizon predictions are particularly valuable at compact depots operating close to their connection limits.
By Analytical Technology
Machine-Learning Predictive Models
Machine-learning predictive models are estimated to represent 38% of 2026 value, supported by their ability to identify temporal patterns and interactions among charger usage, location, weather and vehicle demand. CGI’s 2026 utility forecasting case uses spatial-temporal modelling and historical operational data, while ev.energy draws on deployment-scale operating benchmarks for scenario analysis.
Machine-learning share is expected to rise through 2031 as training data become more complete, although hybrid approaches combining physical grid limits and forecast uncertainty grow even faster. Accuracy and explainability remain procurement criteria when the output informs capacity spending or system reliability.
By Deployment Architecture
Cloud-Hosted Forecasting
Cloud-hosted forecasting is estimated to hold 59% of 2026 market value because pooling charging observations across sites can improve data availability and support model updates. The architecture suits utilities and charging-network operators evaluating utilization across multiple depots or regions. Centralized systems can also compare comparable charging sites to create a useful starting forecast for locations with limited history.
Hybrid cloud-edge deployments increase their contribution as high-power sites require local continuity under communication outages. Local controllers can enforce electrical constraints while cloud systems train longer-horizon forecast models and distribute revised projections.
By Charging Environment
Commercial Fleet and Depot Charging
Commercial fleet and depot charging represents approximately 30% of modeled 2026 revenue as fleet operators need predictable charging windows and can often provide detailed vehicle schedules. Return-to-depot times, duty cycles and next-shift departure targets make fleet demand more structured than opportunistic public charging, but delays and changing utilization still require forecast updates.
Battery-electric delivery fleets, transit depots and port vehicles create distinct forecasting requirements. Their higher per-site energy consumption supports targeted software procurement even when the number of managed sites is lower than in residential charging.
By Customer Type
Charge Point Operators
Charge point operators account for an estimated 30% of 2026 demand for charging load forecasting because utilization uncertainty affects site design, electricity cost and network operating performance. ChargePoint’s disclosure of over 100 million sessions handled during the preceding year demonstrates the scale of event-level charging data available to an established network, although those sessions are not forecast-software sales.
By Principal Data Inputs
Charging-Station and Session Telemetry
Charging-station and session telemetry forms the largest input category in 2026 because connection status, power delivery, transaction time and energy consumption can be captured through existing charging-management software. These observations provide a direct record of actual demand but may not identify vehicles that leave without charging or those unable to find an available port.
Market Drivers
Rising Charging Density and Coincident Peak Exposure
The International Energy Agency recorded more than seven million public charging points in service at the end of 2025 and more than 43 million private points. Adding power capacity in concentrated locations changes the commercial consequences of poor load forecasting because simultaneous charging can constrain a local feeder even when total annual electricity consumption remains manageable. Site operators increasingly need demand profiles that capture time of arrival, power level and dwell duration to size electrical connections and control demand charges.
ChargePoint reported a 34% increase in sessions across its platform during 2025 versus a 16% expansion in ports, demonstrating why utilization may change faster than the asset base. Stronger data collection makes short-term forecasts commercially useful before another charger is purchased.
Commercial Fleet Electrification and Depot Readiness
Battery-electric buses, logistics vehicles and terminal tractors must often charge during short windows determined by vehicle duty cycles rather than electricity tariffs alone. Fleet operators can reduce avoidable demand peaks when forecasting software anticipates the number of returning vehicles, battery energy requirements and the available chargers. The value of the forecast increases when the depot uses a shared grid connection with onsite storage or other industrial loads.
Ampcontrol’s depot and port products reflect that requirement by linking operating schedules, delays and charger availability to energy planning. Synop’s work with commercial fleets demonstrates the broader supplier focus on coordinated charge scheduling and grid integration, with forecasting providing a critical input rather than replacing charge control.
Utility Investment Planning at Feeder Resolution
Transport electrification adds load in locations that may differ from where utilities have traditionally observed electricity growth. The Energy Systems Integration Group’s March 2026 guide advises scenario-based forecasting that accounts for charging location and timing instead of relying solely on aggregate EV adoption. Utilities need to estimate when reinforcement is required and whether managed charging can defer the investment.
ev.energy and WeaveGrid provide utility-oriented examples in which vehicle operating information can inform grid planning and distribution constraints. Forecasting contracts can therefore support both operational load shaping and longer-term network investment decisions.
Growth of Connected Vehicle and Charger Data
Telematics-enabled smart charging programs generate information on vehicle connection, battery condition and actual energy use that conventional registration databases cannot provide. WeaveGrid’s partnerships with automakers and utilities illustrate the potential to connect vehicle data to regional charging decisions. Where customer consent and integration are available, forecasters can distinguish an EV that is parked with adequate charge from one likely to draw power soon.
Network operators are also recording richer charger diagnostics through evolving charging-management platforms. More granular and timely information improves the opportunities for intraday predictions, particularly at sites with variable arrival patterns.
Grid Flexibility and Renewable-Integration Planning
Charging demand forecasts become more valuable when an energy provider must coordinate vehicles with solar output, time-varying electricity prices and a limited transformer. Utility-facing software can estimate both probable baseline demand and the amount of charge that can be shifted without undermining vehicle readiness. Forecasting flexibility is different from bidding that capacity into a market, but it supplies the information needed to evaluate such opportunities.
ev.energy’s April 2026 MCE integration and June 2026 Eve release illustrate how load forecasts are being connected to broader distributed energy-resource workflows. These integrations increase the need for forecasts that retain useful accuracy under changing tariffs and customer behavior.
Market Restraints
Incomplete Vehicle-Level and Charger Data
Charging-session records often describe completed transactions more accurately than vehicles that arrived, waited and left without charging. A charging site with limited occupancy information can underestimate unmet demand, especially when stations operate near full utilization. Vehicle data would improve forecasts but can be restricted by differing manufacturer interfaces, driver permissions and subscription agreements.
Charging-network operators therefore need data-cleaning procedures, confidence intervals and alternative models for locations with short histories. Those integration and monitoring requirements raise implementation effort and can limit the scope of smaller forecasting contracts.
Rapidly Changing Consumer Behavior and Tariff Response
EV drivers change their charging times in response to electricity prices, workplace policies, travel patterns and the introduction of faster chargers. A historical model trained under one tariff regime may overpredict an evening peak after a utility introduces a managed off-peak program. The forecast must be retrained as demand moves between locations or time periods, particularly in markets with accelerating adoption.
The underlying issue is not merely algorithm selection. Operators need continued access to changing charging behavior, an independent validation procedure and governance for model updates before forecasts are used for major grid decisions.
Integration Complexity across Mixed Charging Assets
Charging sites commonly operate equipment from multiple suppliers and software generations. OCPP provides a communication foundation but does not guarantee that all chargers report identical measurements, error codes or time resolution. Forecasting systems must map inconsistent events into standardized energy and availability records before they can compare demand across sites.
Legacy chargers and local connectivity gaps may force suppliers to use less informative fallback models. Deployment economics deteriorate when every customer needs a custom integration rather than reusable connectors.
Uncertain Commercial Ownership of Forecast Outputs
Charging-load predictions are often embedded within a broader fleet, energy or utility platform, creating procurement complexity for specialized analytics vendors. A customer buying a new CMS may expect basic forecasting to be bundled in the existing service charge, limiting the price that a stand-alone product can command. Suppliers must demonstrate distinctive results such as better capacity sizing or measurable reduction in avoidable demand charges.
This purchasing pattern can favor incumbent platforms with an established data connection over newer forecasting specialists. It also makes software portability important for customers that wish to retain forecasting models when changing their charging management provider.
Accuracy Liability and Planning-Decision Requirements
Utility and site investment decisions can be expensive to reverse when forecasts materially underestimate high-power charging demand. A model that appears accurate on total monthly energy may still miss the highest fifteen-minute load, which can determine grid equipment sizing and demand charges. Buyers need error tests suited to their decisions and clear treatment of exceptional days, events and equipment outages.
Independent validation and explainable assumptions are particularly important for regulatory filings and infrastructure planning. Forecasting suppliers that cannot describe model failure modes face longer qualification cycles even if their software performs well in demonstrations.
Regional Outlook
Europe
Europe combines a substantial public charging network with established utility planning and managed-charging programs. The IEA records more than 200,000 public charging points in the Netherlands and a similarly large number in Germany and France in 2025, creating dense datasets and localized pressure on distribution assets. Differences in grid tariffs, charging habits and site utilization raise demand for geography-specific forecasts rather than a uniform continental model.
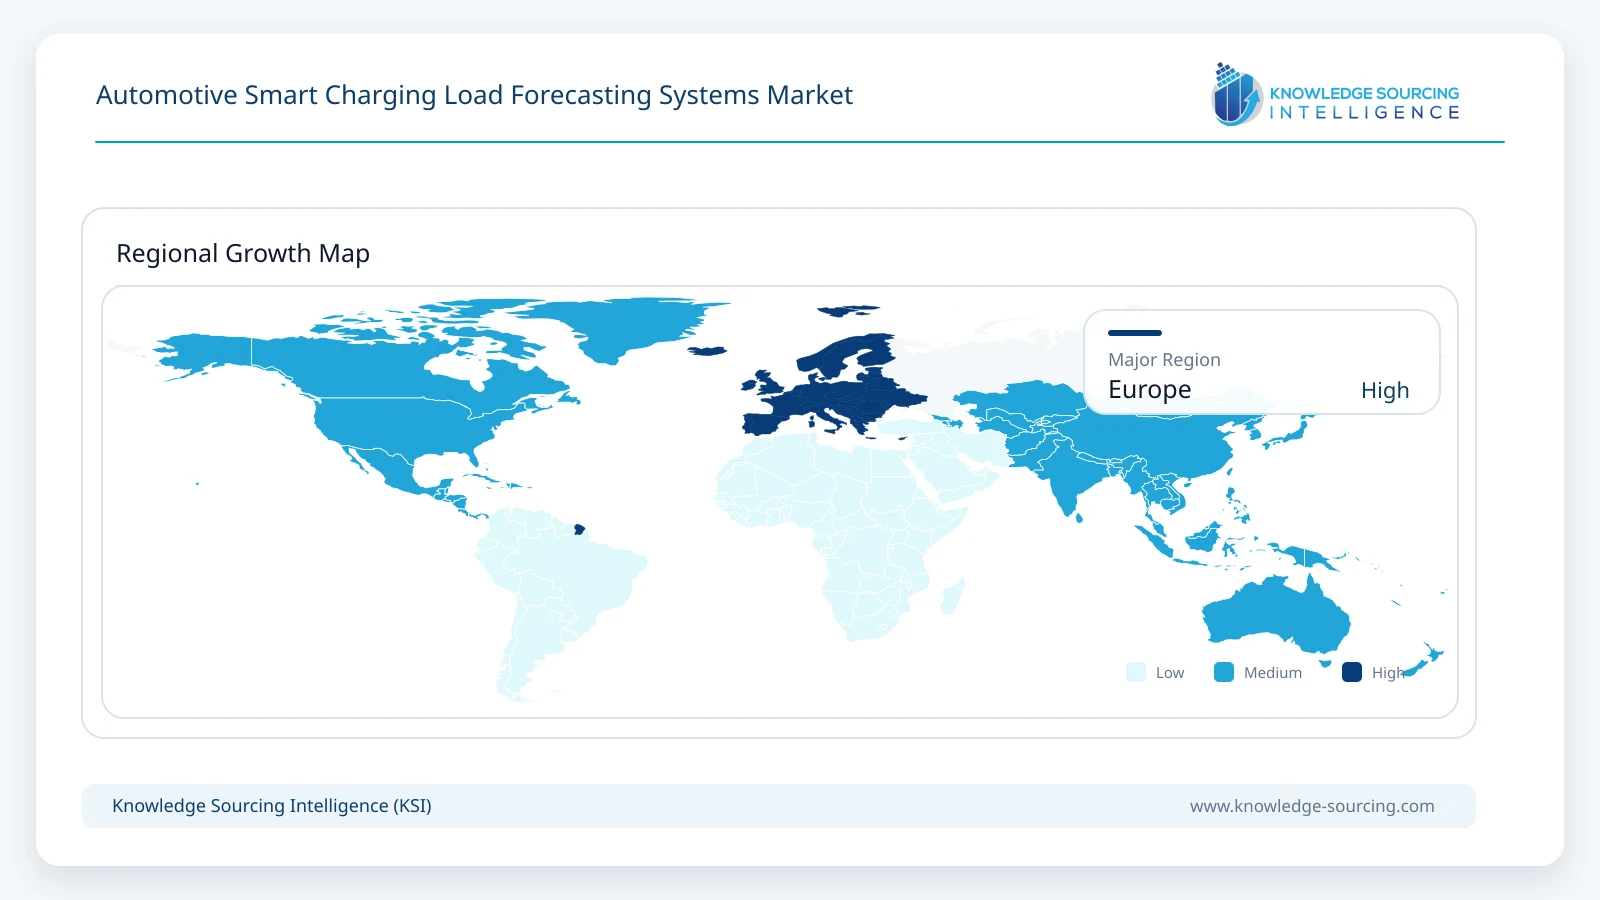
The European market is estimated to represent 35% of 2026 global value. Utility data governance, interoperability requirements and rising high-power charging investment support adoption, while differences in national metering and local grid operations favor suppliers able to tailor forecasting models to individual customers. Public infrastructure and commercial fleet depots are both important purchasing channels.
North America
North American utilities are investing in more granular EV load forecasts as household charging and fleet depot installations create uneven feeder-level demand. WeaveGrid’s work with utility programs and its partnership with Synop establish practical links between residential EV behavior, fleet charging operations and grid-facing software. The ability to forecast local transformer constraints can matter more commercially than an accurate annual EV stock projection.
The region accounts for an estimated 31% of 2026 market revenue. United States procurement emphasizes regulated utility planning, managed charging and fleet energy costs; Canadian utilities face similar coordination requirements at a smaller installed scale. Customer-specific integration and access to vehicle data remain important vendor differentiators.
Competitive Landscape
Smart charging load forecasting is supplied by several groups with different access to operating data. Specialist managed-charging providers such as ev.energy and WeaveGrid work closely with utilities and connected vehicles, while Ampcontrol and Synop serve commercial fleets whose schedules can improve depot energy predictions. Their commercial position depends on access to charging behavior and the ability to convert a forecast into a site or grid decision that the customer can verify.
ChargePoint and Driivz provide forecasting-adjacent capabilities within broader charging management and energy optimization products. Infosys and CGI bring software engineering and utility-analytics skills, and PowerFlex operates site-level energy management infrastructure that supplies relevant data. Buyers may prefer an existing platform for easier integration, but forecast specialists can differentiate through model calibration, utility-specific spatial resolution and transparent error testing.
Recent Developments
June 2026: ev.energy launched its Eve platform and Eve Insight beta, giving select utility users forecasting and scenario-planning interfaces based on operational and utility data.
June 2026: Eurelectric published CGI’s charging demand forecasting case with multi-source spatial-temporal machine-learning models and operational planning use cases.
April 2026: ev.energy described the MCE managed-charging integration with a DERMS-based California virtual power plant, including telemetry for load forecasting and market planning.
March 2026: WeaveGrid and Synop announced an integration of distribution-system orchestration with commercial fleet charging management to improve load visibility.
March 2026: The Energy Systems Integration Group issued an EV Load Forecasting Guide outlining best practices for utilities facing uncertain EV charging location and timing.
November 2025: ChargePoint released its next-generation software platform, adding AI-driven analysis of utilization and energy conditions alongside charging operations.
Market Outlook
Charging forecasts will increasingly need to represent mixed fleets, high-power public charging hubs and residential programs at a level of detail suitable for both site operations and utility planning. Larger databases improve forecasting opportunities, but growing adoption also changes driver behavior and invalidates static assumptions. Suppliers with recurring model monitoring and retraining services will be better positioned than providers offering one-off studies.
Utility-facing forecasting is expected to grow faster than basic charging-session prediction as grid operators seek to anticipate feeder constraints and compare infrastructure reinforcement with managed charging. Hybrid models that combine statistical learning, vehicle operating schedules and physical grid limits are likely to gain share, particularly where forecasts guide investment or reliability decisions. Commercial results will depend on demonstrating lower forecast error in the decisions that customers actually make.
Automotive Smart Charging Load Forecasting Systems Market Scope:
| Report Metric | Details |
|---|---|
| Total Market Size in 2026 | USD 140 million |
| Total Market Size in 2031 | USD 510 million |
| Forecast Unit | USD Million |
| Growth Rate | 29.5% |
| Study Period | 2021 to 2031 |
| Historical Data | 2021 to 2024 |
| Base Year | 2025 |
| Forecast Period | 2026 – 2031 |
| Segmentation | Forecasting Function, Revenue Component, Forecasting Horizon, Analytical Technology, Deployment Architecture, Charging Environment, Customer Type, Principal Data Inputs, Geography |
| Companies |
|
Market Segmentation
By Forecasting Function
Site Peak-Demand and Capacity Forecasting
Fleet and Depot Energy-Demand Forecasting
Utility Feeder and Spatial Load Forecasting
Public Charging Utilization Forecasting
Flexibility and Available-Capacity Forecasting
By Revenue Component
Charging-Site Forecasting Subscriptions
Utility and Managed-Vehicle Forecast Services
Integration, Calibration and Validation Services
By Forecasting Horizon
Real-Time and Intraday
Day-Ahead
Week-Ahead to Quarterly
Long-Term Capacity Planning
By Analytical Technology
Statistical and Time-Series Models
Machine-Learning Predictive Models
Hybrid Physics, Mobility and Grid-Aware Models
By Deployment Architecture
Cloud-Hosted Forecasting
On-Site and Edge Forecasting
Hybrid Cloud-Edge Forecasting
By Charging Environment
Public and Highway Charging
Commercial Fleet and Depot Charging
Workplace and Commercial Premises
Residential and Utility-Managed Charging
By Customer Type
Charge Point Operators
Fleet and Depot Operators
Utilities and Energy Providers
Property and Commercial Site Owners
By Principal Data Inputs
Charging-Station and Session Telemetry
Vehicle and Telematics Data
Integrated Grid, Weather and Asset Data
Synthetic Mobility and Planning Models
By Geography
North America
United States
Canada
Mexico
South America
Brazil
Argentina
Others
Europe
Germany
United Kingdom
France
Netherlands
Spain
Others
Middle East and Africa
Saudi Arabia
UAE
South Africa
Others
Asia Pacific
China
Japan
South Korea
India
Australia
Others
Table of Contents
1. EXECUTIVE SUMMARY
1.1. Key Findings and Market Outlook
2. MARKET SNAPSHOT
2.1. Market Overview
2.2. Market Definition
2.3. Scope of the Study
2.4. Market Segmentation
3. BUSINESS LANDSCAPE
3.1. Market Drivers
3.1.1. Rising Charging Density and Coincident Peak Exposure
3.1.2. Commercial Fleet Electrification and Depot Readiness
3.1.3. Utility Investment Planning at Feeder Resolution
3.1.4. Growth of Connected Vehicle and Charger Data
3.1.5. Grid Flexibility and Renewable-Integration Planning
3.2. Market Restraints
3.2.1. Incomplete Vehicle-Level and Charger Data
3.2.2. Rapidly Changing Consumer Behavior and Tariff Response
3.2.3. Integration Complexity across Mixed Charging Assets
3.2.4. Uncertain Commercial Ownership of Forecast Outputs
3.2.5. Accuracy Liability and Planning-Decision Requirements
3.3. Market Opportunities
3.4. Porter’s Five Forces Analysis
3.5. Industry Value Chain Analysis
3.6. Policies and Regulations
3.7. Strategic Recommendations
4. TECHNOLOGICAL OUTLOOK
4.1. Statistical and Probabilistic Forecasting
4.2. Machine-Learning and Spatial-Temporal Modelling
4.3. Vehicle-Telematics and Charging-Session Data Fusion
4.4. Hybrid Grid-Aware Forecasting and Scenario Models
5. MARKET BY FORECASTING FUNCTION
5.1. Introduction
5.2. Site Peak-Demand and Capacity Forecasting
5.3. Fleet and Depot Energy-Demand Forecasting
5.4. Utility Feeder and Spatial Load Forecasting
5.5. Public Charging Utilization Forecasting
5.6. Flexibility and Available-Capacity Forecasting
6. MARKET BY REVENUE COMPONENT
6.1. Introduction
6.2. Charging-Site Forecasting Subscriptions
6.3. Utility and Managed-Vehicle Forecast Services
6.4. Integration, Calibration and Validation Services
7. MARKET BY FORECASTING HORIZON
7.1. Introduction
7.2. Real-Time and Intraday
7.3. Day-Ahead
7.4. Week-Ahead to Quarterly
7.5. Long-Term Capacity Planning
8. MARKET BY ANALYTICAL TECHNOLOGY
8.1. Introduction
8.2. Statistical and Time-Series Models
8.3. Machine-Learning Predictive Models
8.4. Hybrid Physics, Mobility and Grid-Aware Models
9. MARKET BY DEPLOYMENT ARCHITECTURE
9.1. Introduction
9.2. Cloud-Hosted Forecasting
9.3. On-Site and Edge Forecasting
9.4. Hybrid Cloud-Edge Forecasting
10. MARKET BY CHARGING ENVIRONMENT
10.1. Introduction
10.2. Public and Highway Charging
10.3. Commercial Fleet and Depot Charging
10.4. Workplace and Commercial Premises
10.5. Residential and Utility-Managed Charging
11. MARKET BY CUSTOMER TYPE
11.1. Introduction
11.2. Charge Point Operators
11.3. Fleet and Depot Operators
11.4. Utilities and Energy Providers
11.5. Property and Commercial Site Owners
12. MARKET BY PRINCIPAL DATA INPUTS
12.1. Introduction
12.2. Charging-Station and Session Telemetry
12.3. Vehicle and Telematics Data
12.4. Integrated Grid, Weather and Asset Data
12.5. Synthetic Mobility and Planning Models
13. MARKET BY GEOGRAPHY
13.1. Introduction
13.2. North America
13.2.1. United States
13.2.2. Canada
13.2.3. Mexico
13.3. South America
13.3.1. Brazil
13.3.2. Argentina
13.3.3. Others
13.4. Europe
13.4.1. Germany
13.4.2. United Kingdom
13.4.3. France
13.4.4. Netherlands
13.4.5. Spain
13.4.6. Others
13.5. Middle East and Africa
13.5.1. Saudi Arabia
13.5.2. UAE
13.5.3. South Africa
13.5.4. Others
13.6. Asia Pacific
13.6.1. China
13.6.2. Japan
13.6.3. South Korea
13.6.4. India
13.6.5. Australia
13.6.6. Others
14. COMPETITIVE ENVIRONMENT AND ANALYSIS
14.1. Major Market Players and Strategies
14.2. Market Share Analysis
14.3. Mergers, Acquisitions and Partnerships
14.4. Competitive Dashboard
15. COMPANY PROFILES
15.1. ev.energy
15.2. WeaveGrid
15.3. Synop
15.4. Ampcontrol
15.5. ChargePoint
15.6. Driivz (Vontier)
15.7. Infosys
15.8. CGI
15.9. PowerFlex
15.10. The Mobility House
16. APPENDIX
16.1. Currency
16.2. Assumptions
16.3. Base and Forecast Years
16.4. Benefits to Stakeholders
16.5. Research Methodology
16.6. Abbreviations
Navigate
Trusted by the world's leading organizations