
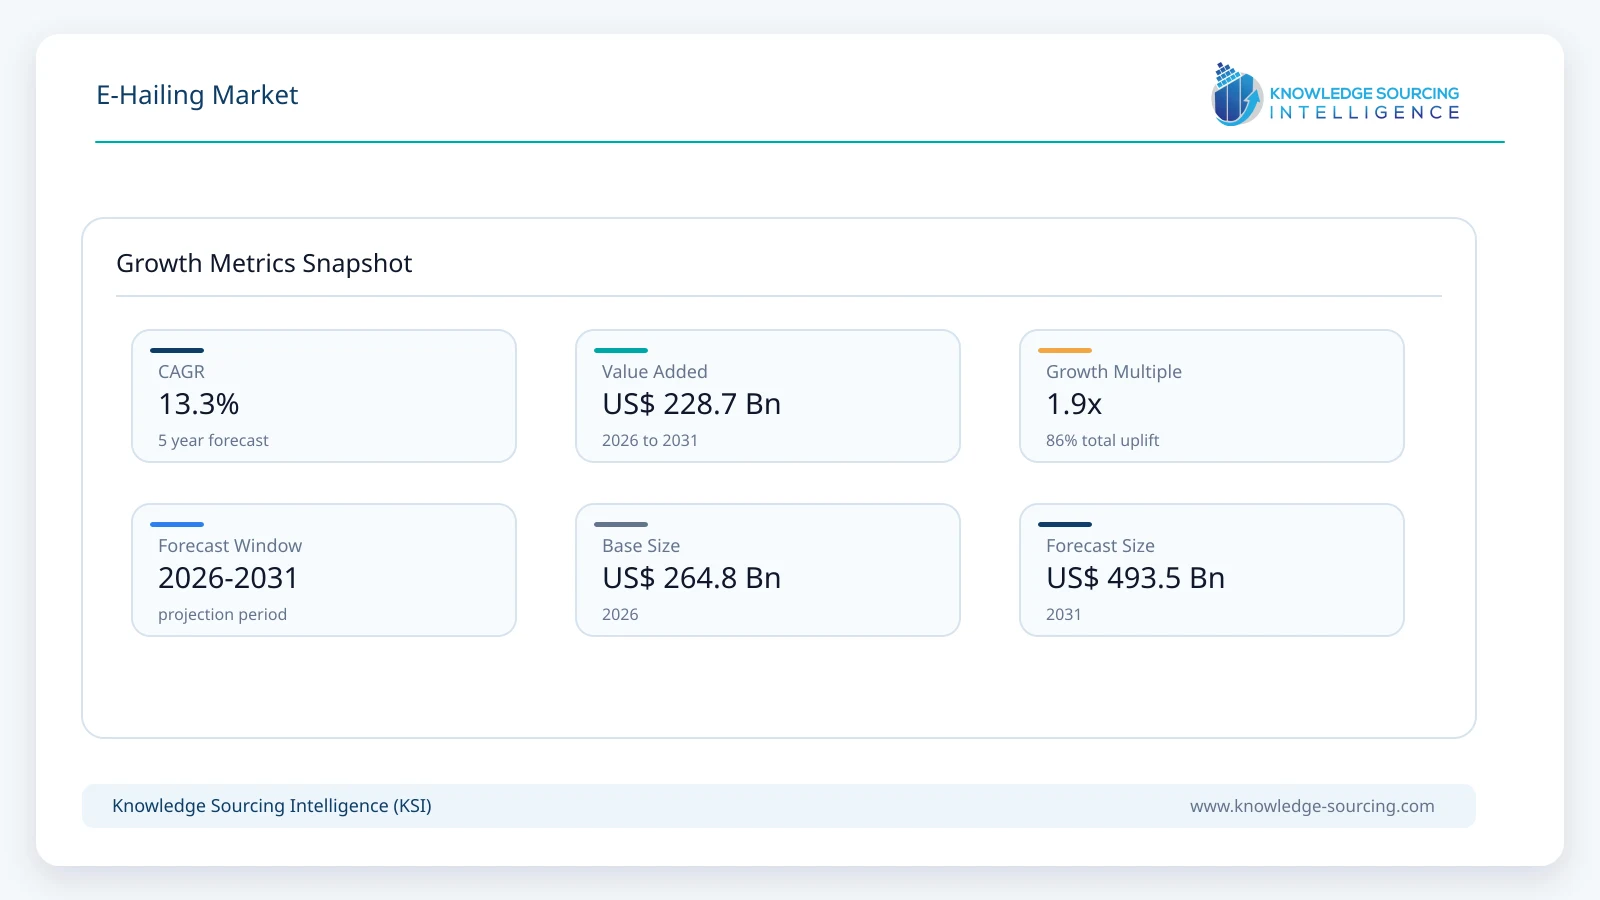
The e-hailing market is forecast to grow at a CAGR of approximately 13.3%, reaching USD 493.5 billion in 2031 from USD 264.8 billion in 2026.
Highlights:
- 1Cars account for approximately 82% of global e-hailing transaction value in 2026.
- 2Two-wheeler e-hailing is projected to grow at approximately 18.4% annually through 2031.
- 3Personal use accounts for approximately 91% of global transaction value in 2026.
- 4Asia Pacific represents approximately 45% of global e-hailing transaction value in 2026.
- 5Uber Mobility generated USD 28.99 billion in gross bookings during Q2 2026.
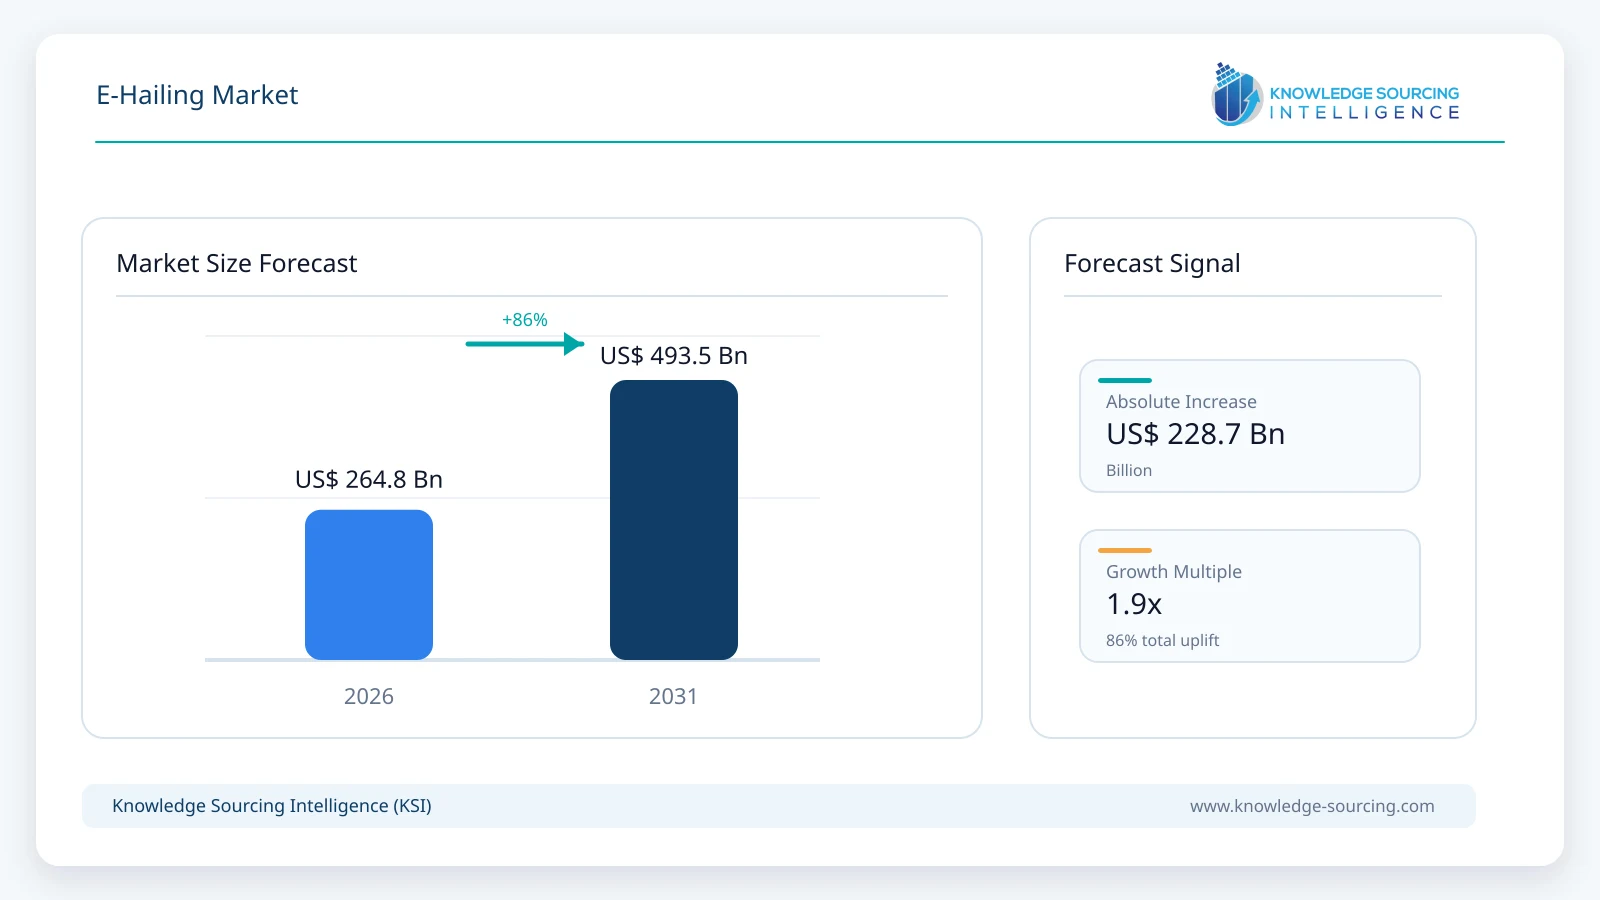
The e-hailing market comprises digital platforms that connect passengers with drivers through mobile applications for on-demand and pre-booked transportation services. The industry includes passenger mobility provided through cars, two-wheelers and three-wheelers, serving both personal and business users across urban and suburban locations. Market value represents the gross passenger transaction value associated with rides booked through these platforms, broadly corresponding with metrics such as Mobility Gross Bookings, Mobility GMV and Mobility GTV reported by major operators.
Current operator disclosures indicate a considerably larger transaction base than previously estimated. Uber generated approximately USD 97 billion in Mobility Gross Bookings during 2025, while DiDi reported USD 64.5 billion of Core Platform GTV across China Mobility and International operations. Lyft generated USD 18.5 billion of Gross Bookings and Grab reported USD 7.9 billion of Mobility GMV during the same year. These companies alone represent a substantial observable base before considering Bolt, inDrive, GoTo, Ola, Rapido, Kakao Mobility, Cabify, Careem and other regional platforms.
Demand for e-hailing services continues to be supported by urban mobility constraints, smartphone adoption, widespread digital payments and changing attitudes toward vehicle ownership. In densely populated cities, consumers increasingly prioritize availability, travel time, transparent pricing and convenience rather than relying exclusively on personal vehicles. Business users are also expanding demand through employee transportation, airport transfers, client travel and centrally managed corporate mobility programs.
Buyer priorities differ across customer groups. Individual users primarily evaluate service availability, estimated pickup time, fare transparency, safety and payment convenience. Corporate buyers place greater emphasis on centralized billing, expense management, travel-policy compliance and service reliability. These requirements encourage operators to invest in dispatch accuracy, driver-quality management, customer support and platform security rather than competing solely through fares.
The industry remains platform-driven, with operators coordinating passengers, drivers, taxi fleets, payment providers, insurers, vehicle suppliers and mapping technology partners. Competitive differentiation increasingly depends on geographic coverage, driver supply, customer retention, multimodal integration and operating efficiency. Artificial intelligence-based dispatch, demand forecasting, fraud detection and dynamic pricing have become core components of platform operations, while electric and autonomous vehicles are gradually becoming integrated into larger mobility ecosystems.
Major Market Drivers
Urban Mobility Pressure and Increasing Frequency of App-Based Transportation
Rapid expansion of metropolitan populations, traffic congestion and parking constraints continue to support app-based transportation. Public transport systems do not always provide adequate door-to-door or first- and last-mile connectivity, allowing e-hailing platforms to address journeys that are inconvenient through fixed-route services. The commercial opportunity is increasingly driven by repeat usage rather than first-time adoption, with e-hailing moving into commuting, shopping, healthcare, leisure and everyday local transportation.
Uber completed 13.6 billion platform trips in 2025, representing approximately 20% growth from the previous year, while Mobility Gross Bookings continued to expand. In Q2 2026, Uber Mobility Gross Bookings reached USD 28.99 billion, increasing 22% year over year on a reported basis. Lyft similarly completed 945.5 million rides during 2025 and reported 262 million rides during Q2 2026, demonstrating continued growth even within comparatively mature North American markets.
Growth is faster where platforms extend app-based transportation to lower-cost journey types. Motorcycle and three-wheeler services are particularly important across India and Southeast Asia because they offer lower fares and can move efficiently through congested urban areas. This broadens the addressable market beyond consumers who regularly use private-car e-hailing.
Enterprise Mobility and Integration of Existing Transport Supply
Organizations are increasingly replacing fragmented taxi procurement with digital mobility platforms that provide centralized administration, employee safety features, expense reporting and travel analytics. Corporate mobility also improves platform utilization during periods when leisure demand is lower and can produce more predictable demand than individual consumer bookings.
Platforms are simultaneously integrating existing licensed transport operators. Lyft’s partnership with Curb expands its access to taxi supply in New York, while its FREENOW business extends the company’s reach across European taxi and private-hire markets. Approximately 30% of Lyft’s North American rideshare rides were linked to a partnership during Q2 2026.
This model is particularly relevant in markets where taxi licensing remains important. Rather than replacing conventional fleets, digital platforms increasingly provide booking, payment, demand generation and dispatch infrastructure to existing operators.
Expansion of Affordable Mobility Across Emerging Markets
Price-sensitive consumers represent a major source of incremental e-hailing demand. Platforms are therefore expanding economy services, motorcycles, three-wheelers and other lower-cost ride options in markets where conventional car e-hailing remains too expensive for everyday use.
Grab’s Q2 2026 mobility transactions increased 28% year over year, materially faster than its 18% increase in Mobility GMV. The difference reflects greater adoption of affordable services and higher-frequency lower-value journeys. Average monthly active driver-partners also increased 19% during the quarter, supporting additional marketplace supply.
India, Indonesia, Vietnam, Thailand, the Philippines, Latin America and several African markets offer significant long-term potential as platforms extend beyond the largest metropolitan areas and adapt vehicle types to local transportation economics.
Major Market Restraints
Driver Retention, Insurance and Operating Economics
Driver availability directly affects passenger wait times and service quality. Fuel prices, vehicle financing, insurance, maintenance expenditure and competing earning opportunities influence driver participation and retention. Platforms must therefore balance consumer pricing with sufficient driver earnings.
Uber reported that its 2025 Mobility cost base included an additional USD 1.6 billion in driver payments and incentives and an USD 851 million increase in insurance expense, driven partly by higher Mobility mileage and insurance cost per mile.
Operators respond with loyalty incentives, earnings programs, insurance products, vehicle financing and flexible scheduling, but these measures increase operating expenditure. Driver economics consequently remain a structural constraint even as platform demand expands.
Regulatory Fragmentation and Driver Classification
Licensing, labour classification, commercial insurance, taxation, vehicle standards and passenger-safety rules differ considerably between jurisdictions. International operators therefore need localized operating models and regulatory capabilities rather than deploying one standard framework globally.
The European Union’s Platform Work Directive illustrates the increasing focus on employment status and algorithmic management. Member states are required to transpose Directive (EU) 2024/2831 by December 2, 2026. The legislation covers determination of employment status, automated monitoring and automated decision-making affecting platform workers.
Changing regulatory requirements can affect platform costs, driver relationships and expansion schedules, particularly when cities introduce fleet restrictions, minimum compensation or additional licensing requirements.
Fare Sensitivity and Competitive Intensity
Consumers can frequently compare competing ride-hailing apps before booking and can substitute public transportation, conventional taxis or personal vehicles when prices rise. Promotional pricing can accelerate customer acquisition but becomes difficult to sustain when driver incentives and insurance costs are also increasing.
Operators are consequently shifting toward personalized promotions, memberships, differentiated vehicle categories and loyalty benefits rather than relying entirely on broad fare discounting. Affordability nevertheless remains particularly important in emerging markets, where small differences in trip prices can materially affect usage frequency.
E-Hailing Market Trends
Artificial Intelligence Is Improving Marketplace Efficiency
Artificial intelligence is becoming increasingly important to dispatch, route optimization, demand forecasting, fraud detection, estimated arrival times and dynamic pricing. Large platforms process billions of journeys annually, meaning incremental improvements in driver utilization and passenger matching can materially influence marketplace economics.
AI also supports safety monitoring and customer service while enabling platforms to forecast where driver supply will be required before demand peaks. The technology increasingly operates as infrastructure behind the service rather than as a separate customer-facing product.
Autonomous Vehicles Are Entering Commercial Ride-Hailing
Autonomous vehicles are moving from technology demonstrations toward integration with commercial e-hailing platforms. Uber and Motional launched robotaxi rides in Las Vegas on March 13, 2026. In May, Uber stated that autonomous rides were available through partner vehicles in parts of Atlanta, Austin, Dallas and Las Vegas.
Uber is pursuing an ecosystem strategy rather than relying on one autonomous technology provider. On March 19, 2026, Uber and Rivian announced a partnership under which Uber will invest up to USD 1.25 billion in Rivian, subject to milestones, with an initial 10,000 R2 robotaxis planned and an option for up to 40,000 additional vehicles. Initial commercial deployment is planned for San Francisco and Miami in 2028.
Autonomous vehicles remain a small proportion of global rides in 2026, but their integration changes the longer-term structure of vehicle supply. Human drivers, licensed taxi fleets and autonomous vehicles are increasingly expected to coexist within hybrid platform marketplaces.
Electric Mobility Is Expanding Through Platform Partnerships
Governments in multiple markets are encouraging electric vehicle adoption through emissions regulation, charging investment and financial incentives. High annual mileage can improve the operating economics of electric vehicles for professional drivers compared with typical private ownership.
E-hailing companies increasingly collaborate with automakers, leasing providers and charging operators to improve access to EVs. Adoption remains uneven because vehicle pricing, financing and public charging availability differ substantially across markets, but electric mobility is increasingly becoming part of driver-supply and regulatory strategies.
E-Hailing and Conventional Taxi Networks Are Converging
The distinction between ride-hailing and conventional taxi services is narrowing. Digital platforms are integrating licensed taxi supply, while taxi operators increasingly rely on app-based booking and digital payment infrastructure.
This convergence allows platforms to increase available vehicle supply without recruiting all drivers independently and provides traditional operators with access to digital customer demand. The trend is particularly relevant in Europe and other regulated transportation markets.
E-Hailing Market Segmentation Analysis
By Vehicle Type
Cars
Cars remain the largest vehicle segment, accounting for approximately 82% of global e-hailing transaction value in 2026. They address the broadest range of passenger requirements across urban, suburban, airport and longer-distance travel. Both personal and enterprise customers rely extensively on car-based services because of comfort, luggage capacity, weather protection and consistent availability.
Demand spans daily commuting, airport transfers, business meetings, healthcare appointments, tourism and leisure. Corporate procurement departments also favour car-based services because they provide standardized journeys, digital reporting and policy-based booking controls.
Competitive differentiation increasingly depends on vehicle quality, estimated arrival accuracy, safety features, premium service tiers and electric vehicle availability. Cars continue to generate substantially higher average transaction values than motorcycles and three-wheelers and remain the largest vehicle category through 2031, although their market share gradually declines as lower-cost mobility expands faster in emerging markets.
By End User
Personal Use
Personal users account for approximately 91% of global e-hailing transaction value in 2026. Demand includes commuting, airport journeys, shopping, leisure, healthcare and first- and last-mile transportation.
Individual users typically prioritize vehicle availability, waiting time, fare visibility, safety and payment convenience. Subscription programs, loyalty products and service differentiation are increasingly being used to improve customer retention as the largest urban markets become more competitive.
Personal transportation remains the largest end-user category through 2031. Business mobility grows faster from a smaller base as companies increasingly centralize employee and client transportation through digital platforms.
Regional Analysis
Asia Pacific
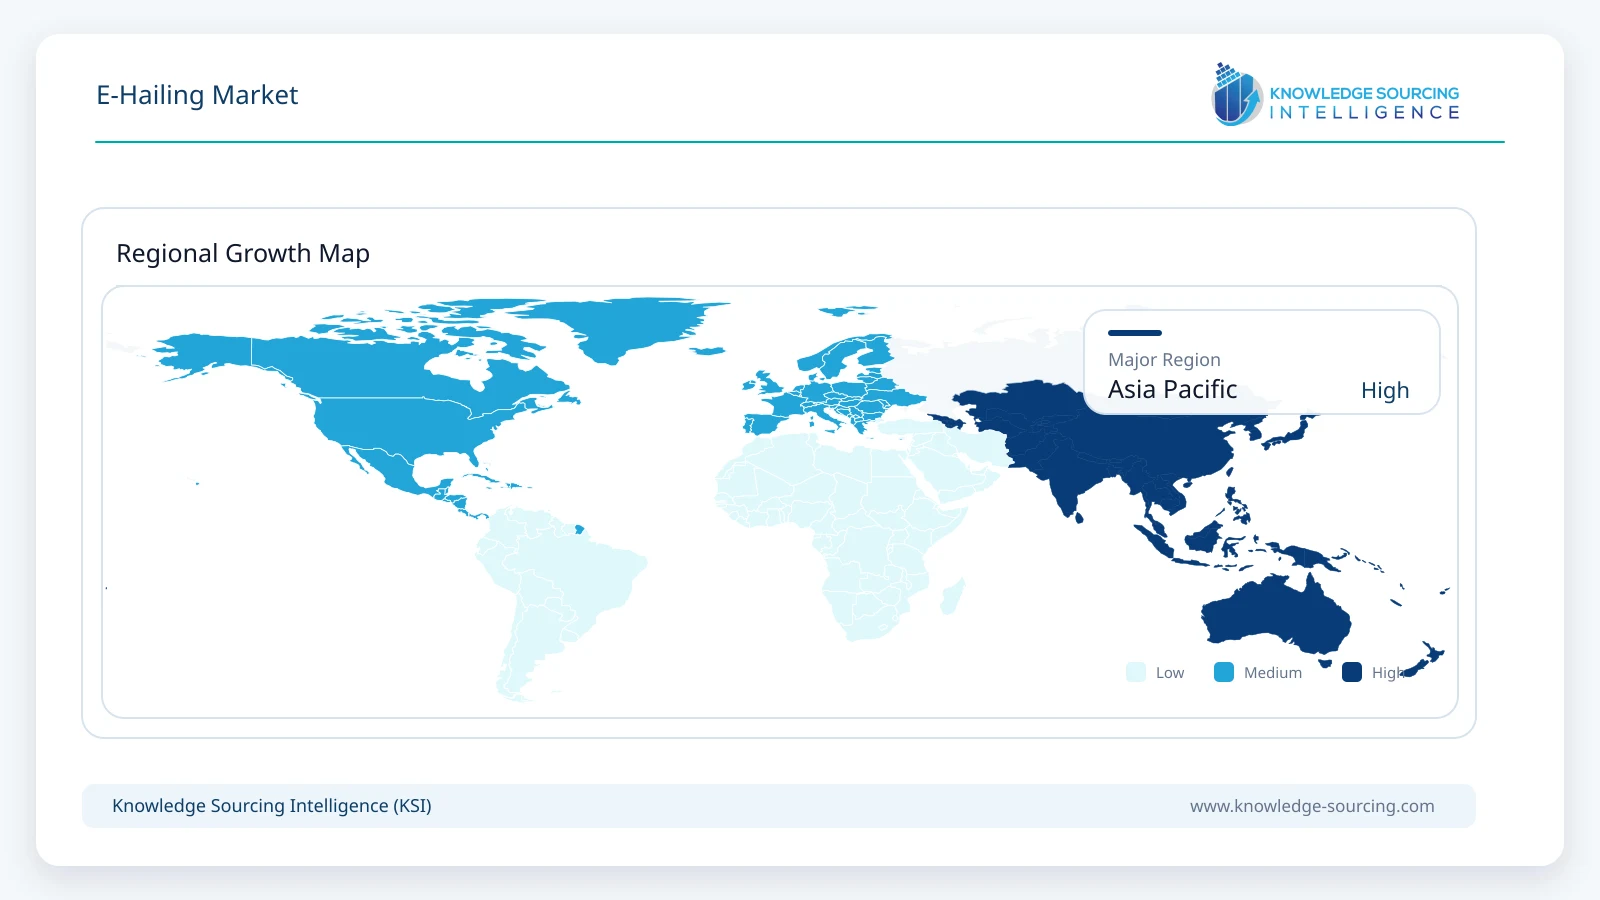
Asia Pacific represents the largest e-hailing market, accounting for approximately 45% of global transaction value in 2026. The region combines China’s large app-based mobility ecosystem with rapidly developing markets in India and Southeast Asia and established digital transportation services in Japan, South Korea and Australia.
DiDi’s China Mobility business recorded 13.7 billion transactions and RMB 333.8 billion in GTV during 2025, demonstrating the scale of the Chinese market. India offers a different growth profile, with cars, motorcycles and three-wheelers all contributing to app-based transportation. Southeast Asia has similarly developed multimodal platforms combining private cars, taxis and motorcycles.
Asia Pacific is projected to increase its global market share through 2031 as India, Southeast Asia and lower-cost mobility formats expand faster than the more mature North American and European markets.
North America
North America maintains a mature e-hailing ecosystem supported by high smartphone penetration, digital payment adoption and strong consumer familiarity with app-based transportation. Business travel, airport mobility and corporate transportation remain important demand pools. Growth increasingly comes from higher ride frequency, partnerships and new transportation formats rather than basic consumer awareness. Regulatory oversight continues to focus on worker classification, insurance, accessibility, passenger safety and autonomous vehicles.
Europe
European demand benefits from urban density and integration with existing taxi and public transportation networks. Consumers increasingly combine public transport with app-based mobility for first- and last-mile travel, while FREENOW and other taxi-platform relationships illustrate greater convergence between conventional fleets and digital booking.
European policy places considerable emphasis on driver rights, licensing, emissions and data protection. These requirements increase compliance costs but also favour established platforms with sufficient regulatory and technology capabilities.
Middle East and Africa
Urban development, tourism and digital economy programs support adoption across major Middle Eastern markets. Saudi Arabia and the UAE continue investing in smart-city infrastructure, digital payments and new transportation technologies.
African markets offer longer-term opportunities through urbanization and limited private-vehicle ownership but remain more constrained by affordability, payment infrastructure and regulatory fragmentation. Lower-cost vehicle formats are therefore important to penetration.
Competitive Landscape
The e-hailing market combines large international platforms with regional operators possessing strong knowledge of local regulation and transportation patterns. Competition extends beyond pricing and increasingly centres on platform reliability, driver availability, safety, enterprise mobility, digital payments, artificial intelligence and integration with additional transport modes.
Uber has the broadest international platform among the largest operators, while DiDi maintains substantial scale in China and selected international markets. Lyft has strengthened its European position through FREENOW, Grab remains a major Southeast Asian mobility platform, and Bolt operates ride-hailing across more than 50 countries. Regional competitors including Ola, Rapido, GoTo/Gojek, Kakao Mobility, Cabify, inDrive, Maxim and Careem remain important because e-hailing continues to be highly localized.
Competitive positioning increasingly depends on partnerships rather than standalone ride services. Taxi integration, electric-vehicle programs, corporate mobility, subscription products and autonomous-vehicle partnerships allow operators to broaden their ecosystems without building every transportation capability internally.
Recent Developments
September 2026: Uber and Wayve launched supervised autonomous rides in London, marking the first autonomous rides made available to the public in the United Kingdom.
June 2026: WeRide and Uber announced plans to launch commercial Robotaxi services in the Greater Zurich Region, with public operations planned through the Uber app subject to regulatory approval.
May 2026: Uber confirmed autonomous vehicles were operating through partners in selected areas of Atlanta, Austin, Dallas and Las Vegas as part of its hybrid human-driver and AV marketplace strategy.
March 2026: Uber and Rivian announced plans for up to 50,000 autonomous R2 robotaxis, with Uber committing up to USD 1.25 billion subject to autonomous-performance milestones.
March 2026: Uber and Motional launched commercial robotaxi rides in Las Vegas using all-electric autonomous Hyundai IONIQ 5 vehicles.
Regulatory and Policy Environment
Government policy continues to shape operating strategies throughout the e-hailing industry. Authorities increasingly require driver background verification, commercial insurance, vehicle inspections, passenger safety standards and digital recordkeeping. Data privacy requirements are particularly important because platforms process payment details, identity information and continuous location data.
Environmental policy is also affecting fleet decisions as cities introduce emissions targets and incentives for electric mobility. E-hailing operators increasingly work with manufacturers, fleet leasing companies and charging providers to improve electric vehicle availability.
Labour regulation remains another significant consideration. Several jurisdictions continue reviewing employment classification, minimum earnings, social protection and algorithmic management of drivers. Operators therefore need to balance regulatory compliance with the flexibility that has historically characterized platform-based work.
Market Outlook
The e-hailing market is expected to continue expanding as app-based transportation becomes more deeply integrated into everyday mobility. Growth increasingly comes from higher ride frequency, penetration of secondary cities, lower-cost vehicle formats, corporate mobility and the integration of licensed taxi supply rather than from basic smartphone adoption alone.
Artificial intelligence improves marketplace efficiency, while electric vehicles and autonomous mobility expand the range of vehicle supply available through platforms. Autonomous vehicles remain a small portion of worldwide rides during the forecast period, but commercial deployments in the United States and Europe indicate that they are becoming part of long-term platform strategy.
Asia Pacific remains the largest regional market and is expected to increase its global share through 2031. North America and Europe continue growing from mature bases, while Latin America, the Middle East, Africa and emerging Asian markets provide stronger percentage expansion.
E-Hailing Market Scope
| Report Metric | Details |
|---|---|
| Total Market Size in 2026 | USD 264.8 billion |
| Total Market Size in 2031 | USD 493.5 billion |
| Forecast Unit | Billion |
| Growth Rate | 13.3% |
| Study Period | 2021 to 2031 |
| Historical Data | 2021 to 2024 |
| Base Year | 2025 |
| Forecast Period | 2026 – 2031 |
| Segmentation | Vehicle Type, End-User, Geography |
| Companies |
|
Market Segmentation
By Vehicle Type
Cars
Two-Wheelers
Three-Wheelers
By End-User
Personal Use
Business
By Geography
North America
United States
Canada
Mexico
South America
Brazil
Argentina
Others
Europe
Germany
France
United Kingdom
Others
Middle East and Africa
Saudi Arabia
UAE
Others
Asia Pacific
China
India
Japan
South Korea
Others
Table of Contents
1. INTRODUCTION
1.1. Market Overview
1.2. Market Definition
1.3. Scope of the Study
1.4. Market Segmentation
1.5. Currency
1.6. Assumptions
1.7. Base and Forecast Years Timeline
1.8. Key Benefits for Stakeholders
2. RESEARCH METHODOLOGY
2.1. Research Design
2.2. Research Process
2.3. Primary Research Framework
2.4. Secondary Research Framework
2.5. Data Triangulation
2.6. Forecast Methodology
3. EXECUTIVE SUMMARY
3.1. Key Findings
3.2. Analyst View
4. MARKET DYNAMICS
4.1. Market Drivers
4.1.1. Urban Mobility Pressure and Increasing Frequency of App-Based Transportation
4.1.2. Enterprise Mobility and Integration of Licensed Taxi Supply
4.1.3. Expansion of Affordable Two-Wheeler and Three-Wheeler Mobility
4.2. Market Restraints
4.2.1. Driver Retention, Insurance and Operating Economics
4.2.2. Regulatory Fragmentation and Driver Employment Classification
4.2.3. Fare Sensitivity and Competitive Incentive Intensity
4.3. Market Opportunities
4.4. Porter’s Five Forces Analysis
4.4.1. Bargaining Power of Suppliers
4.4.2. Bargaining Power of Buyers
4.4.3. Threat of New Entrants
4.4.4. Threat of Substitutes
4.4.5. Competitive Rivalry in the Industry
4.5. Industry Value Chain Analysis
4.6. Regulatory and Policy Environment
4.7. Strategic Recommendations
5. TECHNOLOGICAL OUTLOOK
5.1. Artificial Intelligence-Based Dispatch and Demand Forecasting
5.2. Dynamic Pricing and Route Optimization
5.3. Digital Payment Integration
5.4. Safety and Identity Verification
5.5. Electric Vehicle Integration
5.6. Autonomous Ride-Hailing
5.7. Multimodal Mobility Integration
6. GLOBAL E-HAILING MARKET BY VEHICLE TYPE
6.1. Introduction
6.2. Cars
6.3. Two-Wheelers
6.4. Three-Wheelers
7. GLOBAL E-HAILING MARKET BY END-USER
7.1. Introduction
7.2. Personal Use
7.3. Business
8. GLOBAL E-HAILING MARKET BY GEOGRAPHY
8.1. North America
8.1.1. By Vehicle Type
8.1.2. By End-User
8.1.3. By Country
8.1.3.1. United States
8.1.3.2. Canada
8.1.3.3. Mexico
8.2. South America
8.2.1. By Vehicle Type
8.2.2. By End-User
8.2.3. By Country
8.2.3.1. Brazil
8.2.3.2. Argentina
8.2.3.3. Others
8.3. Europe
8.3.1. By Vehicle Type
8.3.2. By End-User
8.3.3. By Country
8.3.3.1. Germany
8.3.3.2. France
8.3.3.3. United Kingdom
8.3.3.4. Others
8.4. Middle East and Africa
8.4.1. By Vehicle Type
8.4.2. By End-User
8.4.3. By Country
8.4.3.1. Saudi Arabia
8.4.3.2. UAE
8.4.3.3. Others
8.5. Asia Pacific
8.5.1. By Vehicle Type
8.5.2. By End-User
8.5.3. By Country
8.5.3.1. China
8.5.3.2. India
8.5.3.3. Japan
8.5.3.4. South Korea
8.5.3.5. Others
9. COMPETITIVE ENVIRONMENT AND ANALYSIS
9.1. Major Players and Strategy Analysis
9.2. Market Share Analysis
9.3. Mergers, Acquisitions, Agreements and Collaborations
9.4. Competitive Dashboard
10. COMPANY PROFILES
10.1. Uber Technologies, Inc.
10.2. Lyft, Inc.
10.3. DiDi Global Inc.
10.4. ANI Technologies Pvt. Ltd.
10.5. Grab Holdings Limited
10.6. GoTo Group
10.7. Bolt Technology OÜ
10.8. Cabify
10.9. FREENOW by Lyft
10.10. inDrive
10.11. Careem Networks FZ LLC
10.12. Rapido
11. APPENDIX
Navigate
Trusted by the world's leading organizations











