
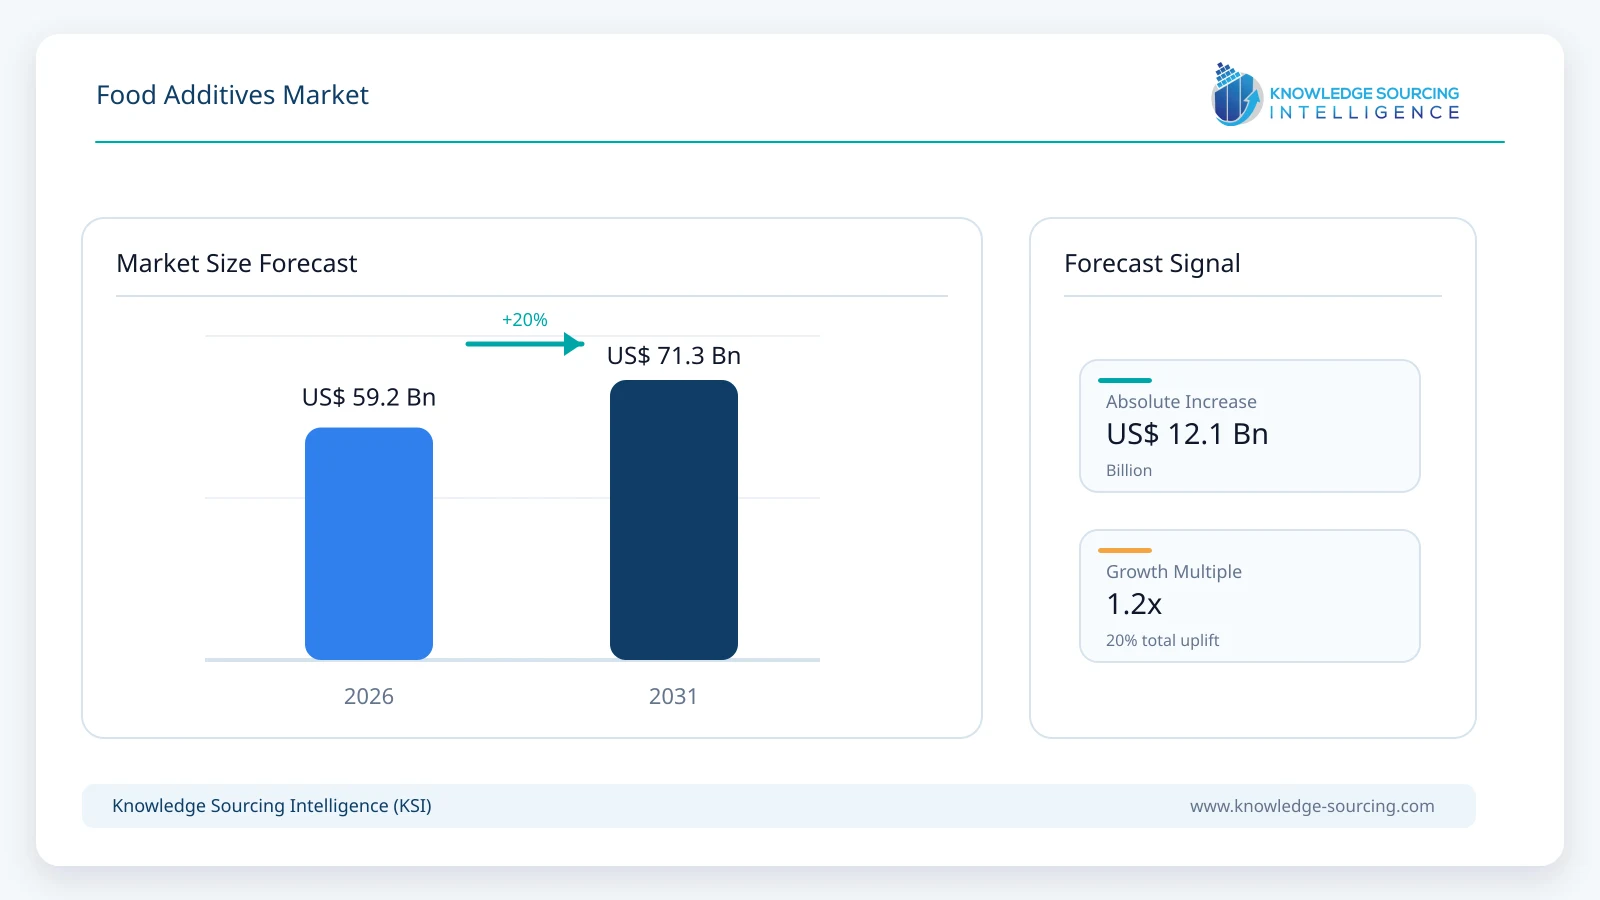
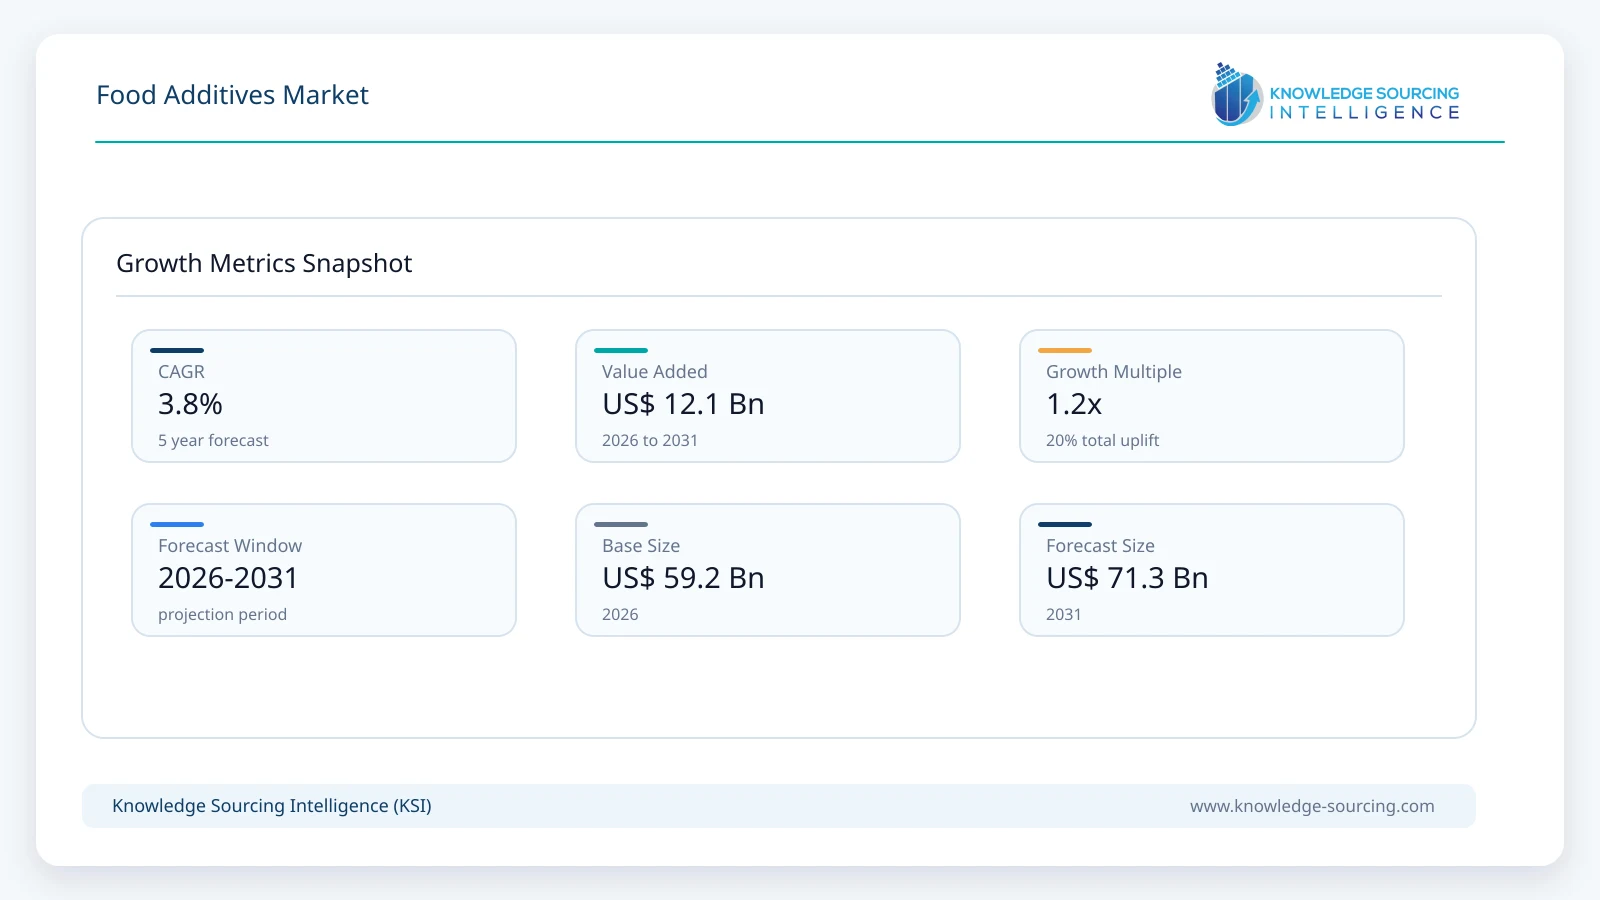
The food additives market is forecast to grow at a CAGR of 3.8%, reaching USD 71.3 billion in 2031 from USD 59.2 billion in 2026.
Highlights:
- 1Flavor category leaderFlavors command the largest share of the Food Additives Market in 2026, valued at US$11.25 billion, representing 19.0% of the total market.
- 2Regional growth hotspotAsia Pacific is set to outperform other major regions, registering a 5.1% CAGR through 2031 as food processing capacity and demand for processed foods continue to expand.
- 3Distribution channel dominanceDirect Sales remains the preferred route to market, reaching US$40.64 billion by 2031 and maintaining a substantial 57.0% market share.
- 4Beverage segment acceleratesThe Beverages application is projected to climb from US$10.06 billion in 2026 to US$12.84 billion in 2031, marking a 5.0% CAGR and making it the fastest-growing application listed.
The need for food additives is tied closely to food production rather than to consumer purchases of additives themselves. As manufacturers reformulate products for lower sugar, lower sodium, longer shelf life, or cleaner labels, ingredient selection increasingly depends on technical performance and regulatory status.
Buyer decisions are shaped by more than unit price. Food manufacturers assess consistency between batches, regulatory approval across target markets, sensory performance, supply security, technical support, and the ability to use an ingredient within existing production lines. Large processors often favor suppliers that can provide formulation support and several additive classes, while smaller manufacturers may rely more heavily on distributors and specialty ingredient suppliers.
The commercial structure therefore spans commodity additives such as sodium benzoate and citrates, specialty sweeteners, hydrocolloids, emulsifiers, flavors, and multifunctional systems. Value is shifting toward suppliers that can solve formulation problems rather than only supply individual compounds. Kerry, for example, reported that its 2025 strategy centered on taste, biotechnology, customer innovation centers, and solutions for nutritional reformulation.
Codex provides an international reference framework through its General Standard for Food Additives, which specifies permitted uses by additive, functional class, and food category. National rules still determine commercial access in individual markets.
Key Market Indicators
Indicator | Latest Evidence | Commercial Meaning |
China meat and poultry output | 100.72 million tonnes, 2025 | Expanding processed protein volumes support demand for preservation, flavor, texture, and stability systems. |
Brazil raw milk acquisition | 27.51 billion litres, 2025 | Higher dairy processing volumes support demand for stabilizers, emulsifiers, flavors, and preservation systems. |
Brazil food and beverage industry sales | BRL 1.388 trillion, 2025 | The scale of downstream food manufacturing creates a large recurring customer base for ingredient suppliers. |
EU food and drink trade surplus | €39.7 billion, 2025 | Cross-border food trade reinforces demand for shelf-life, consistency, labeling compliance, and formulation stability. |
Kerry 2025 revenue | €6.8 billion | The financial scale of an integrated taste and nutrition supplier illustrates the value of broader formulation capabilities. |
Cargill India consumer reach through packaged oil brands | About 25 million people | Cargill's local food platform provides distribution and application access alongside its B2B ingredient portfolio. |
Market Drivers
Reformulation toward lower sugar, salt, and fat. Food manufacturers are using additive systems to change nutritional profiles without sacrificing taste or product texture. Kerry reported continued customer activity around sugar and salt reduction in 2025 and launched Tastesense solutions based on fermentation-derived ingredients. Its Smart Taste platform also addresses reformulation where cost, nutrition, supply, and regulation must be managed together. This expands demand for high-intensity sweeteners, flavor enhancers, masking systems, hydrocolloids, and multifunctional blends.
Growth in processed and convenience food production. Additive consumption follows production volumes in bakery, beverages, dairy, meat, sauces, snacks, and ready meals. China's food manufacturing value added increased in 2025, while output of meat and poultry reached 100.72 million tonnes. Brazil also recorded record slaughter volumes for cattle, chickens, and pigs and higher raw milk acquisition in 2025. These production conditions create recurring formulation needs, particularly where products must withstand distribution, storage, and repeated processing steps.
Demand for shelf-life and product stability. Preservatives, emulsifiers, stabilizers, and hydrocolloids help processors maintain food quality through transport and storage. The commercial value is strongest where manufacturers distribute products across large geographic areas or operate high-volume retail and foodservice channels. Cargill's 2025 product work in India included functional systems for ice cream, frozen desserts, snacks, bakery, and confectionery, with applications designed to control ice-crystal growth, melting, oil absorption, and texture.
Preference for cleaner formulations and recognizable ingredients. Ingredient selection increasingly involves label perception as well as technical function. Cargill's 2025 APAC IngredienTracker study found that more than 70% of surveyed consumers checked labels and showed preferences for natural, familiar, and plant-based ingredients. This encourages suppliers to replace or reduce certain conventional additives, develop plant-derived texturizers and natural preservation systems, and provide formulation support that maintains sensory performance after ingredient changes.
Expansion of integrated formulation services. Food manufacturers increasingly need suppliers to solve several formulation constraints at once. Kerry's 2025 annual report describes more than 60 technology and innovation centers, 1,200-plus scientists, and a portfolio spanning taste, enzymes, food protection, preservation, and nutrition. Cargill similarly emphasizes application centers and customer co-development. Such capabilities increase the commercial value of technical service, formulation expertise, and application testing alongside the additive itself.
Market Restraints and Challenges
Regulatory differences across markets. An additive permitted in one jurisdiction may face different use conditions, labeling rules, or maximum levels elsewhere. Codex provides a common reference through its GSFA, but national systems remain decisive for commercial use. FDA rules in the United States also distinguish food additives from substances qualifying for the GRAS framework. In August 2026, FDA proposed changes intended to increase oversight and transparency around GRAS uses. Suppliers therefore face repeated regulatory review and documentation when selling globally.
Raw-material and supply-chain exposure. Additive producers can face volatility in agricultural feedstocks, fermentation inputs, energy, chemicals, and packaging materials. The effect differs by product. Hydrocolloids and natural flavors can carry agricultural or biological supply risks, while synthetic additives may be more exposed to petrochemical, chemical, or energy costs. Large suppliers respond through sourcing diversification, local production, and broader product portfolios, but smaller producers have less flexibility when input costs rise.
Formulation replacement can raise technical costs. Replacing an established additive is rarely a direct one-for-one substitution. A change in sweetener, preservative, emulsifier, or stabilizer can alter taste, viscosity, shelf life, processing behavior, or appearance. Cargill's development of pectin alternatives and functional systems illustrates the need for application testing when manufacturers seek lower-cost or alternative formulations. Smaller food processors may face greater testing and qualification burdens because they lack internal application laboratories.
Customer price pressure limits additive margins. Many conventional additives are mature products with several qualified suppliers. Buyers can compare specifications and switch suppliers when qualification requirements are manageable. This creates stronger price pressure in standardized additives than in differentiated systems supported by formulation expertise. Suppliers therefore have an incentive to move toward specialty blends, application support, and integrated solutions where technical performance is harder to compare on price alone.
Major Segment Analysis
Stabilizers and Hydrocolloids
Stabilizers and hydrocolloids represent a commercially important additive category because they influence viscosity, suspension, gel formation, moisture retention, mouthfeel, and freeze-thaw stability across several food applications. Dairy products, sauces, bakery products, confectionery, and frozen desserts require different combinations of these functions, making technical formulation support important to purchasing decisions.
Cargill's 2025 product activity in India illustrates this application-driven demand. The company introduced functional systems for dairy and ice cream that address ice-crystal growth, melting behavior, shrinkage, and sensory performance, while also presenting a pectin alternative for gummies and jellies. The segment is valued at USD 7.7 billion in 2026 and is projected to reach USD 9.63 billion by 2031, reflecting a CAGR of 4.60%. Buyers therefore evaluate hydrocolloids on performance at the target dosage, compatibility with other ingredients, process tolerance, and finished-product texture rather than on price alone. Suppliers with application laboratories and broad portfolios can protect margins more effectively because switching requires new formulation trials.
Regional Analysis
Region | Main Demand Signal | Principal Constraint |
North America | Reformulation, convenience foods, specialty nutrition, and established ingredient supply chains | Regulatory scrutiny and customer pressure on formulation cost |
Europe | Strong food processing base, cross-border trade, and demand for controlled formulations | Tight additive rules and growing clean-label pressure |
Asia Pacific | Expanding food production, processed foods, and regional formulation needs | Regulatory fragmentation and uneven technical infrastructure |
South America | High meat, dairy, beverage, and food-processing activity | Input-cost volatility and dependence on imported specialty ingredients |
Middle East and Africa | Food manufacturing investment and demand for shelf-life and imported-food stability | Import dependence and varying regulatory systems |
North American demand is supported by a mature packaged food industry and continued reformulation activity. The segment is projected to reach USD 19.3 billion by 2031, expanding at a 3.0% CAGR. The U.S. regulatory framework requires manufacturers to establish the regulatory basis for food ingredients, while FDA’s proposed 2026 GRAS rule could increase oversight of some ingredient uses. Suppliers with regulatory teams and application support are better positioned where product changes require documented safety and use conditions.
Europe combines a large processed-food base with strict control over additive use. The EU recorded a €39.7 billion food and drink trade surplus in 2025, showing the scale of cross-border food activity that depends on consistent product specifications. Buyers also place greater emphasis on permitted additive status, labeling, traceability, and reformulation capability.
Asia Pacific offers a broader mix of high-volume commodity production and specialized formulation demand. The segment is projected to reach USD 23.5 billion in 2031, representing a 33.0% share. China, India, Japan, South Korea, Thailand, and Indonesia therefore present different opportunities based on food categories, regulation, local manufacturing, and customer sophistication.
South America benefits from large-scale meat and dairy production. Brazil's 2025 data recorded 42.94 million cattle, 6.69 billion chickens, and 60.69 million pigs slaughtered, alongside record raw milk acquisition. This supports preservation, flavor, emulsification, and texture applications. Middle Eastern and African markets remain more dependent on imported ingredients in several food categories, increasing the value of reliable distribution and regional inventory.
Competitive Landscape
The competitive structure is best described as technology-led and service-led, with commodity additives remaining price-sensitive. The listed companies span different positions across flavors, sweeteners, texturizers, preservatives, emulsifiers, and broader food ingredient systems. Cargill and Kerry Group compete partly through broad portfolios and application support, while Ajinomoto has deep exposure to amino-acid-based ingredients and flavor enhancement.
Givaudan, International Flavors & Fragrances, Sensient Technologies, and DSM-Firmenich compete through flavor creation, formulation expertise, and customer development. Tate & Lyle, Ingredion, BASF, Corbion, Palsgaard, Novonesis, and Jungbunzlauer add specialist capabilities across sweeteners, texturizers, preservation, emulsification, fermentation, and organic acids.
IFF's competitive position requires particular attention because the company agreed in May 2026 to sell its Food Ingredients business to CVC for approximately $4.3 billion enterprise value, with completion expected subject to conditions and regulatory approvals. This transaction could alter the competitive structure represented by the current company list during the forecast period.
Recent Developments
June 2026: GRA Nutra introduced AuraBC™, a natural beta-carotene food color produced through non-GMO fermentation technology, expanding sustainable clean-label color solutions for food and beverage manufacturers.
June 2026: Corbion launched LUMI™ Set, a titanium dioxide-free icing stabilizer solution designed to help commercial bakers reformulate products while maintaining visual appeal and supporting clean-label requirements.
June 2026: Ingredion Incorporated announced a recommended all-cash acquisition of Tate & Lyle PLC, expanding its specialty food ingredients portfolio across texturants, sugar reduction, fortification, and multi-ingredient formulation solutions for food and beverage manufacturers.
May 2026: Tate & Lyle expanded its collaboration with BioHarvest to accelerate development of next-generation plant-based sweetener molecules, broadening innovative sugar-reduction ingredient solutions for global food and beverage manufacturers.
Regulatory and Policy Environment
Codex GSFA provides the principal international reference for permitted food additives, with provisions organized by additive, functional class, food category, maximum use level, and conditions of use. Codex also requires additives to meet safety criteria established through JECFA assessment or other accepted safety criteria before inclusion in the standard.
National regulation remains commercially decisive. In the United States, FDA separates food additives subject to premarket review from qualifying GRAS uses. Its August 2026 proposed rule seeks greater oversight and transparency around GRAS determinations. European manufacturers operate under EU additive rules that impose defined conditions of use and labeling requirements. These differences increase the documentation burden for suppliers selling the same additive across several jurisdictions.
For manufacturers, regulatory capability is increasingly part of supplier selection. A supplier must provide specifications, safety information, permitted-use data, traceability, and documentation that supports customer submissions. Products positioned around natural preservation, clean labels, or reformulation still require evidence that the replacement performs adequately under commercial processing conditions.
Outlook and Strategic Implications
Demand through 2031 should remain closely linked to processed food output, reformulation activity, shelf-life requirements, and the expansion of convenience food categories. The strongest commercial opportunities are likely to favor additives that solve more than one formulation problem, especially where manufacturers must reduce sugar or sodium while maintaining taste, texture, stability, and processing efficiency.
Competition will increasingly separate standardized additives from application-led ingredient systems. Commodity products remain exposed to price competition and substitution, while specialized blends and technical services can command greater customer engagement. The strategic value of local application laboratories, regulatory support, reliable regional supply, and formulation expertise should therefore increase.
For suppliers, capacity investment alone will not guarantee stronger market access. Customer qualification, regulatory documentation, application testing, and the ability to adapt formulations to regional requirements will influence retention and pricing power. The forecast period is also likely to bring portfolio reshaping, as illustrated by IFF's planned Food Ingredients divestiture and the continued acquisition activity of diversified ingredient groups.
Food Additives Market Scope:
| Report Metric | Details |
|---|---|
| Total Market Size in 2026 | USD 59.2 billion |
| Total Market Size in 2031 | USD 71.3 billion |
| Forecast Unit | Billion |
| Growth Rate | 3.8% |
| Study Period | 2021 to 2031 |
| Historical Data | 2021 to 2024 |
| Base Year | 2025 |
| Forecast Period | 2026 – 2031 |
| Segmentation | Additives Type, Application, Distribution Channel, Geography |
| Companies |
|
Market Segmentation
By Additive Type
Preservatives
Sodium Benzoate
Potassium Sorbate
Calcium Propionate
Sodium Nitrite and Nitrate
Others
Sweeteners
High-Intensity Sweeteners
Polyols
Steviol Glycosides
Others
Flavors
Natural Flavors
Nature-Identical Flavors
Artificial Flavors
Others
Flavor Enhancers
Monosodium Glutamate (MSG)
Yeast Extracts
Hydrolyzed Vegetable Proteins
Disodium Inosinate and Guanylate
Others
Stabilizers and Hydrocolloids
Gelatin
Pectin
Guar Gum
Xanthan Gum
Carrageenan
Carboxymethyl Cellulose
Others
Emulsifiers
Lecithin
Mono- and Diglycerides
Polysorbates
Sorbitan Esters
Others
By Application
Bakery and Confectionery
Beverages
Dairy and Frozen Desserts
Processed and Convenience Foods
Meat and Seafood Products
Sauces, Dressings and Condiments
Fruits and Vegetables
Others
By Distribution Channel
Direct Sales
Distributors and Specialty Ingredient Suppliers
Online/B2B Platforms
Others
By Geography
North America
United States
Canada
Mexico
South America
Brazil
Argentina
Others
Europe
Germany
United Kingdom
Italy
France
Others
Middle East and Africa
Saudi Arabia
UAE
Others
Asia Pacific
China
Japan
South Korea
India
Thailand
Indonesia
Others
Table of Contents
1. INTRODUCTION
1.1. Market Overview
1.2. Market Definition
1.3. Scope of the Study
1.4. Market Segmentation
1.5. Currency
1.6. Assumptions
1.7. Base and Forecast Years Timeline
1.8. Key benefits for the stakeholders
2. RESEARCH METHODOLOGY
2.1. Research Design
2.2. Research Process
3. EXECUTIVE SUMMARY
3.1. Key Findings
3.2. Analyst View
4. MARKET DYNAMICS
4.1. Market Drivers
4.2. Market Restraints
4.3. Porter’s Five Forces Analysis
4.3.1. Bargaining Power of Suppliers
4.3.2. Bargaining Power of Buyers
4.3.3. Threat of New Entrants
4.3.4. Threat of Substitutes
4.3.5. Competitive Rivalry in the Industry
4.4. Industry Value Chain Analysis
5. FOOD ADDITIVES MARKET BY ADDITIVE TYPE
5.1. Introduction
5.2. Preservatives
5.2.1. Sodium Benzoate
5.2.2. Potassium Sorbate
5.2.3. Calcium Propionate
5.2.4. Sodium Nitrite and Nitrate
5.2.5. Others
5.3. Sweeteners
5.3.1. High-Intensity Sweeteners
5.3.2. Polyols
5.3.3. Steviol Glycosides
5.3.4. Others
5.4. Flavors
5.4.1. Natural Flavors
5.4.2. Nature-Identical Flavors
5.4.3. Artificial Flavors
5.4.4. Others
5.5. Flavor Enhancers
5.5.1. Monosodium Glutamate (MSG)
5.5.2. Yeast Extracts
5.5.3. Hydrolyzed Vegetable Proteins
5.5.4. Disodium Inosinate and Guanylate
5.5.5. Others
5.6. Stabilizers and Hydrocolloids
5.6.1. Gelatin
5.6.2. Pectin
5.6.3. Guar Gum
5.6.4. Xanthan Gum
5.6.5. Carrageenan
5.6.6. Carboxymethyl Cellulose
5.6.7. Others
5.7. Emulsifiers
5.7.1. Lecithin
5.7.2. Mono- and Diglycerides
5.7.3. Polysorbates
5.7.4. Sorbitan Esters
5.7.5. Others
6. FOOD ADDITIVES MARKET BY APPLICATION
6.1. Introduction
6.2. Bakery and Confectionery
6.3. Beverages
6.4. Dairy and Frozen Desserts
6.5. Processed and Convenience Foods
6.6. Meat and Seafood Products
6.7. Sauces, Dressings and Condiments
6.8. Fruits and Vegetables
6.9. Others
7. FOOD ADDITIVES MARKET BY DISTRIBUTION CHANNEL
7.1. Introduction
7.2. Direct Sales
7.3. Distributors and Specialty Ingredient Suppliers
7.4. Online/B2B Platforms
7.5. Others
8. FOOD ADDITIVES MARKET BY GEOGRAPHY
8.1. Introduction
8.2. North America
8.2.1. By Additive Type
8.2.2. By Application
8.2.3. By Distribution Channel
8.2.4. By Country
8.2.4.1. United States
8.2.4.2. Canada
8.2.4.3. Mexico
8.3. South America
8.3.1. By Additive Type
8.3.2. By Application
8.3.3. By Distribution Channel
8.3.4. By Country
8.3.4.1. Brazil
8.3.4.2. Argentina
8.3.4.3. Others
8.4. Europe
8.4.1. By Additive Type
8.4.2. By Application
8.4.3. By Distribution Channel
8.4.4. By Country
8.4.4.1. Germany
8.4.4.2. United Kingdom
8.4.4.3. Italy
8.4.4.4. France
8.4.4.5. Others
8.5. Middle East and Africa
8.5.1. By Additive Type
8.5.2. By Application
8.5.3. By Distribution Channel
8.5.4. By Country
8.5.4.1. Saudi Arabia
8.5.4.2. UAE
8.5.4.3. Others
8.6. Asia Pacific
8.6.1. By Additive Type
8.6.2. By Application
8.6.3. By Distribution Channel
8.6.4. By Country
8.6.4.1. China
8.6.4.2. Japan
8.6.4.3. South Korea
8.6.4.4. India
8.6.4.5. Thailand
8.6.4.6. Indonesia
8.6.4.7. Others
9. COMPETITIVE ENVIRONMENT AND ANALYSIS
9.1. Major Players and Strategy Analysis
9.2. Market Share Analysis
9.3. Mergers, Acquisitions, Agreements, and Collaborations
9.4. Competitive Dashboard
10. COMPANY PROFILES
10.1. Cargill, Incorporated
10.2. Archer Daniels Midland Company (ADM)
10.3. Ingredion Incorporated
10.4. Kerry Group plc
10.5. International Flavors & Fragrances Inc. (IFF)
10.6. Tate & Lyle plc
10.7. DSM-Firmenich AG
10.8. BASF SE
10.9. Givaudan SA
10.10. Ajinomoto Co., Inc.
10.11. Corbion N.V.
10.12. Palsgaard A/S
10.13. Sensient Technologies Corporation
10.14. Novonesis A/S
10.15. Jungbunzlauer Suisse AG
LIST OF FIGURES
LIST OF TABLES
Navigate
Trusted by the world's leading organizations











