Report Overview
Agriculture Micronutrients Market Size:
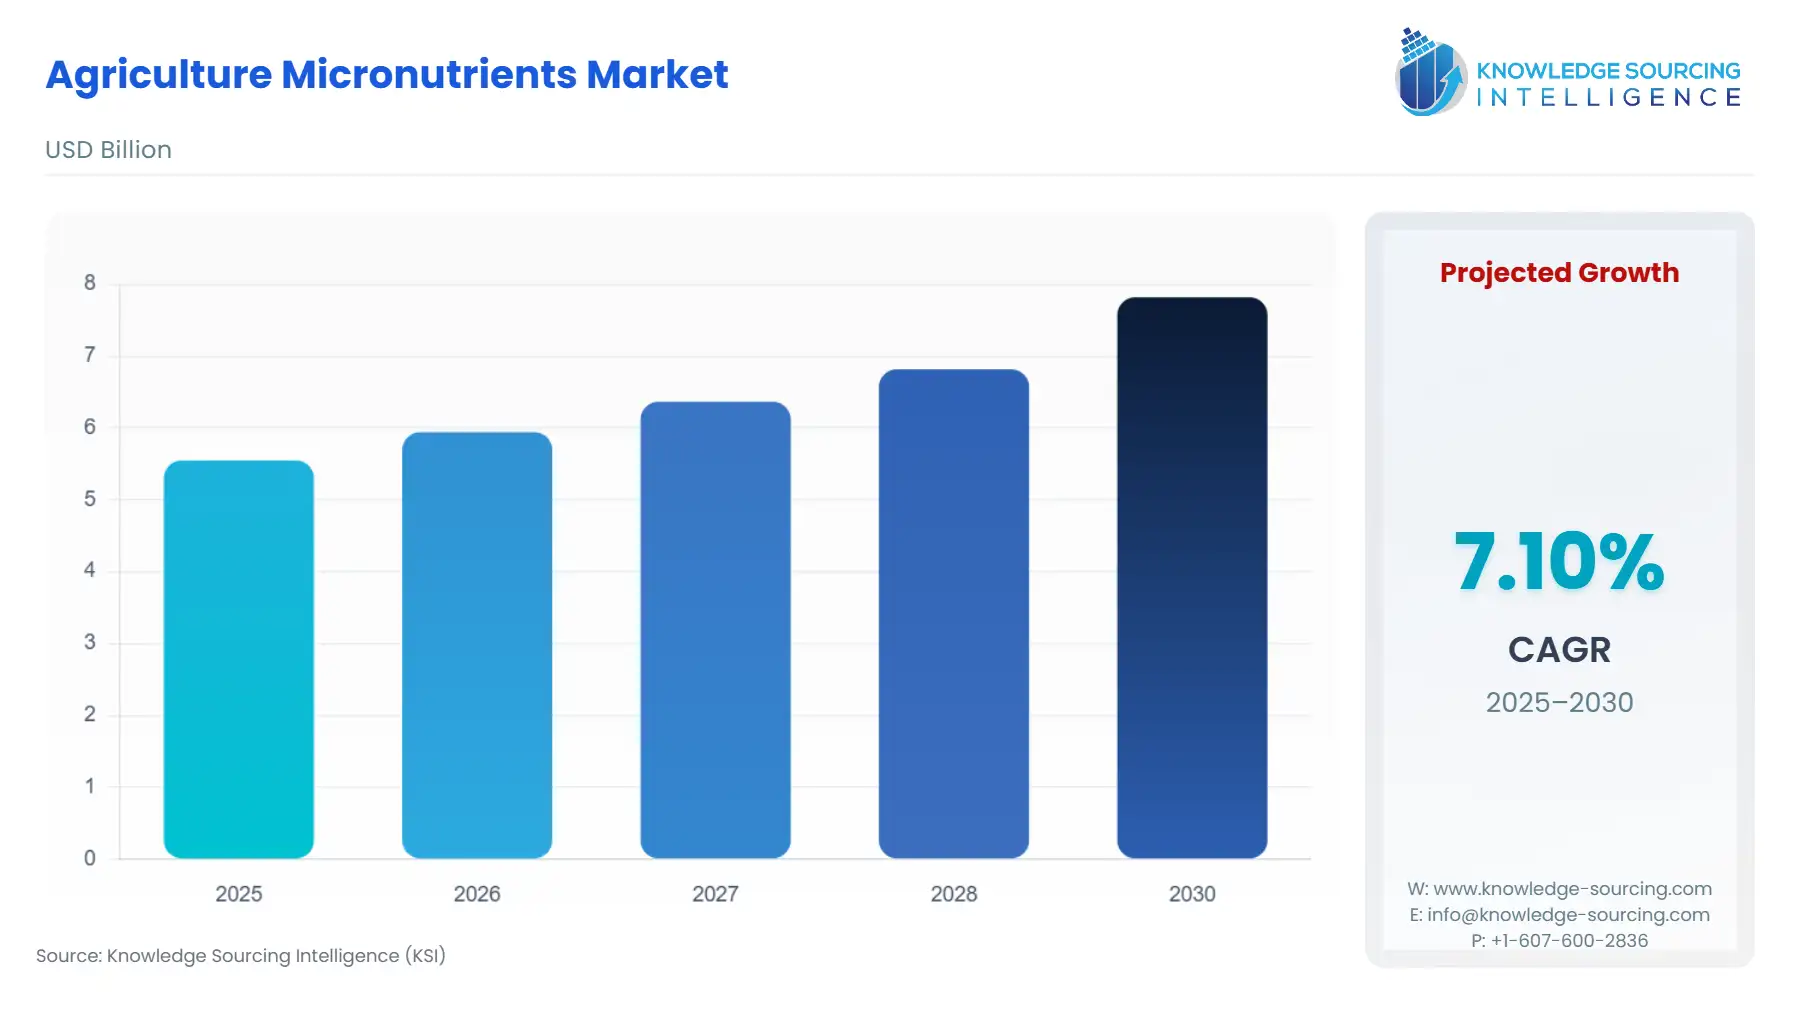
Global Agriculture Micronutrients Market, with a 7.10% CAGR, is projected to increase from USD 5.550 billion in 2025 to USD 7.821 billion in 2030.
Highlights:
- 1Rising population and food insecurity are driving demand for agriculture micronutrients globally.
- 2Increasing soil micronutrient deficiencies are boosting the need for enhanced crop productivity.
- 3Growing awareness of micronutrient benefits is promoting their use in agricultural practices.
- 4Asia Pacific is leading market growth due to advanced farming techniques and quality demands.
Agriculture micronutrients are necessary substances that plants and crops only require in trace amounts. The majority of micronutrients are absorbed by plants at a rate of less than one pound per acre. Despite this minimal demand, micronutrient deficiencies can impair essential plant processes, leading to aberrant plant development and poorer production. If yield potential is being restricted by a micronutrient shortage under such circumstances, expensive, high-need agricultural inputs like nitrogen and water may be squandered. Some examples of essential agriculture micronutrients include Zinc, Copper, Manganese, Iron, Boron, and Molybdenum.
Micronutrients for agriculture applications are essential for plant development and metabolic processes. By fortifying, enlarging, and supplying roots with organic chemicals and proteins, they help in the growth of roots. Crop immunity is also improved by agricultural micronutrients. The market for agriculture micronutrients is expanding due to factors including rising public knowledge of the advantages of crop micronutrients on agricultural productivity and yields. Also, the rise in micronutrient deficiencies in soils worldwide and rising consumer concern about food security are anticipated to fuel market expansion over the projected period.
However, the rising demand for organic fertilizer and a lack of knowledge about micronutrient deficiency, especially in developing nations, hinder the growth of the global agriculture micronutrient market during the analysis period.
Agriculture Micronutrients Market Growth Drivers:
- The rising population and growing food insecurity are anticipated to promote growth for the global agriculture micronutrient market during the projection period.
The world's population is currently estimated by the UN to be 7.3 billion, with a potential increase to 9.7 billion by 2050. As a result of this progress and the increased wealth in developing countries, there is a worldwide food shortage. By 2050, the Food and Agriculture Organisation projects that global food consumption will have increased by 70 per cent. This demonstrates that the predicted growth in global agrifood consumption will outpace the growth in the world population. Reductions in soil fertility are forcing farmers around the world to increase agricultural productivity to feed the growing hungry world.
According to the United States Department of Agriculture, by 2032, 12 per cent of the population in the 77 nations is predicted to be food insecure. By 2032, there are expected to be 577.3 million people who will be food insecure. Crop micronutrient speeds up plants’ overall growth, increases plant resistance towards diseases, helps in nitrogen fixation and maintains the fruit's or vegetable's colour and texture. Therefore a decrease in soil fertility, higher yield productivity and rising food insecurity is propelling the demand for agriculture micronutrients.
Agriculture Micronutrients Market Geographical Outlook:
- Asia Pacific is expected to hold a significant industry share of the global market for agriculture micronutrients during the projection period.
Asia Pacific region is anticipated to hold a significant market share in the agriculture micronutrient market. The market for crop micronutrients is expanding as a result of increased agricultural techniques and rising demand for high-quality goods. The industry's requirement will be supported even more by the direct use of micronutrients for the treatment of plant deficits. According to UNICEF’s most recent report on food security, a projected 375.8 million people experienced hunger in 2020, approximately 54 million more than in 2019 in the Asia Pacific. More than 1.1 billion people in this region alone lacked access to enough food in 2020, an increase of about 150 million people in just one year. For 1.8 billion people in this region, a healthy diet remains out of reach due to the high expense of balanced food as well as chronically high levels of poverty and economic disparity. As a result, rising population and food insecurity are driving the growth agriculture micronutrient market in the region. Under the Asia Pacific region, the primary market includes India, China, Japan, South Korea, Taiwan, Indonesia and Thailand.
List of Top Agriculture Micronutrients Companies:
- AgroLiquid
- Yara International ASA
- Helena Agri-Enterprises, LLC
- Coromandel International Ltd
- IFFCO
Agriculture Micronutrients Market Scope:
| Report Metric | Details |
|---|---|
| Total Market Size in 2026 | USD 5.550 billion |
| Total Market Size in 2031 | USD 7.821 billion |
| Growth Rate | 7.10% |
| Study Period | 2021 to 2031 |
| Historical Data | 2021 to 2024 |
| Base Year | 2025 |
| Forecast Period | 2026 – 2031 |
| Segmentation | Type, Form, Crop Type, Geography |
| Geographical Segmentation | North America, South America, Europe, Middle East and Africa, Asia Pacific |
| Companies |
|
Agriculture Micronutrients Market Segmentation:
- AGRICULTURAL MICRONUTRIENTS MARKET BY TYPE
- Iron
- Manganese
- Zinc
- Copper
- Others
- AGRICULTURAL MICRONUTRIENTS MARKET BY FORM
- Chelated
- Non-Chelated
- Sulphate
- Oxides
- Others
- AGRICULTURAL MICRONUTRIENTS MARKET BY CROP TYPE
- Cereals & Grains
- Pulses & Oilseeds
- Fruits & Vegetables
- Others
- AGRICULTURAL MICRONUTRIENTS MARKET BY MODE OF APPLICATION
- Foliar
- Fertigation
- Others
- AGRICULTURAL MICRONUTRIENTS MARKET BY GEOGRAPHY
- North America
- USA
- Canada
- Mexico
- South America
- Brazil
- Argentina
- Others
- Europe
- Germany
- France
- United Kingdom
- Spain
- Others
- Middle East and Africa
- Saudi Arabia
- UAE
- Israel
- Others
- Asia Pacific
- China
- India
- Japan
- South Korea
- Indonesia
- Taiwan
- Others
- North America
Market Segmentation
By Type
By Form
By Crop Type
By Mode Of Application
By Geography
Table of Contents
1. EXECUTIVE SUMMARY
2. MARKET SNAPSHOT
2.1. Market Overview
2.2. Market Definition
2.3. Scope of the Study
2.4. Market Segmentation
3. BUSINESS LANDSCAPE
3.1. Market Drivers
3.2. Market Restraints
3.3. Market Opportunities
3.4. Porter’s Five Forces Analysis
3.5. Industry Value Chain Analysis
3.6. Policies and Regulations
3.7. Strategic Recommendations
4. TECHNOLOGICAL OUTLOOK
5. AGRICULTURAL MICRONUTRIENTS MARKET BY TYPE
5.1. Introduction
5.2. Iron
5.3. Manganese
5.4. Zinc
5.5. Copper
5.6. Others
6. AGRICULTURAL MICRONUTRIENTS MARKET BY FORM
6.1. Introduction
6.2. Chelated
6.3. Non-Chelated
6.3.1. Sulphate
6.3.2. Oxides
6.3.3. Others
7. AGRICULTURAL MICRONUTRIENTS MARKET BY CROP TYPE
7.1. Introduction
7.2. Cereals & Grains
7.3. Pulses & Oilseeds
7.4. Fruits & Vegetables
7.5. Others
8. AGRICULTURAL MICRONUTRIENTS MARKET BY MODE OF APPLICATION
8.1. Introduction
8.2. Foliar
8.3. Fertigation
8.4. Others
9. AGRICULTURAL MICRONUTRIENTS MARKET BY GEOGRAPHY
9.1. Introduction
9.2. North America
9.2.1. USA
9.2.2. Canada
9.2.3. Mexico
9.3. South America
9.3.1. Brazil
9.3.2. Argentina
9.3.3. Others
9.4. Europe
9.4.1. Germany
9.4.2. France
9.4.3. United Kingdom
9.4.4. Spain
9.4.5. Others
9.5. Middle East and Africa
9.5.1. Saudi Arabia
9.5.2. UAE
9.5.3. Israel
9.5.4. Others
9.6. Asia Pacific
9.6.1. China
9.6.2. India
9.6.3. Japan
9.6.4. South Korea
9.6.5. Indonesia
9.6.6. Taiwan
9.6.7. Others
10. COMPETITIVE ENVIRONMENT AND ANALYSIS
10.1. Major Players and Strategy Analysis
10.2. Market Share Analysis
10.3. Mergers, Acquisitions, Agreements, and Collaborations
10.4. Competitive Dashboard
11. COMPANY PROFILES
11.1. AgroLiquid
11.2. Yara International ASA
11.3. Helena Agri-Enterprises, LLC
11.4. Coromandel International Ltd
11.5. IFFCO
11.6. Compass Minerals
11.7. The Mosaic Company
11.8. Haifa Group
11.9. Syngenta Group
11.10. BASF SE
12. APPENDIX
12.1. Currency
12.2. Assumptions
12.3. Base and Forecast Years Timeline
12.4. Key benefits for the stakeholders
12.5. Research Methodology
12.6. Abbreviations
LIST OF FIGURES
LIST OF TABLES
Navigate
Trusted by the world's leading organizations


