
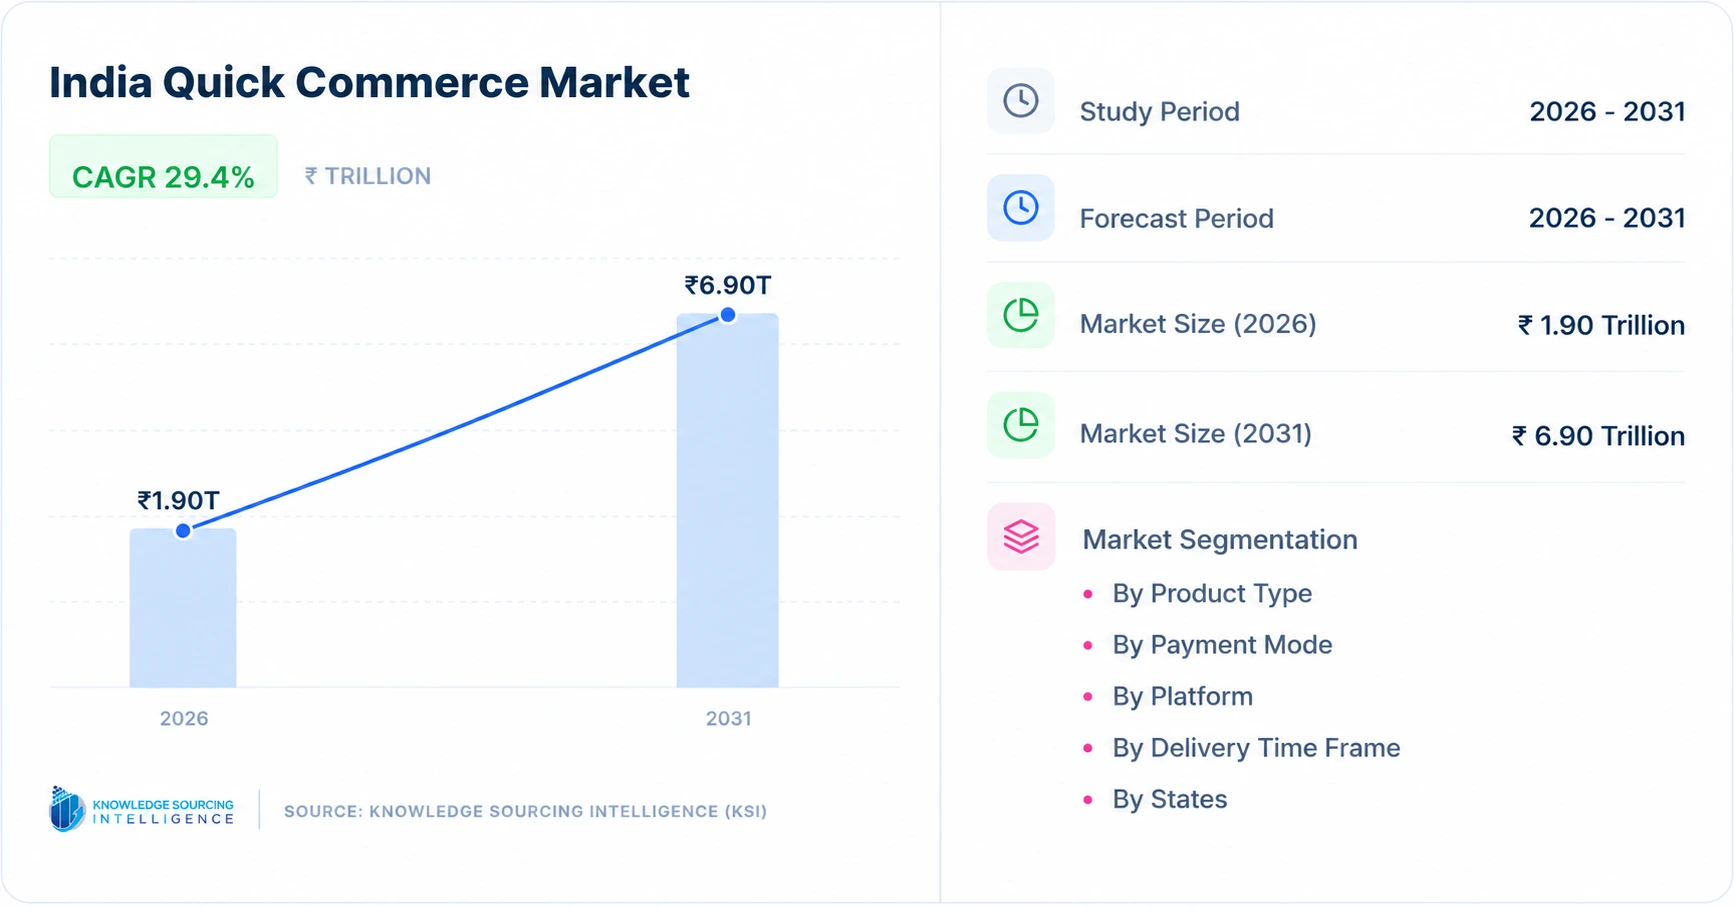
The India Quick Commerce Market is estimated at INR 1.90 trillion in 2026 and is projected to reach INR 6.90 trillion by 2031, growing at a CAGR of approximately 29.4% during this period.
Highlights:
- 1Grocery and Staples account for approximately 36% of market value in 2026, but their share is projected to decline to around 30% by 2031 as non-grocery categories expand faster.
- 2Personal Care Products increase from approximately 10% of market value in 2026 to 13% by 2031.
- 3Digital payment modes account for most quick-commerce transactions, with the Digital Wallet category, including UPI-based payments within the KSI classification, estimated at approximately 72% of value in 2026.
- 4Mobile Applications represent approximately 96% of transactions by value in 2026 and remain the dominant customer interface throughout the forecast period.
- 5The 10–30 minute delivery segment is projected to become the largest delivery window by 2031, increasing from approximately 42% to 48% of market value.
- 6Maharashtra remains the largest named state market, while faster growth in Gujarat, Rajasthan and other states increases the contribution of markets outside the earliest metropolitan clusters.
- 7Blinkit, Zepto and Swiggy Instamart remain the principal specialist operators, while Flipkart Minutes and Amazon Now increase competitive pressure from large e-commerce platforms.
Key Highlights
The market has moved beyond its initial role as a channel for urgent grocery purchases and is developing into a broader retail format covering packaged food, dairy, personal care, household essentials, electronics, beauty products, baby products, pet supplies and selected healthcare items. Grocery continues to provide the largest share of transaction value and order frequency, but non-grocery categories are expected to account for a larger part of market growth through 2031.
Fulfilment capacity has expanded rapidly. Blinkit operated more than 2,400 stores by June 2026, while Swiggy Instamart had more than 1,200 dark stores across over 130 cities in Q1 FY27. Flipkart Minutes, which entered the market later than the three specialist operators, expanded to nearly 1,200 micro-fulfilment centres across more than 150 cities by September 2026 after recording fourfold year-on-year growth. The scale of these networks indicates that dark-store availability is no longer a supporting logistics function. It is one of the principal determinants of service coverage, assortment and delivery economics.
Growth is increasingly determined by the amount of business generated from existing infrastructure. Swiggy stated that 45% or more of Instamart’s store network was contribution-margin positive in Q1 FY27 and that five of its seven largest cities were profitable at the store level. Instamart generated GOV of INR 7,907 crore during the quarter, up 40% year-on-year, while contribution margin improved to negative 0.2% of GOV. Its network had sufficient operating scale to serve more than 14 million monthly transacting users. These results show that the sector is moving from a phase dominated by store openings and customer acquisition toward one where order density, revenue per order and fulfilment utilisation have a greater influence on profitability.
The market mix is also changing. Grocery and staples account for an estimated 36% of market value in 2026, but their share is projected to decline to around 30% by 2031 as higher-value categories grow faster. Personal care, household products, baby products, pet supplies and health-related products increase their share as consumers use quick-commerce platforms for a wider range of routine purchases. The change is already visible in operator data. Instamart’s average order value reached INR 700 in Q4 FY26, up 32.8% year-on-year, with Swiggy attributing part of the increase to a higher non-grocery mix and larger baskets.
Market Growth Drivers and Trends
Expansion of Dark-Store and Micro-Fulfilment Networks
Dark-store density remains one of the main factors determining quick-commerce capacity. Operators need fulfilment points sufficiently close to customers to maintain short delivery times while carrying enough inventory to support repeat purchasing. Blinkit’s network exceeded 2,400 stores by June 2026, while Instamart operated more than 1,200 stores and Flipkart Minutes was approaching the same level by September. Flipkart Minutes expanded from 1,000 micro-fulfilment centres across 130 cities in June to nearly 1,200 centres across more than 150 cities in September 2026.
The economics of network expansion are becoming more disciplined. Instamart added more than 600 stores between Q3 FY25 and Q3 FY26, but Swiggy subsequently shifted toward selective store additions based on local demand, capacity constraints and utilisation. The company stated that its existing network could support more than twice its then-current GOV, indicating that growth can increasingly be generated by higher throughput from existing facilities rather than continuing to expand store count at the same rate.
Non-Grocery Assortment Is Increasing Basket Value
Quick commerce is moving beyond the narrow assortment associated with emergency grocery purchases. Personal care, household goods, electronics, beauty, baby products and pet supplies are becoming more visible because they increase average order value and allow operators to address a larger share of household spending.
Flipkart Minutes reported that its range had expanded into more than 250 categories by June 2026 and that Gen Z consumers were increasingly purchasing beyond daily essentials. By September, Gen Z customers accounted for more than 45% of orders across several non-grocery categories. The company also operates fulfilment centres carrying products ranging from packaged food and personal care to mobile phones and electronics.
Instamart provides similar evidence. Its average order value increased 32.8% year-on-year to INR 700 in Q4 FY26, supported by larger baskets and a sustained increase in non-grocery mix. This shift is reflected in the KSI forecast, where Grocery and Staples remain the largest category but lose six percentage points of market share through 2031 while Personal Care, Household Essentials, Baby Products, Pet Supplies and OTC Medicines gain share.
Store Utilisation and Larger Orders Are Improving Unit Economics
The quick-commerce model requires high order density because dark-store rent, staff, picking operations and delivery infrastructure generate costs regardless of whether a store handles a large or small number of transactions. The improvement in Instamart’s economics illustrates how increasing throughput can change the financial profile of the business. Revenue per order increased by INR 25 from Q4 FY25 to Q1 FY27, while cost per order declined by INR 3. Contribution margin improved by 5.4 percentage points over the same period to negative 0.2% of GOV.
Profitability nevertheless remains uneven. Instamart’s Q4 FY26 quick-commerce adjusted EBITDA loss was INR 858 crore even as its contribution margin improved. The sector therefore cannot yet be described as broadly profitable. Higher order density, advertising income, greater supplier participation, larger baskets and better utilisation of fulfilment space remain necessary before operators consistently generate positive EBITDA across their networks.
Expansion Beyond the Largest Metros Is Increasing the Addressable Market
Quick commerce initially developed around dense neighbourhoods in Bengaluru, Mumbai, Delhi NCR, Hyderabad and a limited number of other large cities. Expansion into Tier II and Tier III markets is now becoming a meaningful part of operator growth. Flipkart Minutes reported that its Tier II and smaller-city customer base increased almost 25 times year-on-year by September 2026, with markets including Ambala, Siliguri, Salem and Tiruppur among the faster-growing locations.
The operating model in these cities is different from that of central Bengaluru or Mumbai. Lower transaction density makes strict ten-minute delivery more expensive and can require larger service radii. The market forecast therefore assumes that the 10–30 minute delivery segment grows faster than strict 10-minute delivery and becomes the largest delivery window by 2031. This allows platforms to extend rapid commerce into markets where customers value convenience but where very dense dark-store coverage is not economically justified.
Quick Commerce Is Becoming Part of Routine Retail Purchasing
Frequent ordering is changing the role of quick-commerce applications within household shopping. Grocery, dairy, bakery, beverages and household products create recurring demand, while higher-value discretionary categories increase basket size. The result is a format that increasingly competes with supermarkets, neighbourhood stores and conventional e-commerce for different portions of the same household budget.
Flipkart Minutes reported that around 60% of its customers returned to shop on the platform by September 2026. Its expansion from daily essentials into hundreds of categories indicates that customer behaviour is developing beyond occasional emergency purchases. Operators with grocery frequency can use the same customer relationship to sell personal care, electronics, beauty and other products without acquiring a new customer for each category.
Market Restraints
Last-Mile Delivery Costs Remain Structurally High
Rapid delivery depends on short distances between the fulfilment centre and the customer. Each order also requires picking, packing and delivery-partner capacity, which makes low-density locations expensive to serve. The model works most effectively where a store can process a high number of transactions within a compact catchment area.
Expansion into smaller cities therefore creates a trade-off between coverage and delivery economics. Platforms can reduce the cost by using wider delivery windows, larger fulfilment centres or higher minimum order requirements, but doing so changes the operating proposition that initially differentiated quick commerce.
Underutilisation of New Dark-Store Capacity
The scale of infrastructure added during 2025 and 2026 creates utilisation risk. Swiggy acknowledged that Instamart’s network remained underutilised and stated that its existing facilities had capacity to handle more than twice current GOV. This is positive for future operating leverage but also means that a portion of existing capacity is not yet generating mature economics.
Further store additions need to be linked to local order growth rather than network size alone. Operators that expand faster than customer demand can face higher occupancy, staffing and inventory costs before stores reach efficient transaction levels.
Wider Assortment Increases Inventory Complexity
Expanding beyond grocery creates both economic benefits and inventory challenges. Fresh products require spoilage control, while electronics, beauty, pet care and other non-grocery categories can have lower purchase frequency and a substantially larger number of stock-keeping units.
Swiggy increased the average size of Instamart dark stores above 4,200 square feet as assortment broadened. Larger stores make slower-moving products economically possible, but they also increase inventory investment and forecasting requirements. The ability to select products according to hyperlocal demand becomes more important as the assortment moves beyond frequently purchased grocery items.
Labour and Regulatory Costs May Increase
The sector depends on a large delivery workforce operating through digital platforms. Social-security requirements, worker protection, insurance and state-level regulation can increase the cost of maintaining rapid delivery networks.
The impact is unlikely to be uniform across operators or states, but labour costs are significant because quick commerce depends on maintaining delivery-partner availability even during peak periods. Higher compliance costs therefore need to be absorbed through greater revenue per order, delivery charges, advertising income or improved operating efficiency.
Competitive Intensity Remains High
Competition is widening beyond Blinkit, Zepto and Instamart. Flipkart Minutes has built nearly 1,200 micro-fulfilment centres across more than 150 cities, while large e-commerce groups have the financial resources, supplier relationships and technology infrastructure required to compete for the same urban customers.
This increases the pressure on pricing, promotions, assortment and service levels. Operators need to improve profitability without allowing customer experience to deteriorate, which makes excessive discounting increasingly difficult to sustain.
By Product Type
Grocery and Staples account for an estimated INR 684 billion, or 36% of market value, in 2026. The segment remains the main source of order frequency because rice, flour, pulses, cooking oil and packaged food are recurring household purchases. It is projected to reach approximately INR 2.07 trillion by 2031, but its share declines to around 30% as higher-value non-grocery categories grow faster.
Snacks and Beverages represent approximately 18% of market value in 2026. The segment fits rapid delivery particularly well because products are frequently purchased for immediate consumption and are easy to store and fulfil. Its share moderates to around 16% by 2031 as the overall assortment becomes more diversified.
Dairy and Bakery account for approximately 12% of the market in 2026. Milk, bread, eggs, curd and related products generate regular repeat orders and help integrate quick commerce into daily household purchasing. The category grows substantially in absolute value but declines to around 10% share as discretionary categories expand.
Personal Care Products are estimated at approximately 10% of market value in 2026 and increase to around 13% by 2031. Beauty, grooming, skincare and personal-hygiene products generally carry higher average selling prices than basic grocery and contribute to larger baskets. Household Essentials increase from around 10% to 11% over the same period.
Baby Products, Pet Supplies and OTC Medicines collectively represent approximately 14% of market value in 2026 and are projected to reach around 20% by 2031. Their higher growth reflects smaller starting bases, repeat purchasing and the value customers place on rapid access to diapers, pet food, wellness products and other urgent household requirements.
By Payment Mode
Digital Wallet accounts for an estimated 72% of market value in 2026 under the current KSI classification. The segment should be interpreted to include UPI-linked digital payments as well as conventional wallets because UPI is now central to Indian mobile commerce. Its share is projected to reach approximately 82% by 2031.
Credit and Debit Cards account for approximately 20% in 2026 and remain relevant for larger purchases, while Cash on Delivery represents around 8%. Cash continues to grow slightly in absolute value but loses most of its share as digital payments become the default method for rapid app-based transactions.
By Platform
Mobile Applications account for approximately 96% of market value in 2026. Location services, saved payment details, product recommendations, real-time order tracking and push notifications make mobile the natural interface for frequent quick-commerce use.
Web Portals account for approximately 4% of transaction value and are projected to fall to around 2% by 2031. Web access remains useful for product discovery and account management but is unlikely to displace the app as the primary ordering interface.
By Delivery Time Frame
Ten-minute delivery accounts for approximately 48% of market value in 2026. It remains the most visible proposition in dense metropolitan neighbourhoods where dark-store proximity can support very short delivery distances. The segment continues to grow rapidly but declines to around 40% of market value by 2031.
The 10–30 minute segment represents approximately 42% in 2026 and is projected to increase to around 48% by 2031. It provides a better balance between delivery speed, service radius and assortment and is particularly suitable for expansion outside the densest metropolitan markets.
The 30–60 minute segment accounts for around 10% in 2026 and increases to approximately 12% by 2031. Larger baskets, broader non-grocery assortments and lower-density locations support its growth even as the broader market remains positioned around rapid fulfilment.
Geographical Outlook
Maharashtra accounts for approximately 22% of market value in 2026, making it the largest named state segment. Mumbai, Pune and adjoining urban markets combine high digital adoption, dense residential clusters and strong spending power, supporting extensive dark-store networks. Its share moderates to around 20% by 2031 as growth becomes more geographically distributed.
Telangana accounts for approximately 12% of market value in 2026, supported principally by Hyderabad, and is projected to represent around 11% in 2031. Haryana represents approximately 11%, with Gurugram and the wider NCR market providing a large concentration of digitally active households.
Gujarat increases from approximately 9% to 10% of market value by 2031, while Rajasthan increases from around 7% to 8%. Expansion in Ahmedabad, Surat, Jaipur and other urban areas supports stronger growth from a lower base.
Other states collectively account for approximately 39% in 2026 and increase to around 41% by 2031. This group includes major operating markets such as Karnataka, Delhi and several expanding Tier II and Tier III cities. The existing KSI state segmentation should be retained for continuity, although the Others category now contains several of the country’s largest quick-commerce locations and should be interpreted carefully.
Recent Developments
In September 2026, Flipkart Minutes completed two years of operations and reported fourfold year-on-year growth. The platform had expanded to nearly 1,200 micro-fulfilment centres across more than 150 cities, while its Tier II and smaller-city customer base increased almost 25-fold. Approximately 60% of customers were returning to purchase from the platform, indicating increasing repeat usage.
In Q1 FY27, Swiggy Instamart reported GOV of INR 7,907 crore, 40% above the previous year. The platform served more than 14 million monthly transacting users through more than 1,200 dark stores across 130+ cities. Contribution margin improved to negative 0.2% of GOV, while more than 45% of stores were contribution-margin positive.
By June 2026, Blinkit operated more than 2,400 stores, giving it the largest disclosed fulfilment footprint among India’s specialist quick-commerce operators.
In June 2026, Flipkart Minutes crossed 1,000 micro-fulfilment centres across more than 130 cities and 8,000 pincodes. Orders had increased fivefold year-on-year and the platform offered products across more than 250 categories.
In Q4 FY26, Instamart generated GOV of INR 7,881 crore, an increase of 68.8% year-on-year. Average order value increased 32.8% to INR 700, supported by larger baskets and a higher non-grocery mix.
Competitive Environment
India’s quick-commerce market remains concentrated around a relatively small number of scaled operators. Blinkit, Zepto and Swiggy Instamart form the core specialist group, while Flipkart Minutes has developed into a material competitor through rapid expansion of its micro-fulfilment network. BB Now remains relevant through BigBasket and Tata’s grocery infrastructure, while Amazon and Reliance add competition from broader retail ecosystems where rapid-delivery formats are deployed.
Blinkit’s advantage is the density and scale of its fulfilment network. Instamart combines its own quick-commerce operation with Swiggy’s broader consumer ecosystem and delivery infrastructure. Zepto remains a specialist quick-commerce company with a strong position among younger urban customers and a broadening assortment.
Flipkart Minutes has a different competitive position because it can combine rapid fulfilment with Flipkart’s existing e-commerce sourcing, technology and customer base. Its progression from 19 cities in August 2025 to more than 150 cities by September 2026 shows how rapidly an established e-commerce platform can build quick-commerce capacity once the operating model is scaled.
Competition increasingly depends on more than delivery time. Store density, assortment, average order value, advertising income, inventory productivity, supplier terms and repeat usage determine whether growth translates into sustainable economics. The sector is therefore moving from competition based primarily on customer acquisition toward competition based on network productivity.
Analyst View
India quick commerce is entering a different phase from the expansion period that defined the market between 2022 and 2025. Customer acceptance of rapid delivery is established in major cities, and the largest operators now control substantial fulfilment networks. The key question through 2031 is how effectively that infrastructure can be used.
The market is projected to increase from INR 1.90 trillion in 2026 to approximately INR 6.90 trillion by 2031, but the composition of that growth changes. Grocery remains the largest category while losing share, non-grocery categories account for more incremental value, the 10–30 minute delivery window becomes more important and a larger proportion of demand comes from outside the earliest metropolitan clusters.
Operators able to increase orders per store while expanding basket value should improve economics more quickly than competitors relying primarily on additional dark-store openings. Greater utilisation also gives platforms more capacity to absorb the cost of entering smaller cities and carrying broader assortments. The competitive advantage therefore shifts gradually from who can build the largest network to who can generate the most productive network by the end of the forecast period.
India Quick Commerce Market Scope
| Report Metric | Details |
|---|---|
| Total Market Size in 2026 | INR 1.90 trillion |
| Total Market Size in 2031 | INR 6.90 trillion |
| Forecast Unit | Trillion |
| Growth Rate | 29.4% |
| Study Period | 2021 to 2031 |
| Historical Data | 2021 to 2024 |
| Base Year | 2025 |
| Forecast Period | 2026 – 2031 |
| Segmentation | Product Type, Payment Mode, Platform, Delivery Time Frame |
| Companies |
|
Market Segmentation
By Product Type
· Grocery and Staples
· Snacks and Beverages
· Dairy and Bakery
· Personal Care Products
· Household Essentials
· Baby Products
· Pet Supplies
· Over-the-Counter Medicines
By Payment Mode
· Digital Wallet
· Credit/Debit Card
· Cash on Delivery
By Platform
· Mobile Applications
· Web Portals
By Delivery Time Frame
· 10 Minutes
· 10–30 Minutes
· 30–60 Minutes
By Geography
· Maharashtra
· Telangana
· Rajasthan
· Haryana
· Gujarat
· Others
Table of Contents
1. EXECUTIVE SUMMARY
2. MARKET SNAPSHOT
2.1. Market Overview
2.2. Market Definition
2.3. Scope of the Study
2.4. Market Segmentation
3. BUSINESS LANDSCAPE
3.1. Market Drivers
3.1.1. Expansion of Dark-Store and Micro-Fulfilment Networks
3.1.2. Growth of Non-Grocery Assortment and Larger Basket Sizes
3.1.3. Improving Store Utilisation and Order Economics
3.1.4. Expansion Into Tier II and Tier III Cities
3.1.5. Increasing Use of Quick Commerce for Routine Retail Purchases
3.2. Market Restraints
3.2.1. High Last-Mile Delivery Cost in Lower-Density Areas
3.2.2. Underutilisation of Newly Added Dark-Store Capacity
3.2.3. Inventory Complexity and Shrinkage Across Wider Assortments
3.2.4. Increasing Labour and Regulatory Compliance Costs
3.2.5. High Competitive Intensity and Continued Capital Requirements
3.3. Market Opportunities
3.4. Porter's Five Forces Analysis
3.5. Industry Value Chain Analysis
3.6. Policies and Regulations
3.7. Strategic Recommendations
4. TECHNOLOGICAL OUTLOOK
4.1. Dark-Store Automation and Warehouse Management
4.2. Demand Forecasting and Inventory Optimisation
4.3. Route Optimisation and Delivery Allocation
4.4. Recommendation and Personalisation Systems
4.5. Payment and Customer-Engagement Technology
5. INDIA QUICK COMMERCE MARKET BY PRODUCT TYPE
5.1. Introduction
5.2. Grocery and Staples
5.3. Snacks and Beverages
5.4. Dairy and Bakery
5.5. Personal Care Products
5.6. Household Essentials
5.7. Baby Products
5.8. Pet Supplies
5.9. Over-the-Counter (OTC) Medicines
6. INDIA QUICK COMMERCE MARKET BY PAYMENT MODE
6.1. Introduction
6.2. Digital Wallet
6.3. Credit/Debit Card
6.4. Cash on Delivery
7. INDIA QUICK COMMERCE MARKET BY PLATFORM
7.1. Introduction
7.2. Mobile Applications
7.3. Web Portals
8. INDIA QUICK COMMERCE MARKET BY DELIVERY TIME FRAME
8.1. Introduction
8.2. 10 Minutes
8.3. 10–30 Minutes
8.4. 30–60 Minutes
9. INDIA QUICK COMMERCE MARKET BY GEOGRAPHY
9.1. Introduction
9.2. Maharashtra
9.3. Telangana
9.4. Rajasthan
9.5. Haryana
9.6. Gujarat
9.7. Others
10. COMPETITIVE ENVIRONMENT AND ANALYSIS
10.1. Major Players and Strategy Analysis
10.2. Market Share Analysis
10.3. Mergers, Acquisitions, Agreements and Collaborations
10.4. Competitive Dashboard
11. COMPANY PROFILES
11.1. Blinkit
11.2. Zepto
11.3. Swiggy Instamart
11.4. Flipkart Minutes
11.5. BB Now
11.6. Amazon Now
11.7. JioMart
12. APPENDIX
12.1. Currency
12.2. Assumptions
12.3. Base and Forecast Years Timeline
12.4. Key Benefits for Stakeholders
12.5. Research Methodology
12.6. Abbreviations
LIST OF FIGURES
LIST OF TABLES
Navigate
Trusted by the world's leading organizations











