Report Overview
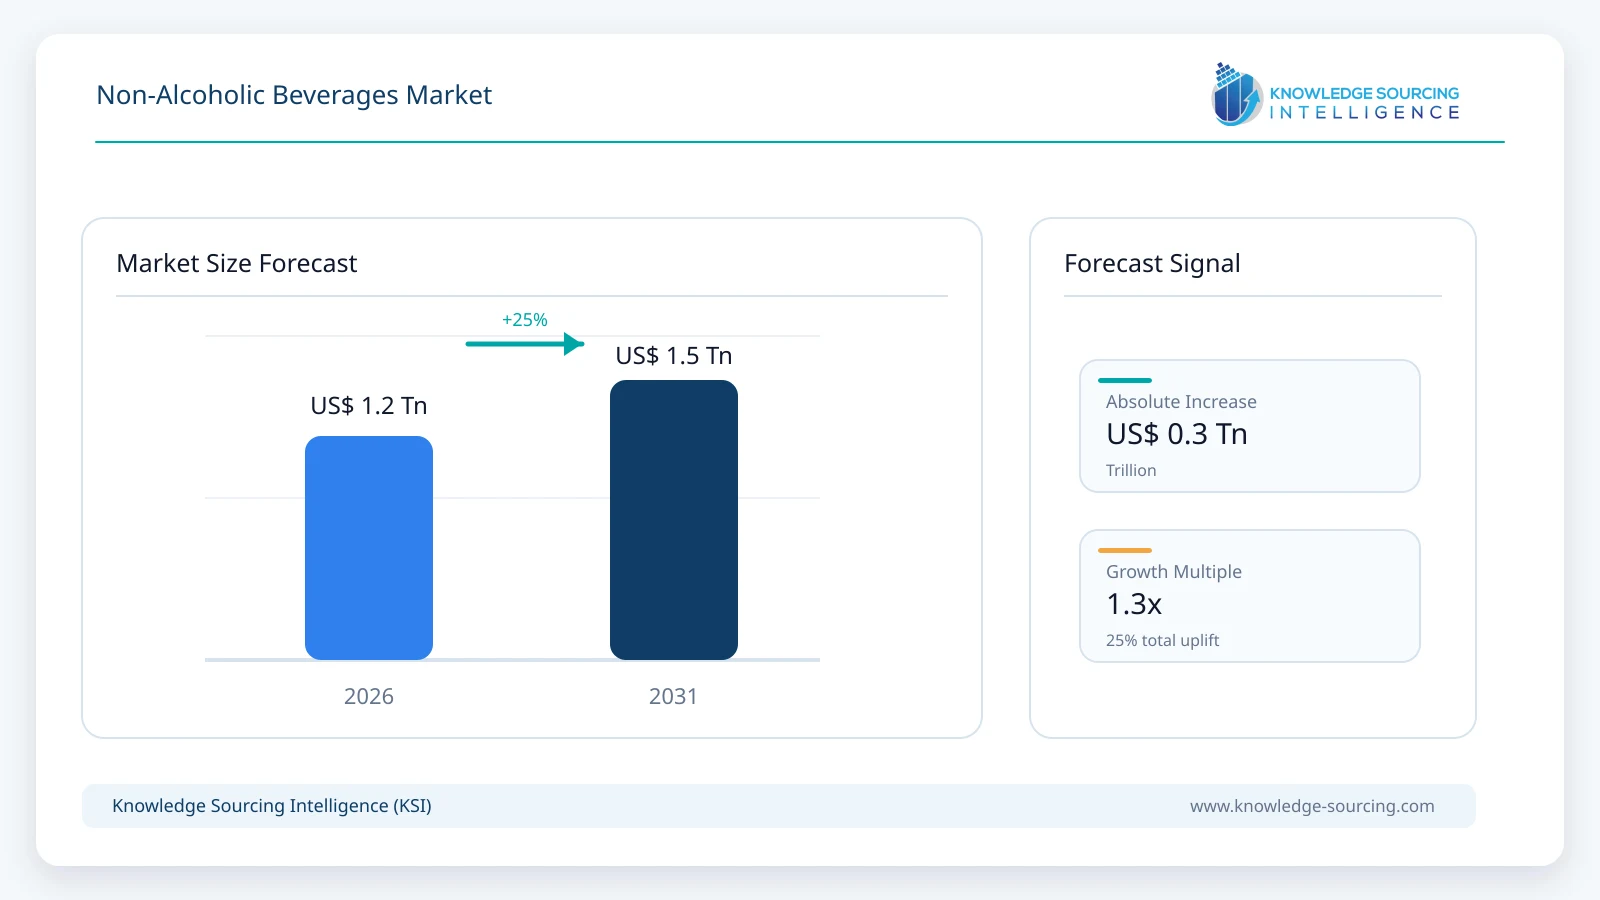
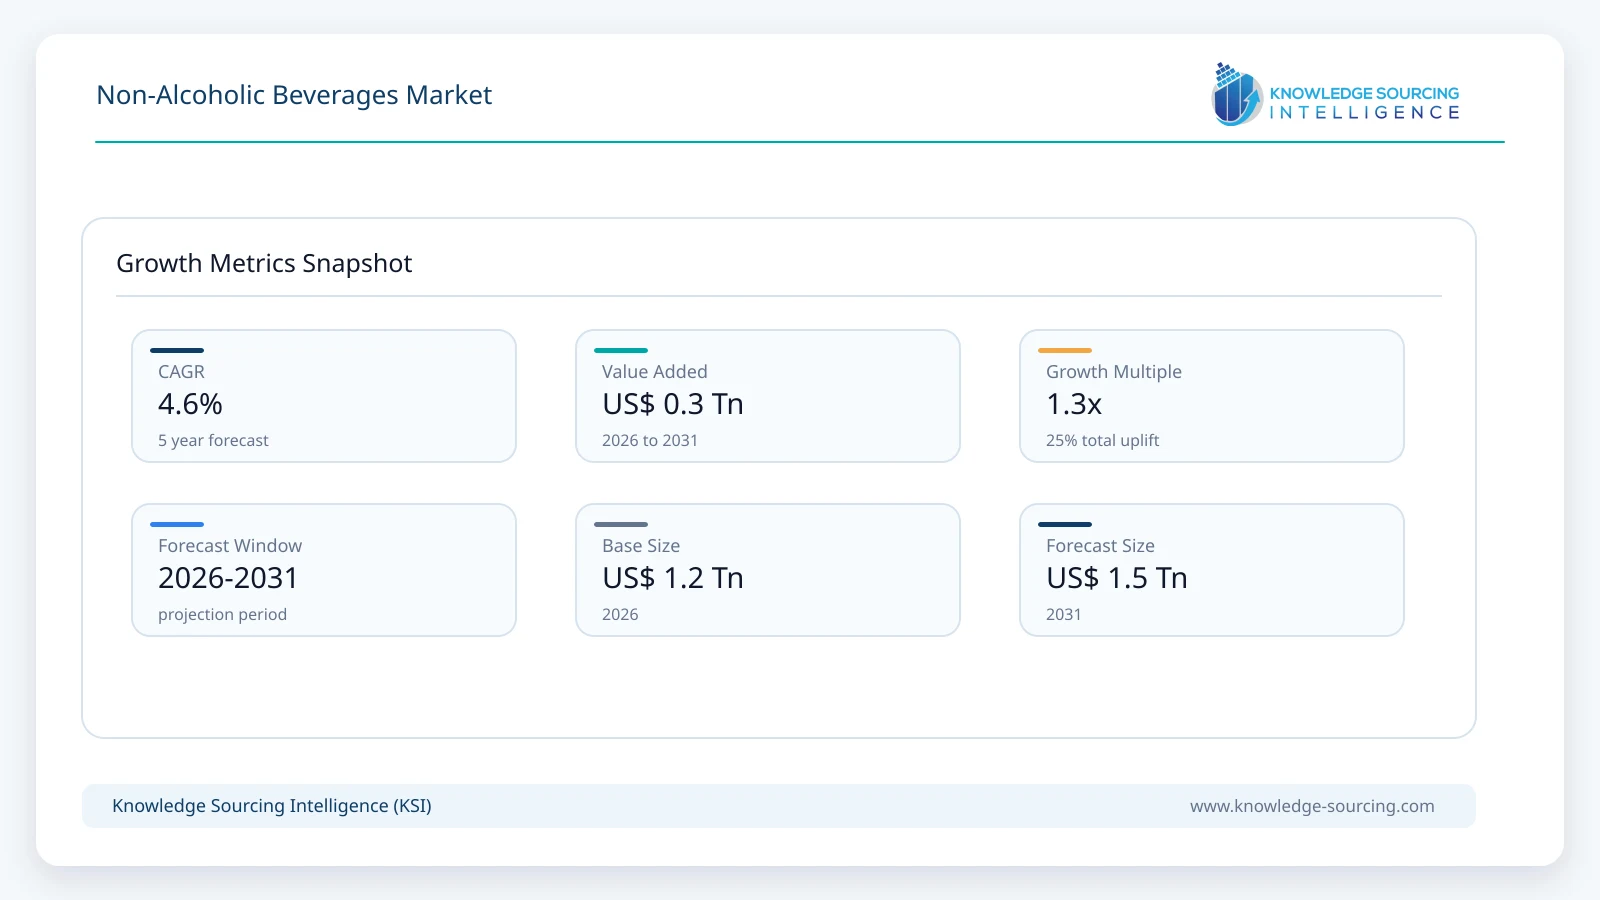
The Non-alcoholic Beverages Market is expected to grow from USD 1.2 trillion in 2026 to USD 1.5 trillion by 2031, at a CAGR of 4.6%.
Highlights:
- 1Largest End-UserThe retail sector, specifically supermarkets and hypermarkets, remains the largest end-user, accounting for over 65% of volume distribution due to the high visibility of diverse product portfolios and competitive pricing strategies.
- 2Regulatory ImpactTiered sugar taxes in over 116 countries have forced a massive industry-wide reformulation, causing a decline in demand for traditional high-sugar CSDs and a surge in low-calorie and diet variants.
- 3Regional LeaderNorth America currently leads the market in terms of value, driven by a high per-capita consumption of functional and premium beverages and a robust health-and-wellness-focused consumer base.
- 4Technology TransitionThere is an accelerating transition toward "Smart Packaging," which uses QR codes and NFC technology to provide consumers with real-time information on ingredient sourcing and carbon footprint, increasing brand transparency.
- 5Pricing SensitivityMiddle-income demographics exhibit high pricing sensitivity toward premium functional drinks, prompting manufacturers to introduce smaller, "entry-level" pack sizes to maintain market penetration during inflationary periods.
The global market for nonalcoholic beverages is growing significantly, driven by changing consumer habits, technological breakthroughs in product development, and favorable macroeconomic factors. Among the various categories at the forefront of expansion, functional drinks, sparkling waters, and non-alcoholic (NA) substitutes for beer, wine, and spirits are the leaders. A growing working population is driving the demand for NA spirits/ready-to-drink (RTD) mocktails.
Health drinks are the new favorites among consumers due to low/no sugar, probiotics, adaptogens, vitamins, plant extracts, and beverages marketed for energy, digestion, immunity, or mental focus. The change in diet-related issues, such as obesity and diabetes, and the general interest in daily wellness and performance, combined with the discredit of soft drinks. This has provided an opportunity for the suppliers who can charge a premium for their functional products and set up new retail channels (health stores, clinics).
Additionally, the customers have come to expect more from their drinks than just being a thirst quencher. This has contributed to the growth of functional beverages, such as probiotic-containing drinks for gut health, stress-relief adaptogens like ashwagandha, and immunity-boosting vitamins/minerals, like vitamin-fortified waters.
The modern lifestyles, especially of the youth, are paving the way for new drinking patterns and hence changing the drinking habits publicly. The "sober-curious" movement, previously a minor trend, has become a lifestyle choice for a large part of Gen Z and Millennials, who prefer alcohol-free beverages for social events such as dinners, parties, and casual meet-ups. Moreover, the study by the National Institute for Health and Care Research (NIHR) of May 2020, on 800 weekly alcohol drinkers in the UK reported that participants were more likely to select non-alcoholic drinks, i.e., 49% if the greater proportion of non-alcoholic drink options are available, meanwhile, 26% participants were more likely to select non-alcoholic drinks if a greater proportion of alcoholic drinks is available.
Additionally, the data from Circana reports that the top reasons for not drinking alcohol among Americans 21 or above in 2024 were: 52% just don’t want to drink, 33% dislike the taste of alcohol, 29% aim to improve their physical health, 28% are afraid of becoming addicted, 21% want to save money, and 20% seek to enhance their mental health.
The combination of population characteristics and increasing wealth is acting as a demand multiplier, mainly in the fast-growing areas. The demand, driven by population dynamics and increasing wealth, is particularly strong in the fastest-growing regions. The increased birth rate worldwide, along with the aging and health-conscious population in the industrialized world, and the expanding middle class in developing countries, contribute to a large consumer market. Moreover, campaigns such as "Dry January" or "Sober October" have gone from being temporary tests to permanent decisions.
Another major trend is focusing on product innovation through the provision of alcoholic alternatives in taste, flavor, and texture, along with new companies entering the non-alcoholic segment of the beverage industry. For instance, on 10 December 2025, the announcement of Thrive Market's "dry" policy came along with the discontinuation of alcoholic beverages and the introduction of the new category of non-alcoholic drinks with over 100 SKUs, consisting of non-alcoholic beers, wines, and cocktails, which was done to meet the growing demand of members and take part in the shifting habits of American drinkers before Dry January. The decision aligns with the moderation trend among consumers and also comes at a time when non-alcoholic drinks are expected to grow to a ~$5 billion category by 2028, according to IWSR, and makes nationwide shipping easier due to fewer regulations compared to alcohol.
Market Dynamics
Market Drivers
Expansion of Functional Nutrition: Growing awareness of gut health and cognitive performance drives demand for beverages containing probiotics, prebiotics, and adaptogens, as consumers increasingly view beverages as "food as medicine."
Urbanization and Convenience: The rise of on-the-go lifestyles in emerging economies increases the demand for RTD formats and portable packaging, such as aluminum cans and PET bottles, which offer convenience for busy urban populations.
Government-Led Health Initiatives: Public health campaigns and mandatory front-of-pack labeling (FOPL) regarding sugar and calorie content act as a driver for the development and consumption of healthier beverage alternatives.
Digital Retail Proliferation: The expansion of online grocery platforms and subscription-based delivery models increases the accessibility of niche and premium beverage brands, broadening the consumer base beyond traditional brick-and-mortar limitations.
Market Restraints and Opportunities
Raw Material Price Volatility: Fluctuations in the prices of aluminum and energy impact manufacturing margins, presenting a risk to stable pricing and consistent supply in logistics-heavy markets.
Stringent Plastic Regulations: Increasingly rigorous bans on single-use plastics and mandates for minimum recycled content (rPET) impose significant operational costs and require substantial capital investment in new packaging technologies.
Specialty Opportunity in "Low-to-No" Alcohol: The growing "sober curious" movement presents a major opportunity for non-alcoholic beers, wines, and spirits that mimic the flavor profiles of traditional alcoholic drinks without the health risks.
Emerging Market Infrastructure: Untapped potential in rural regions of Asia and Africa offers opportunities for brands that can navigate localized supply chain challenges and establish affordable, long-life beverage options.
Raw Material and Pricing Analysis
The pricing of non-alcoholic beverages is inextricably linked to the cost of packaging materials and agricultural inputs. Aluminum, which accounts for a significant portion of the cost of canned beverages, saw a producer price index increase of approximately 4.5% in late 2025. This volatility is compounded by the rising cost of PET resins, driven by oil price fluctuations and the increased demand for recycled PET (rPET), which often carries a price premium over virgin plastic. In the United States, soft drink producer prices rose by approximately 3.0% in 2025, reflecting these underlying commodity pressures.
Agricultural raw materials such as sugar, coffee, and fruit concentrates also exhibit high price sensitivity to climate events and trade policies. For instance, the transition to natural sweeteners like Stevia or Monk Fruit, while favored by regulators, involves higher procurement costs compared to traditional high-fructose corn syrup. Manufacturers manage these risks through multi-year hedging contracts and "least-cost formulation" strategies. However, the energy-intensive nature of beverage production, including pasteurization, carbonation, and refrigeration, makes the industry highly sensitive to domestic energy price hikes, often leading to incremental price increases for the end consumer.
Supply Chain Analysis
The non-alcoholic beverage supply chain is characterized by a "hub-and-spoke" model, where concentrated syrups are produced in central facilities and shipped to regional bottling plants. This model reduces transportation costs by allowing for the localized addition of water and carbonation. However, this structure is currently under pressure from energy-intensive manufacturing requirements and the need for more specialized logistics to handle "cold-chain" functional products. Production concentration remains high, with a few global entities controlling the majority of the bottling and distribution infrastructure through complex franchise and licensing agreements.
Transportation constraints, particularly in maritime and long-haul trucking, represent a significant regional risk. The industry is moving toward "integrated manufacturing" where packaging production (such as blow-molding PET bottles) is co-located within the beverage filling plant to minimize logistics-related carbon emissions. Furthermore, the supply chain is increasingly influenced by "Extended Producer Responsibility" (EPR) laws, which hold manufacturers accountable for the entire lifecycle of their packaging. This necessitates a more circular supply chain, where empty containers are recovered, cleaned, and recycled back into the production loop, requiring new partnerships with specialized waste management firms.
Government Regulations
Jurisdiction | Key Regulation / Agency | Market Impact Analysis |
Europe | Regulation (EU) 2025/40 (PPWR) | Mandates 10% reusable packaging for beverages by 2030 and sets a 30% recycled plastic target for single-use bottles by the same year. |
United States | FDA (Food and Drug Administration) | Enforced a ban on brominated vegetable oil (BVO) in 2024 and implemented updated allergen labeling for milk and eggs in early 2025. |
Global | WHO (World Health Organization) | Advocated for standardized, high-rate excise taxes on sugar-sweetened beverages (SSBs), currently adopted by over 116 countries to reduce NCDs. |
Asia (Thailand) | Excise Department (Sugar Tax) | Implemented a tiered tax system that increases the levy based on sugar grams per 100ml, driving rapid industry reformulation toward low-sugar variants. |
Key Developments
May 2026: Refresco completed the acquisition of SunOpta, strengthening North American beverage manufacturing and supply-chain capabilities across plant-based, functional, and non-alcoholic beverage categories.
March 2026: Constellation Brands announced the acquisition of remaining ownership in HOPWTR, expanding its premium non-alcoholic beverage portfolio featuring hops-infused functional sparkling drinks with adaptogens and nootropics.
August 2025: Celsius Holdings and PepsiCo expanded their strategic partnership, integrating Alani Nu distribution into PepsiCo’s network and strengthening non-alcoholic energy beverage market presence.
July 2025: PepsiCo launched Pepsi® Prebiotic Cola, the company’s first functional cola containing prebiotic fiber, reduced sugar, and no artificial sweeteners within the traditional soft drinks category.
March 2025: PepsiCo announced the acquisition of prebiotic soda brand Poppi for US$1.95 billion, expanding its better-for-you non-alcoholic beverage portfolio with functional soda offerings targeting health-conscious consumers.
February 2025: Constellation Brands' venture capital arm made a minority investment in Hiyo, a non-alcoholic functional beverage brand. Hiyo's products are social tonics crafted with a proprietary blend of adaptogens, nootropics, and botanicals.
Market Segmentation
By Product Type: Functional Beverages
Functional beverages, including energy and sports drinks, represent the fastest-growing segment in the non-alcoholic market. Demand is driven by the "active lifestyle" trend and the normalization of performance-enhancing drinks among mainstream consumers. In 2025, energy drinks alone accounted for nearly 40% of the functional category, with innovation focusing on natural caffeine sources like green tea and guayusa. The segment is also seeing a surge in "mental clarity" drinks that incorporate nootropics, targeting professionals and students. This high-growth area benefits from premium pricing, as consumers are willing to pay more for products that offer quantifiable health or performance benefits.
By Packaging: Aluminum Cans
Aluminum cans are increasingly favored over PET and glass due to their superior recyclability and lightweight nature, which reduces transportation-related carbon emissions. In 2025, the aluminum segment held over 72% of the beverage metal can market revenue. The demand for cans is further bolstered by the rise of premium RTD teas and craft sodas, which utilize the can's 360-degree labeling surface for high-impact branding. From a supply chain perspective, aluminum offers better flavor preservation and protection from light and oxygen, which is essential for preserving the efficacy of functional ingredients in modern beverage formulations.
By Distribution Channel: Food Service Sector
The food service sector, including restaurants, cafes, and hotels, provides a critical high-margin channel for non-alcoholic beverages. Operational advantages in this segment include the use of fountain systems, which offer significantly higher profit margins than pre-packaged bottles by reducing packaging and transport weight. The sector also serves as an important "trial ground" for new flavors and premium varieties, where consumer adoption in a restaurant setting often precedes volume sales in retail. As "non-alcoholic pairings" become a trend in fine dining, this channel is increasingly demanding sophisticated, low-sugar beverages with complex flavor profiles.
Regional Analysis
North America
North America remains the dominant market by value, characterized by a highly mature industry and sophisticated consumer preferences. The "better-for-you" movement, with a significant shift toward sparkling waters and energy drinks with zero sugar, drives this demand. The regional industrial base is robust, featuring advanced manufacturing facilities and a highly integrated distribution network. Regulatory influence is high, with various U.S. states implementing Extended Producer Responsibility (EPR) laws that are forcing manufacturers to invest in closed-loop recycling infrastructure.
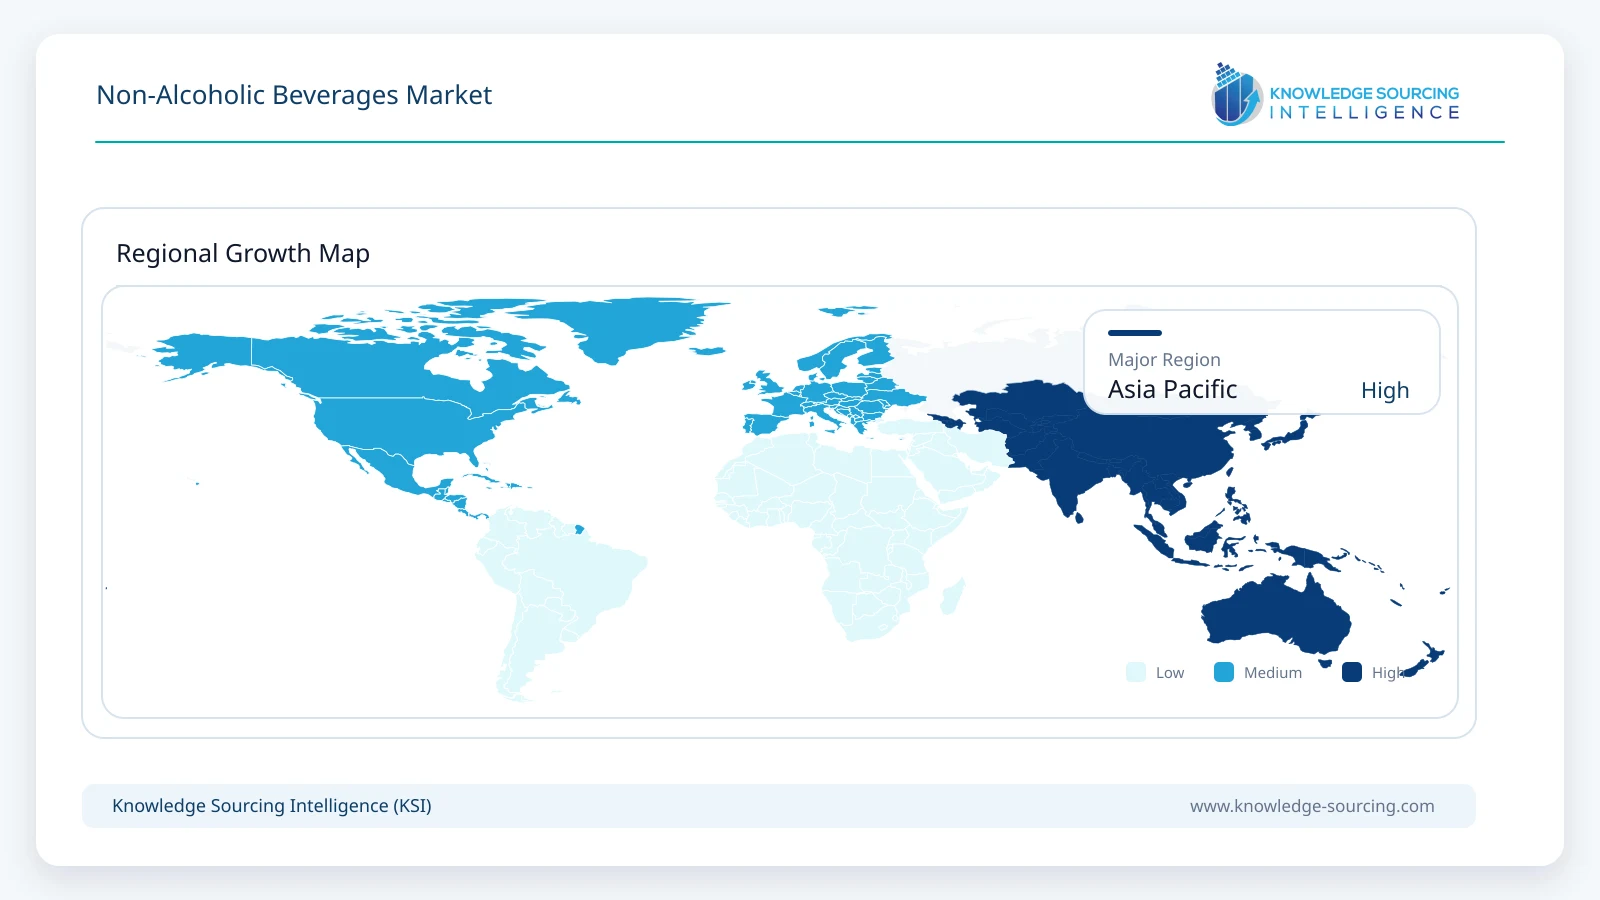
Asia-Pacific
Asia-Pacific is the fastest-growing region, fueled by rising discretionary income and urbanization in countries like China, India, and Indonesia. Demand in this region is increasingly focused on RTD teas and functional beverages that incorporate traditional ingredients like ginger, ginseng, and turmeric. The infrastructure in the region is expanding rapidly, with major global players establishing new bottling plants to serve localized tastes. Competitive dynamics are intense, as domestic brands like Nongfu Spring and Tata Consumer Products compete directly with global giants by leveraging deep local distribution networks and culturally relevant flavor profiles.
Europe
The European market is the global leader in sustainability and regulatory-driven innovation. Stringent health and environmental policies, leading to a high market share for organic and low-processed juices, shape this demand. The industrial base is focused on high-efficiency, low-carbon production processes. Infrastructure is well-developed, with a strong emphasis on "paper-based" packaging alternatives and glass-refill systems. The competitive landscape is characterized by high premiumization, where brands compete on quality, ethical sourcing, and environmental credentials rather than price alone.
List of Companies
The Coca-Cola Company
PepsiCo, Inc.
Nestlé S.A.
Suntory Holdings Limited
Keurig Dr Pepper Inc.
Danone S.A.
Red Bull GmbH
Monster Beverage Corporation
Asahi Group Holdings, Ltd.
Nongfu Spring Co., Ltd.
Britvic plc
Tata Consumer Products Limited
The Coca-Cola Company
The Coca-Cola Company maintains a dominant global market position through its "Total Beverage Company" strategy, which seeks to provide a beverage for every occasion. Its competitive advantage lies in its peerless global distribution network and a massive portfolio of over 200 brands, ranging from CSDs to hydration and nutrition categories. The company's technology differentiation is evident in its "Freestyle" fountain machines, which utilize micro-dosing technology to offer over 100 flavor combinations while generating real-time consumer preference data.
PepsiCo, Inc.
PepsiCo, Inc. utilizes a highly integrated model that combines its beverage business with a massive global snacks portfolio, allowing for "power of one" retail partnerships. Its strategy is heavily focused on the "PepsiCo Positive" (pep+) initiative, which targets 100% recyclable, compostable, or reusable packaging by 2025. PepsiCo’s geographic strength is particularly notable in North America and emerging markets where its diverse product range, including Gatorade, Tropicana, and SodaStream, allows it to capture diverse consumer segments across all price points.
Nestlé S.A.
Nestlé S.A. is a global leader in the bottled water and RTD coffee segments, with a strategy centered on "Health and Wellness." Its competitive advantage is rooted in its extensive R&D capabilities, which it uses to develop functional beverages with proven nutritional benefits. Nestlé’s technology differentiation includes its "Nescafé" and "Nespresso" platforms, which have revolutionized the home and office beverage consumption experience. The company’s geographic strength is globally distributed, with a dominant presence in both developed European markets and high-growth Asian economies.
Analyst View
The non-alcoholic beverages market is undergoing a structural transition toward functional hydration and circular packaging models. Growth is increasingly decoupled from traditional caloric intake, driven by aggressive regulation and health-conscious consumption. Brands prioritizing supply chain circularity and ingredient transparency are positioned to lead the 2031 outlook.
Non-Alcoholic Beverages Market Scope:
| Report Metric | Details |
|---|---|
| Total Market Size in 2026 | USD 1.2 trillion |
| Total Market Size in 2031 | USD 1.5 trillion |
| Forecast Unit | Trillion |
| Growth Rate | 4.6% |
| Study Period | 2021 to 2031 |
| Historical Data | 2021 to 2024 |
| Base Year | 2025 |
| Forecast Period | 2026 – 2031 |
| Segmentation | Product Type, Packaging, Distribution Channel, Geography |
| Geographical Segmentation | North America, South America, Europe, Middle East and Africa, Asia Pacific |
| Companies |
|
Market Segmentation
By Product Type
By Packaging
By Distribution Channel
By Flavor
By Geography
Table of Contents
1. EXECUTIVE SUMMARY
2. MARKET SNAPSHOT
2.1. Market Overview
2.2. Market Definition
2.3. Scope of the Study
2.4. Market Segmentation
3. BUSINESS LANDSCAPE
3.1. Market Drivers
3.2. Market Restraints
3.3. Market Opportunities
3.4. Porter’s Five Forces Analysis
3.5. Industry Value Chain Analysis
3.6. Policies and Regulations
3.7. Strategic Recommendations
4. TECHNOLOGICAL OUTLOOK
5. NON-ALCOHOLIC BEVERAGES MARKET BY PRODUCT TYPE
5.1. Introduction
5.2. Carbonated Soft Drinks (CSD)
5.3. Bottled Water
5.4. Ready-to-Drink (RTD) Tea & Coffee
5.5. Fruit Juices & Vegetable Juices
5.6. Functional Beverages
5.7. Energy Drinks
5.8. Sports Drinks
5.9. Dairy-based Beverages
6. NON-ALCOHOLIC BEVERAGES MARKET BY PACKAGING
6.1. Introduction
6.2. PET Bottles
6.3. Glass Bottles
6.4. Aluminum Cans
6.5. Cartons
6.6. Others
7. NON-ALCOHOLIC BEVERAGES MARKET BY DISTRIBUTION CHANNEL
7.1. Introduction
7.2. Supermarkets/Hypermarkets
7.3. Convenience Stores
7.4. Online Retail
7.5. Food Service Sector
8. NON-ALCOHOLIC BEVERAGES MARKET BY FLAVOR
8.1. Introduction
8.2. Cola
8.3. Citrus
8.4. Fruit
8.5. Others
9. NON-ALCOHOLIC BEVERAGES MARKET BY GEOGRAPHY
9.1. Introduction
9.2. North America
9.2.1. By Product Type
9.2.2. By Packaging
9.2.3. By Distribution Channel
9.2.4. By Flavor
9.2.5. By Country
9.2.5.1. United States
9.2.5.2. Canada
9.2.5.3. Mexico
9.3. South America
9.3.1. By Product Type
9.3.2. By Packaging
9.3.3. By Distribution Channel
9.3.4. By Flavor
9.3.5. By Country
9.3.5.1. Brazil
9.3.5.2. Argentina
9.3.5.3. Others
9.4. Europe
9.4.1. By Product Type
9.4.2. By Packaging
9.4.3. By Distribution Channel
9.4.4. By Flavor
9.4.5. By Country
9.4.5.1. UK
9.4.5.2. Germany
9.4.5.3. France
9.4.5.4. Spain
9.4.5.5. Italy
9.4.5.6. Others
9.5. Middle East and Africa
9.5.1. By Product Type
9.5.2. By Packaging
9.5.3. By Distribution Channel
9.5.4. By Flavor
9.5.5. By Country
9.5.5.1. Saudi Arabia
9.5.5.2. UAE
9.5.5.3. South Africa
9.5.5.4. Others
9.6. Asia Pacific
9.6.1. By Product Type
9.6.2. By Packaging
9.6.3. By Distribution Channel
9.6.4. By Flavor
9.6.5. By Country
9.6.5.1. China
9.6.5.2. Japan
9.6.5.3. India
9.6.5.4. South Korea
9.6.5.5. Australia
9.6.5.6. Others
10. COMPETITIVE ENVIRONMENT AND ANALYSIS
10.1. Major Players and Strategy Analysis
10.2. Market Share Analysis
10.3. Mergers, Acquisitions, Agreements, and Collaborations
10.4. Competitive Dashboard
11. COMPANY PROFILES
11.1. The Coca-Cola Company
11.2. PepsiCo, Inc.
11.3. Nestlé S.A.
11.4. Suntory Holdings Limited
11.5. Keurig Dr Pepper Inc.
11.6. Danone S.A.
11.7. Red Bull GmbH
11.8. Monster Beverage Corporation
11.9. Asahi Group Holdings, Ltd.
11.10. Nongfu Spring Co., Ltd.
11.11. Britvic plc
11.12. Parle Agro Pvt. Ltd.
11.13. Tata Consumer Products Limited
11.14. Ocean Spray Cranberries, Inc.
11.15. The Kraft Heinz Company
11.16. Unilever plc
12. RESEARCH METHODOLOGY
List of Figures
List of Tables
Research Methodology
This report has been prepared using Knowledge Sourcing Intelligence's (KSI's) market research framework. The research process defines the market boundary, analyzes demand and supply, maps offerings of key participants, and evaluates relevant trends over the study period.
For the Non-Alcoholic Beverages Market, the research process considered population expansion, urbanization, disposable income, household expenditure, foodservice sector activity, and changing beverage consumption patterns. The analysis also considers consumer demand for low-sugar, functional, natural, fortified, convenient, and ready-to-drink products. Product innovation across carbonated soft drinks, bottled water, fruit and vegetable juices, energy drinks, sports drinks, dairy beverages, plant-based beverages, and ready-to-drink tea and coffee was also assessed to identify the demand for non-alcoholic beverages across key countries and regions.
Supply-side assessment considers beverage manufacturing and bottling capacity, ingredient sourcing, distribution networks, cold-chain infrastructure, retail availability, foodservice channels, and e-commerce activity. The analysis also reviews the availability and pricing of sugar, fruits, milk, tea, coffee, sweeteners, flavours, functional ingredients, plastics, cartons, and other packaging materials. The competitive strategies of multinational beverage companies, regional manufacturers, bottlers, contract producers, ingredient suppliers, distributors, and emerging functional beverage brands were also reviewed.
The market has been segmentd by product type, packaging, flavour, distribution channel, and geography. Regional and country-level analysis was developed using household consumption indicators, retail beverage sales, foodservice sector activity, demographic data, import-export statistics, and beverage manufacturing indicators. Government and regulatory publications, investor presentations, company disclosures, product launches, and other credible secondary sources were also reviewed. KSI also undertakes primary inputs and expert discussions to map them to internal estimation models.
Public source categories reviewed for this study include non-alcoholic beverage industry publications, household consumption statistics, foodservice indicators, agricultural output data, ingredient and packaging trade data, food safety regulations, labelling requirements, SEC filings, and industry association data. Examples of broader sources considered include the International Council of Beverages Associations, International Fruit and Vegetable Juice Association, International Bottled Water Association, UNESDA Soft Drinks Europe, FoodDrinkEurope, and the Food and Agriculture Organization. National statistics agencies, customs and trade databases, food and beverage associations, investor presentations, and press releases were also considered.
Market estimates were reviewed through bottom-up and top-down modelling. Bottom-up validation considered company participation, product portfolios, manufacturing and bottling capacity, sales volume, foodservice distribution, pricing indicators, packaging formats, and regional sales exposure. Top-down validation considers population, household consumption, disposable income, retail and foodservice activity, non-alcoholic beverage consumption patterns, tourism, and demand from hospitality sector. Other relevant macroeconomic and consumer demand parameters were also assessed.
For more information on the broader research process, please visit our Research Methodology page.
Navigate
Trusted by the world's leading organizations


