
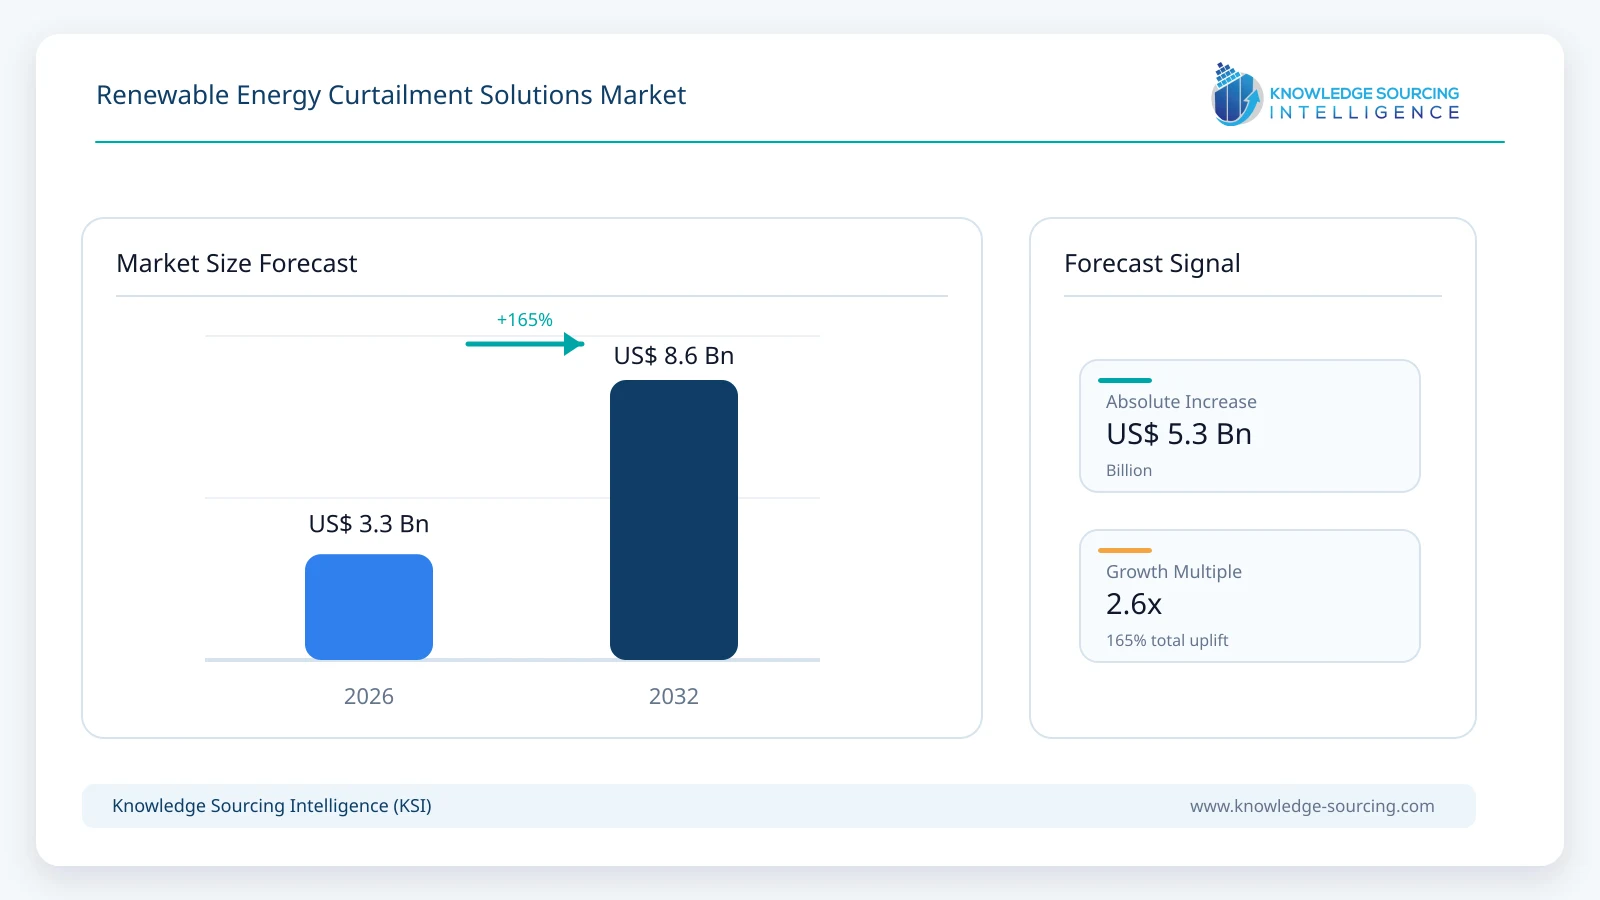
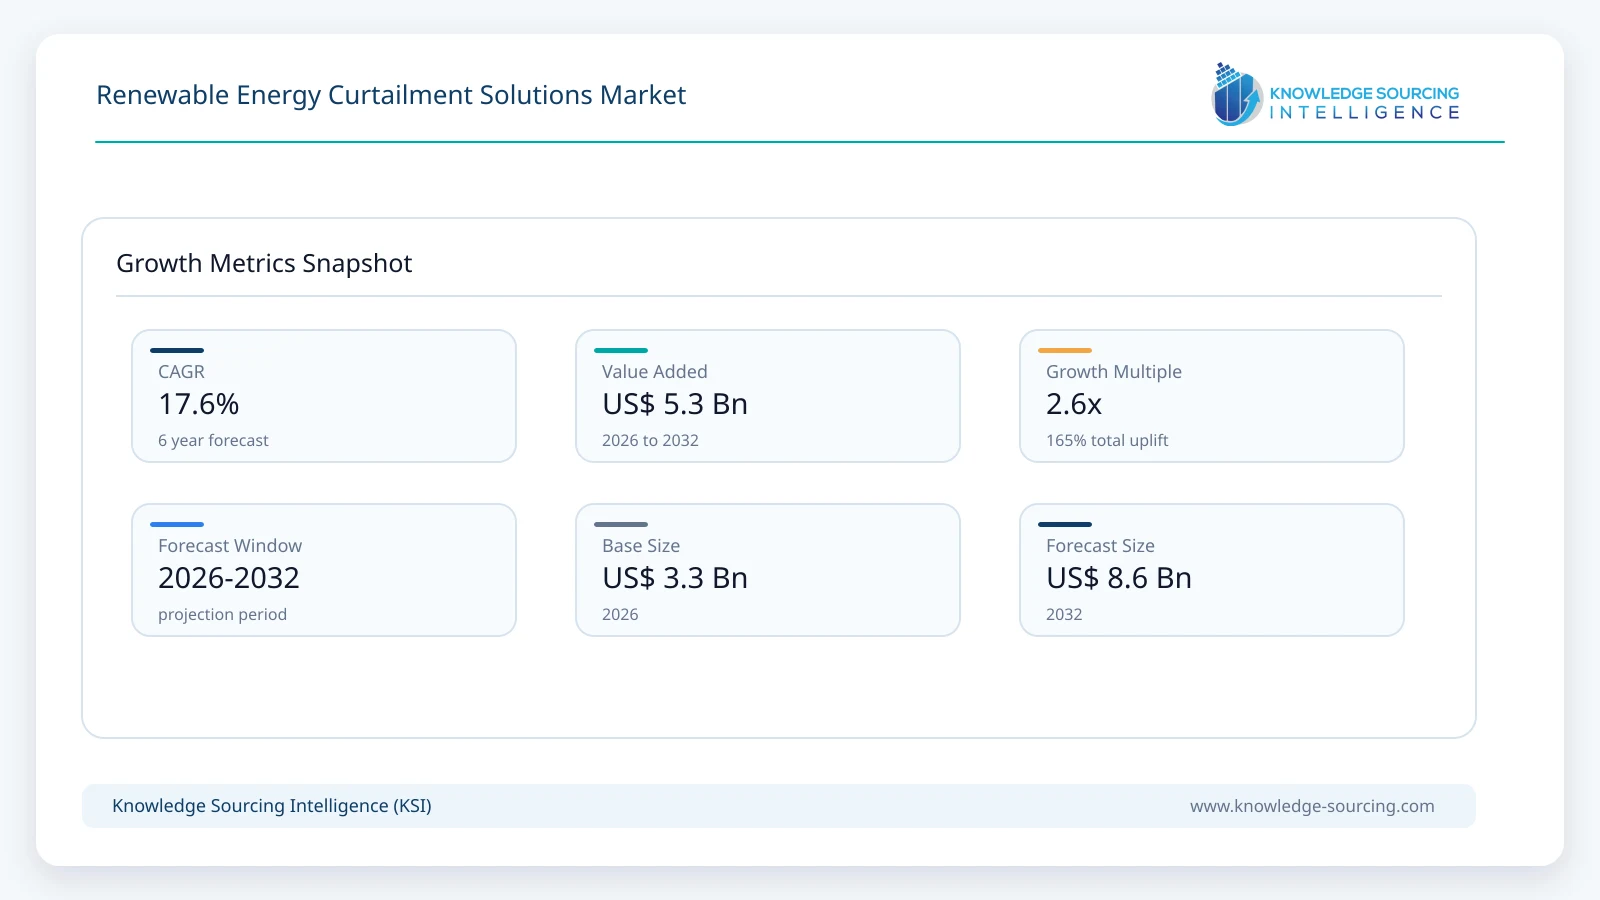
The Renewable Energy Curtailment Solutions Market is estimated at USD 3.25 billion in 2026 and is projected to reach USD 8.60 billion by 2032, representing a compound annual growth rate (CAGR) of 17.6% Throughout 2026-2032.
Highlights:
- 1Grid-enhancing technologies account for approximately 41% of 2026 market revenue.
- 2Dynamic line rating unlocks real-time transmission capacity without waiting for full line rebuilds.
- 3Advanced power-flow control redirects electricity away from constrained circuits toward available capacity.
- 4Hybrid energy management software increasingly stores or redirects renewable output that would otherwise be curtailed.
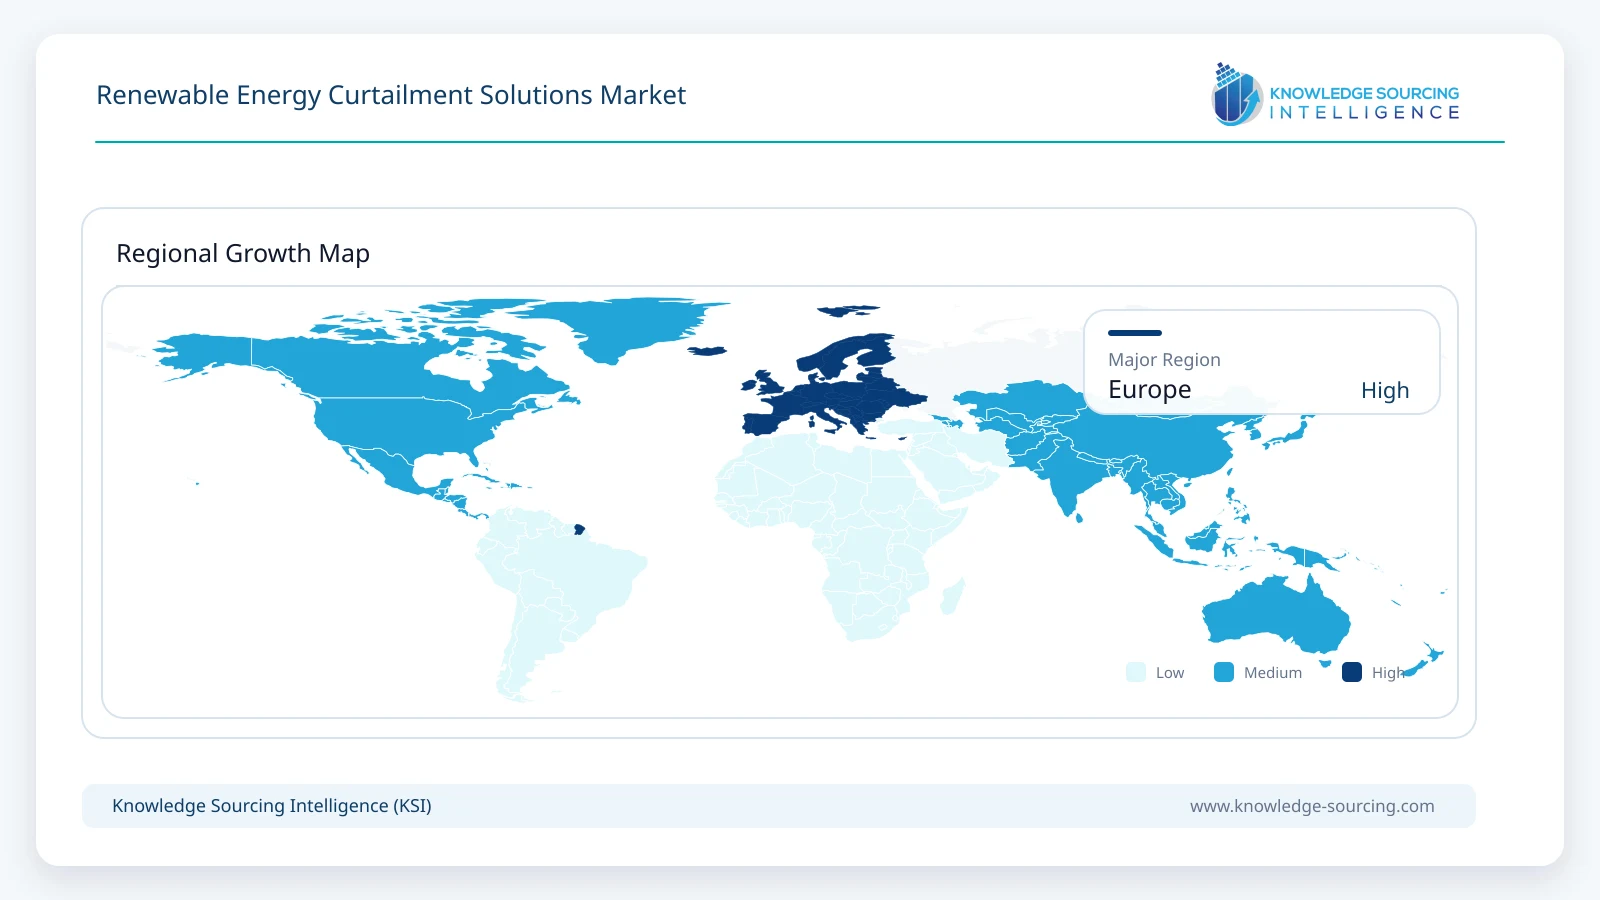
- 5Europe and North America lead adoption because congestion costs and connection queues are already economically material.
Curtailment solutions operate at several layers of the power system. At the transmission layer, dynamic line rating (DLR) replaces conservative static assumptions with real-time or forecasted conductor capacity based on weather and operating conditions. Advanced power-flow control (APFC) devices actively redirect power from overloaded lines to underused parallel paths. Grid analytics and digital twins identify bottlenecks, evaluate switching states and help operators determine where curtailment can be reduced without violating reliability limits.
At generation and distribution level, energy management systems coordinate renewable output, battery state of charge and plant dispatch. Distributed energy resource management systems (DERMS) and virtual power plant platforms aggregate flexible demand, storage and distributed generation so load can be increased or shifted when surplus renewable electricity is available. These solutions do not eliminate the need for new transmission, but they can reduce near-term congestion, defer reinforcement and improve utilisation of infrastructure already in service.
The economic case is strengthening because congestion and curtailment costs are rising faster than many grid operators can expand physical infrastructure. The European Union recorded EUR 4.3 billion of congestion-management expenditure in 2024, according to the Agency for the Cooperation of Energy Regulators. The United States Department of Energy also identifies DLR, power-flow control and analytical tools as technologies that can increase renewable integration by extracting additional capability from existing lines.
Market Drivers
Transmission expansion is slower than renewable and load growth
New transmission lines commonly require years of planning, permitting, procurement and construction. Renewable projects and new electricity loads can be developed much faster, creating a persistent timing mismatch. The International Energy Agency notes that grid projects can require roughly 5-15 years while many renewable projects can be developed in 1-5 years. Curtailment solutions gain value during this gap because they can increase usable capacity or flexibility before major grid reinforcement is completed.
Congestion costs make curtailment reduction financially measurable
Curtailment is no longer only a technical integration issue. It creates lost revenue for generators, balancing costs for system operators and higher consumer costs when cheaper renewable output is replaced by more expensive generation. National Grid and LineVision have deployed DLR to reduce renewable curtailment in New York, while Smart Wires has demonstrated power-flow control that can reduce wind curtailment by relieving constrained paths. These projects provide a direct commercial link between grid optimisation and avoided constraint cost.
Storage and flexible demand are becoming controllable grid resources
Storage, industrial loads and distributed assets increasingly participate in wholesale and flexibility markets. Platforms such as Wärtsilä GEMS and GridBeyond coordinate asset operation using forecasts, grid conditions and market signals. This allows surplus renewable electricity to be absorbed or shifted rather than simply curtailed. As the number of flexible assets increases, software becomes an increasingly important part of curtailment management.
Regulation increasingly requires consideration of grid-enhancing technologies
Policy is moving toward faster use of existing transmission. In the United States, Federal Energy Regulatory Commission Order 1920 requires transmission planners to consider alternatives including dynamic line ratings and advanced power-flow control. Similar pressure is visible in Europe, where grid congestion and renewable dispatch-down are driving investment in digital grid operation, flexibility and network reinforcement.
Restraints and Adoption Challenges
Curtailment is site-specific, which limits one-size-fits-all deployment. Dynamic line rating provides the most benefit where weather conditions create additional conductor cooling and where the monitored line is genuinely the binding constraint. Power-flow control only creates value when parallel paths have spare capacity. Software platforms require access to operational data, telemetry and dispatch authority. In some systems the bottleneck is a transformer, stability limit or downstream distribution constraint that cannot be solved by a single technology.
Utility procurement cycles, cybersecurity requirements, interoperability and regulatory cost recovery can also slow adoption. Grid operators require high confidence that new operational limits do not reduce reliability. Storage and demand-response solutions face additional constraints from market rules, state-of-charge limits, customer operating requirements and battery degradation. These factors mean curtailment solutions are generally deployed as part of a portfolio rather than as substitutes for long-term grid expansion.
Renewable Energy Curtailment Solutions MarketSegment Analysis
By Solution Type
Grid-enhancing technologies are the largest category in 2026. Their approximately 41% share corresponds to about USD 1.33 billion of market revenue. Dynamic line rating, advanced power-flow control and supporting analytics can be deployed faster than large transmission projects and address the physical bottlenecks that often trigger renewable dispatch-down. Commercial evidence from LineVision, Heimdall Power and Smart Wires shows that these technologies are moving beyond pilots into utility programmes and operational deployments.
Energy management and hybrid-control platforms represent the fastest-developing software category. Their role expands as batteries, renewable plants, flexible industrial loads and virtual power plants are dispatched together. The value proposition is broader than simple curtailment avoidance: the same platform can optimise market bidding, ancillary services, congestion response and asset lifetime. This supports recurring software and service revenue in addition to project integration.
Solution Type | Primary Function | Typical Buyer | Curtailment Mechanism |
Dynamic line rating | Calculates real-time or forecast line capacity. | Transmission and distribution utilities | Raises usable capacity when operating conditions permit. |
Advanced power-flow control | Redirects power among parallel transmission paths. | Transmission system operators and utilities | Relieves overloaded corridors and unlocks transfer headroom. |
Grid analytics / digital twins | Models constraints, switching states and hosting capacity. | Utilities and grid operators | Identifies alternatives to renewable dispatch-down. |
Hybrid plant energy management | Coordinates renewables, storage and plant controls. | Renewable developers and asset owners | Stores or reschedules energy that would otherwise be curtailed. |
DERMS / flexibility orchestration | Aggregates flexible demand and distributed resources. | Utilities, aggregators and large energy users | Moves demand into periods of renewable surplus. |
Market and Deployment Indicators
Indicator | Latest Development | Market Impact |
EU congestion and curtailment | EU TSOs spent EUR 4.3 billion on congestion management in 2024; over 10 TWh of renewable electricity was curtailed due to grid congestion. | Creates measurable economic value for solutions that release capacity or shift energy. |
Global grid queues | IEA reports more than 2,500 GW of renewable, storage and large-load projects stalled in grid queues. | Supports faster-deployment grid optimisation technologies. |
National Grid / LineVision | DLR deployment in New York was designed to reduce up to 350 MW of renewable curtailment while increasing capacity. | Shows direct curtailment-reduction use case for DLR. |
Heimdall Power 2026 deployments | Projects announced with Entergy, Statnett, National Grid UK, Vattenfall and Energa-Operator. | Confirms growing commercial utility adoption of DLR. |
Wärtsilä GEMS | Renewables+ and Colbun references explicitly target curtailed or constrained solar energy. | Demonstrates software-plus-storage route to curtailment management. |
Regional Opportunity
Europe
Europe represents one of the largest and most immediate opportunities because high renewable penetration is colliding with transmission constraints across multiple markets. ACER reported EUR 4.3 billion of remedial-action expenditure in the European Union during 2024, while more than 10 TWh of renewable electricity was curtailed due to grid congestion.
The United Kingdom also experiences recurring wind constraints, particularly where northern generation must be transferred to southern demand centres.
This environment supports several solution classes simultaneously. Heimdall Power has won DLR work with National Grid UK, Statnett and other European utilities. Smart Wires has deployed advanced power-flow control in the United Kingdom and across continental Europe. GridBeyond provides demand and storage flexibility, while envelio supplies digital-twin and grid-management software used by E.ON distribution networks. Hitachi Energy and Wärtsilä provide grid, storage and digital platforms that address connection bottlenecks, hybrid operation and curtailment. Adoption is therefore being driven by both transmission-level congestion and distribution-level renewable integration.
Competitive Landscape
The competitive landscape spans specialist grid-enhancing technology vendors, major grid-software providers and energy flexibility platforms. LineVision and Heimdall Power focus on dynamic line rating and transmission monitoring. Smart Wires competes in modular advanced power-flow control. GE Vernova combines transmission software, distributed dynamic line rating and energy-management capabilities, while Hitachi Energy combines grid connection, digital and storage solutions. Wärtsilä and Fluence participate through energy storage control and optimisation, while GridBeyond focuses on distributed flexibility and market optimisation. envelio provides grid digital-twin and flexibility-management software.
The companies are not interchangeable. A utility seeking additional physical transfer capability may compare DLR, power-flow control and conventional reinforcement, while a renewable developer facing plant-level clipping may prioritise energy management and storage controls. The strongest vendors increasingly integrate operational data, analytics and automated control rather than selling isolated monitoring products.
Key Market Participant | Current Curtailment-Relevant Offering |
LineVision | LineRate DLR, NexusIQ grid intelligence and transmission monitoring. |
Heimdall Power | Neuron sensors and DLR software. |
Smart Wires | SmartValve advanced power-flow control. |
GE Vernova | GridOS DDLR, energy-management and grid-firming digital solutions. |
Wärtsilä Corporation | GEMS Digital Energy Platform and Renewables+ controls. |
Fluence Energy, Inc. | Energy storage optimisation software and grid-scale storage controls. |
GridBeyond | DERMS, VPP, demand response and storage optimisation. |
envelio GmbH (E.ON majority-owned) | Intelligent Grid Platform, digital twin and grid-side flexibility management. |
Hitachi Energy Ltd. | Grid, storage and digital solutions for connection and curtailment reduction. |
Recent Developments
September 2026: Heimdall Power announced a Dynamic Line Rating agreement with Energa-Operator in Poland following additional 2026 utility wins.
August 2026: Fluence and LEAG Clean Power began deployment of a 400 MWh storage project co-located with wind and solar in Germany to reduce grid pressure and support renewable integration.
June 2026: Smart Wires published new utility case studies covering PG&E, Georgia Power and VELCO deployments of advanced power-flow control.
June 2026: GE Vernova highlighted distributed dynamic line rating integrated with energy-management systems to unlock transmission capacity and reduce congestion and renewable curtailment.
April 2026: Heimdall Power was selected for a National Grid UK DLR framework intended to reduce constraint costs and increase usable network capacity.
January 2026: LineVision launched its integrated grid-intelligence solution combining network-wide DLR, situational awareness and the NexusIQ portal.
Renewable Energy Curtailment Solutions Market Scope:
| Report Metric | Details |
|---|---|
| Total Market Size in 2026 | USD 3.25 billion |
| Total Market Size in 2032 | USD 8.60 billion |
| Forecast Unit | USD Billion |
| Growth Rate | 17.6% |
| Study Period | 2021 to 2032 |
| Historical Data | 2021 to 2024 |
| Base Year | 2025 |
| Forecast Period | 2026 – 2032 |
| Segmentation | Solution Type, Curtailment Cause, End User, Geography |
| Companies |
|
Market Segmentation
By Solution Type
Dynamic Line Rating
Advanced Power-Flow Control
Grid Analytics and Digital Twins
Hybrid Plant Energy Management Systems
DERMS and Flexibility Orchestration
By Curtailment Cause
Transmission Congestion
Distribution Network Constraints
Supply-Demand Imbalance
Stability and Operating Limits
Renewable Plant Clipping and Export Limits
By End User
Transmission System Operators
Distribution Utilities
Renewable Energy Developers and IPPs
Storage Asset Owners and Aggregators
Commercial and Industrial Flexible Loads
By Geography
Europe
United Kingdom
Germany
Nordics
Rest of Europe
North America
Asia Pacific
Latin America
Middle East and Africa
Table of Contents
1. EXECUTIVE SUMMARY
1.1. Market Opportunity and Key Findings
1.2. Curtailment and Congestion Outlook
2. MARKET OVERVIEW
2.1. Renewable Energy Curtailment Fundamentals
2.2. Transmission Congestion and Grid Constraints
2.3. Curtailment Reduction Technology Stack
3. MARKET SIZE AND FORECAST, 2026-2032
3.1. Global Market Revenue
3.2. Annual Growth Analysis
3.3. Hardware, Software and Service Revenue
4. MARKET BY SOLUTION TYPE
4.1. Dynamic Line Rating
4.2. Advanced Power-Flow Control
4.3. Grid Analytics and Digital Twins
4.4. Hybrid Plant Energy Management Systems
4.5. DERMS and Flexibility Orchestration
5. MARKET BY CURTAILMENT CAUSE
5.1. Transmission Congestion
5.2. Distribution Network Constraints
5.3. Supply-Demand Imbalance
5.4. Stability and Operating Limits
5.5. Renewable Plant Clipping and Export Limits
6. MARKET BY END USER
6.1. Transmission System Operators
6.2. Distribution Utilities
6.3. Renewable Energy Developers and IPPs
6.4. Storage Asset Owners and Aggregators
6.5. Commercial and Industrial Flexible Loads
7. REGIONAL MARKET
7.1. Europe
7.1.1. United Kingdom
7.1.2. Germany
7.1.3. Nordics
7.1.4. Rest of Europe
7.2. North America
7.3. Asia Pacific
7.4. Latin America
7.5. Middle East and Africa
8. MARKET DYNAMICS
8.1. Drivers
8.1.1. Rising Renewable Curtailment
8.1.2. Transmission Development Delays
8.1.3. Growth of Grid-Enhancing Technologies
8.1.4. Storage and Demand Flexibility
8.2. Restraints
8.2.1. Site-Specific Constraint Economics
8.2.2. Utility Procurement and Regulatory Approval
8.2.3. Cybersecurity and Data Integration
8.2.4. Limits of Operational Solutions Without Physical Grid Expansion
9. COMPETITIVE LANDSCAPE
9.1. Dynamic Line Rating Suppliers
9.2. Power-Flow Control Suppliers
9.3. Grid Software and Digital-Twin Platforms
9.4. Energy Management and Flexibility Platforms
10. COMPANY PROFILES
10.1. LineVision, Inc.
10.2. Heimdall Power AS
10.3. Smart Wires, Inc.
10.4. GE Vernova Inc.
10.5. Wärtsilä Corporation
10.6. Fluence Energy, Inc.
10.7. GridBeyond Limited
10.8. envelio GmbH
10.9. Hitachi Energy Ltd.
11. RECENT DEVELOPMENTS
12. APPENDIX
Navigate
Trusted by the world's leading organizations











