Report Overview
Bus Market Size:
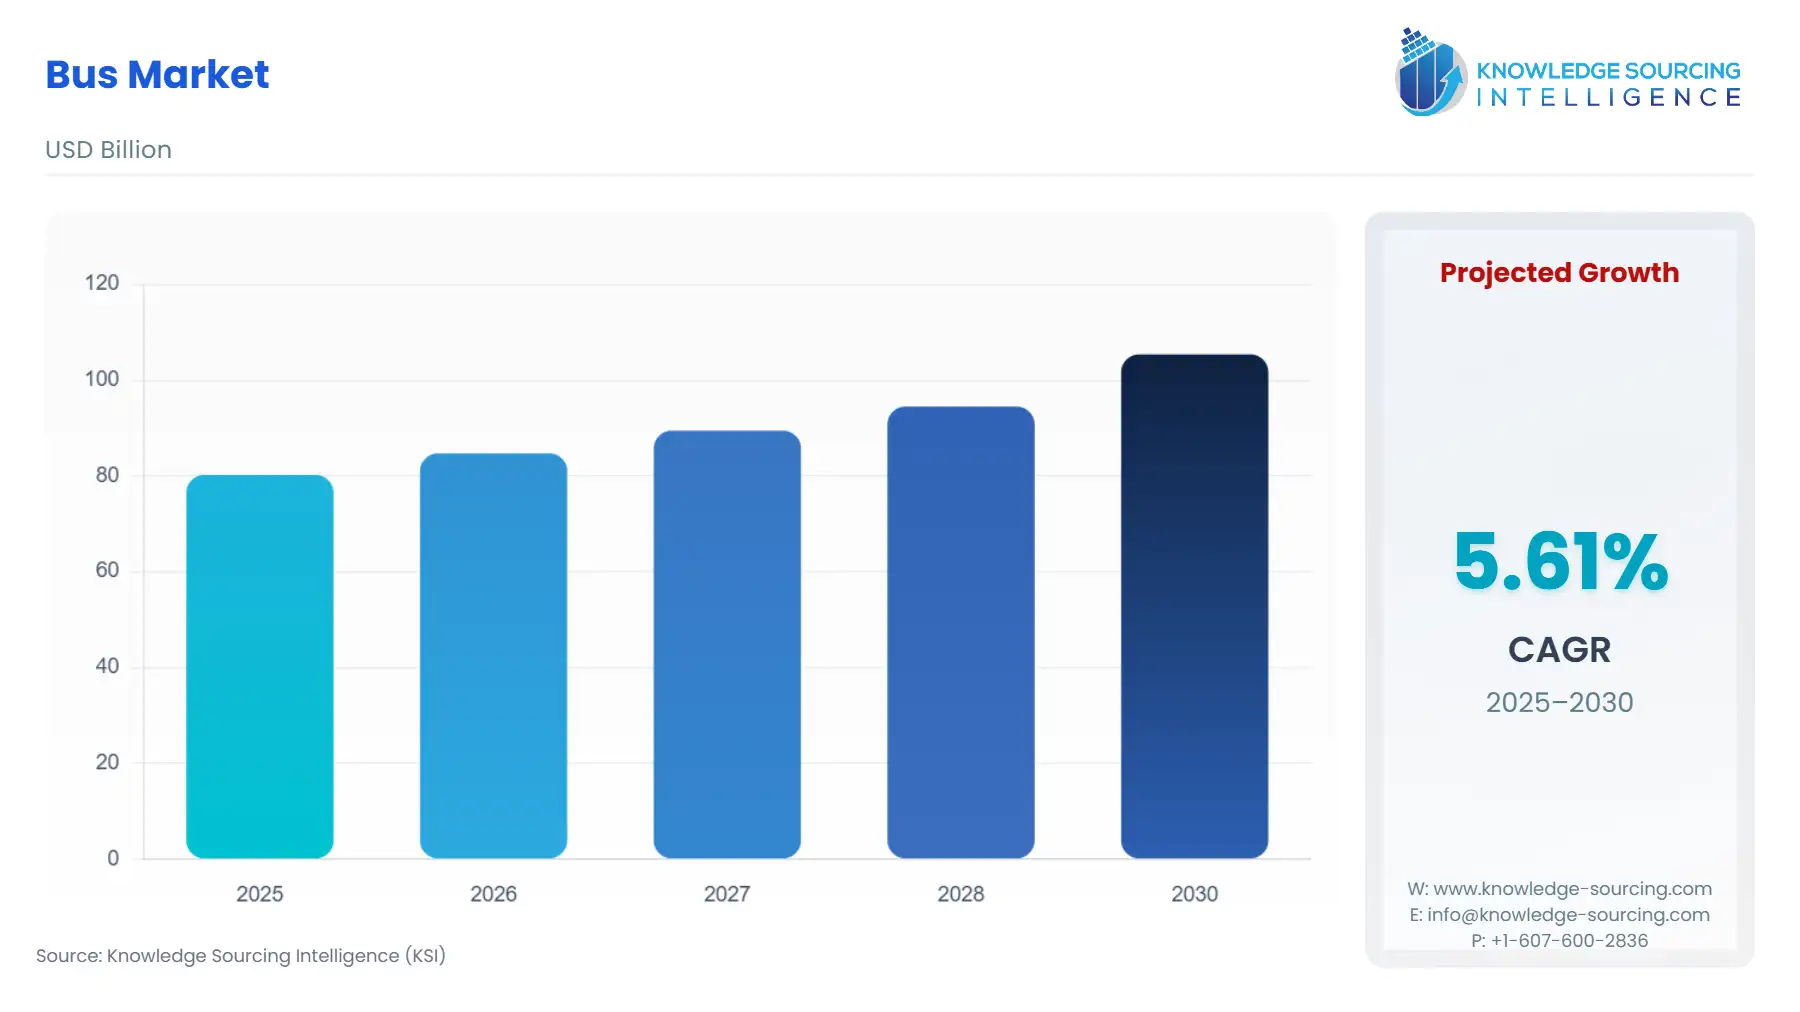
The Bus Market is set to climb from USD 80.213 billion in 2025 to USD 105.383 billion in 2030, at a CAGR of 5.61%.
Highlights:
- 1Increasing urban populationis driving demand for buses in global public transport.
- 2Growing government investmentsare boosting bus infrastructure in developing countries.
- 3Asia Pacificis leading the market with a high reliance on public transportation.
- 4Advancing electric bus adoptionis enhancing sustainability in urban mobility solutions.
The global bus industry, a vital segment of the public transport market, drives innovation in the commercial vehicle market. This market focuses on passenger transport solutions and addresses the increasing demand for efficient urban mobility. Buses, ranging from city transit to intercity coaches, support sustainable and accessible transportation systems. Advanced technologies, including electric and hybrid propulsion, enhance environmental performance and operational efficiency. As urbanization intensifies, the market delivers scalable, cost-effective solutions for mass transit. Market players recognize its critical role in reducing congestion and emissions, shaping the future of sustainable, connected transportation in urban and regional landscapes.
The global bus market is expected to grow due to the rapid increase in the urban population worldwide, especially in underdeveloped and developing countries, which is prompting an increased need for transportation, and hence a larger number of buses. Also, various developing countries, like China and India, among many others, have been making large investments in their public transport and buses, which is further anticipated to drive the growth of the global buses market during the forecast period. For instance, in February 2021, the Indian government, while presenting the Union Budget 2021-22, announced an Rs 18,000 crore scheme to augment public transport in urban areas. The government stated that it would work towards raising the share of public transport in urban areas through the augmentation of the city bus service.
Bus Market Trends:
The global bus market is advancing with bus electrification, driving decarbonization of public transport to meet sustainability goals. Urbanization's impact on the bus market fuels demand for sustainable public transport, with bus rapid transit (BRT) systems optimizing urban mobility. Mobility-as-a-service (MaaS) bus integrates seamless, on-demand transit solutions. Passenger comfort features, like ergonomic seating and Wi-Fi, enhance the user experience, while safety features in the bus, including ADAS and collision avoidance, improve reliability. Innovations in electric and hydrogen-powered buses reduce emissions, aligning with environmental regulations. These trends are reshaping public transport for efficient, eco-friendly, and passenger-centric urban solutions.
Bus Market Growth Driver:
- RISE IN URBAN POPULATION
The rise in population worldwide, especially in urban areas, has led to an increase in the need for transportation, which is one of the prominent factors anticipated to propel the growth of the global bus market during the forecast period. According to data from the World Bank, the worldwide urban population in 2014 accounted for 3.877 billion in 2014 which rose to 4.274 billion in 2019. In 2010, 50.65% of the world's population lived in urban areas and the share has increased to 55.72% in 2019. The population growth trend is expected to continue in the future and is expected to increase to 68% by 2050, as estimated by the “2018 Revision of World Urbanization Prospects” by the United Nations. The projections show that urbanization, the gradual shift in residence of the human population from rural to urban areas, combined with the overall growth of the world’s population, could add another 2.5 billion people to urban areas by 2050, with close to 90% of this increase taking place in Asia and Africa. By 2030, the world is projected to have 43 megacities with more than 10 million inhabitants, most of them in developing regions.
This growth in urban population puts the transportation system of the concerned region under great stress, as the demand for transportation increases. According to the UN, by 2050, it is projected that India will have added 416 million urban dwellers and China 255 million. The rapid rise in population is more prevalent in underdeveloped and developing countries, especially in Asia and Africa, which increases the need for enhanced transportation in these countries. Thus, with an increasingly urban population leading to an increased need for transportation, the increase in population is anticipated to propel the growth of the global bus market during the forecast period.
Bus Market Segmentation Analysis:
- Electric Bus Market to Grow at the Highest CAGR
By type, the global bus market is segmented into diesel, electric, and others. The diesel segment is expected to hold the major market share during the forecast period, whereas the electric segment is estimated to grow significantly between 2019 and 2026. The growth of the diesel segment is mainly attributed to the conventions attached to diesel buses and the reluctance to adopt them by local agencies in developing countries.
Moreover, the high cost and investment attached to the electric buses incentivize small local agencies to stick to diesel buses. However, the electric segment is expected to grow at a fast rate owing to the regulations imposed in both developing and developed countries, along with the grants given by the governments. Technical factors like battery optimization also play a role in the demand for electric buses. Compressed natural gas, gasoline, and hybrid fuels are studied under the other segment.
- Transit Bus Holds a Significant Share
By application, the global bus market is segmented into school buses, transit buses, and others. The market growth can be majorly attributed to the growing need for means of transportation and the rising population in urban areas. Booming urbanization and industrialization are major factors driving the demand in the global bus market. Growing environmental concerns and stringent emission regulations have encouraged countries to adopt electric buses for day-to-day purposes.
Besides, growth in the bus market at a world level is majorly driven by growing demand in emerging economies where tourism and public transportation industries are expected to expand at an exponential rate, supported by favouring government incentives and policies. According to the Bureau of Transportation Statistics report 2020, a total of 884,398 interstate buses ply locally in the US. As compared to other modes of transport, school buses are built with higher safety standards, protective seating, and rollover protection. Whereas the transit buses are specially designed for local commuting and facilitate public transport service for the general public.
Bus Market Geographical Outlook:
- Asia Pacific is the Largest Market
Based on geography, the global bus market is segmented into North America, South America, Europe, the Middle East and Africa, and the Asia Pacific. The Asia Pacific region is anticipated to hold a significant share during the forecasted period. The region is dominated by low and middle-income households, most of which are unable to afford their private vehicle. Commuting by public transportation, therefore, is preferred by consumers. This drives the demand for public vehicles and hence the demand for buses.
List of Top Bus Companies:
- SML Isuzu Limited
- Force Motors Limited
- Mahindra and Mahindra
- Solaris Bus & Coach S.A.
- BYD Company Ltd.
Bus Market Scope:
| Report Metric | Details |
|---|---|
| Study Period | 2021 to 2031 |
| Historical Data | 2021 to 2024 |
| Base Year | 2025 |
| Forecast Period | 2026 – 2031 |
| Report Metric | Details |
| Bus Market Size in 2025 | USD 80.213 billion |
| Bus Market Size in 2030 | USD 105.383 billion |
| Growth Rate | CAGR of 5.61% |
| Study Period | 2020 to 2030 |
| Historical Data | 2020 to 2023 |
| Base Year | 2024 |
| Forecast Period | 2025 – 2030 |
| Forecast Unit (Value) | USD Billion |
| Segmentation |
|
| Geographical Segmentation | North America, South America, Europe, Middle East and Africa, Asia Pacific |
| List of Major Companies in Bus Market |
|
| Customization Scope | Free report customization with purchase |
Global Bus Market Segmentation:
- By Application
- School Bus
- Transit Bus
- Others
- By Fuel Type
- Diesel
- Electric
- Others
- By Seating Capacity
- 15-30
- 31-50
- More than 50
- By Geography
- North America
- USA
- Canada
- Mexico
- South America
- Brazil
- Argentina
- Others
- Europe
- Germany
- France
- United Kingdom
- Spain
- Others
- Middle East and Africa
- Saudi Arabia
- UAE
- Others
- Asia Pacific
- China
- India
- Japan
- South Korea
- Indonesia
- Thailand
- Others
- North America
Our Best-Performing Industry Reports:
Market Segmentation
By Application
By Fuel Type
By Seating Capacity
By Geography
Table of Contents
1. EXECUTIVE SUMMARY
2. MARKET SNAPSHOT
2.1. Market Overview
2.2. Market Definition
2.3. Scope of the Study
2.4. Market Segmentation
3. BUSINESS LANDSCAPE
3.1. Market Drivers
3.2. Market Restraints
3.3. Market Opportunities
3.4. Porter’s Five Forces Analysis
3.5. Industry Value Chain Analysis
3.6. Policies and Regulations
3.7. Strategic Recommendations
4. TECHNOLOGICAL OUTLOOK
5. GLOBAL BUS MARKET BY APPLICATION
5.1. Introduction
5.2. School Bus
5.3. Transit Bus
5.4. Others
6. GLOBAL BUS MARKET BY FUEL TYPE
6.1. Introduction
6.2. Diesel
6.3. Electric
6.4. Others
7. GLOBAL BUS MARKET BY SEATING CAPACITY
7.1. Introduction
7.2. 15-30
7.3. 31-50
7.4. More than 50
8. GLOBAL BUS MARKET BY GEOGRAPHY
8.1. Introduction
8.2. North America
8.2.1. USA
8.2.2. Canada
8.2.3. Mexico
8.3. South America
8.3.1. Brazil
8.3.2. Argentina
8.3.3. Others
8.4. Europe
8.4.1. Germany
8.4.2. France
8.4.3. United Kingdom
8.4.4. Spain
8.4.5. Others
8.5. Middle East and Africa
8.5.1. Saudi Arabia
8.5.2. UAE
8.5.3. Others
8.6. Asia Pacific
8.6.1. China
8.6.2. India
8.6.3. Japan
8.6.4. South Korea
8.6.5. Indonesia
8.6.6. Thailand
8.6.7. Others
9. COMPETITIVE ENVIRONMENT AND ANALYSIS
9.1. Major Players and Strategy Analysis
9.2. Market Share Analysis
9.3. Mergers, Acquisitions, Agreements, and Collaborations
9.4. Competitive Dashboard
10. COMPANY PROFILES
10.1. Anhui Ankai Automobile Co., Ltd
10.2. Yutong
10.3. Daimler AG
10.4. Volvo AB
10.5. Eicher
10.6. MAN
10.7. Scania
10.8. Tata Motors Limited
10.9. NFI Group Inc.
10.10. Hino Motors, Ltd.
10.11. SML Isuzu Limited
10.12. Force Motors Limited
10.13. Mahindra and Mahindra
10.14. Solaris Bus & Coach S.A.
10.15. BYD Company Ltd.
11. APPENDIX
11.1. Currency
11.2. Assumptions
11.3. Base and Forecast Years Timeline
11.4. Key benefits for the stakeholders
11.5. Research Methodology
11.6. Abbreviations
LIST OF FIGURES
LIST OF TABLES
Navigate
Trusted by the world's leading organizations


