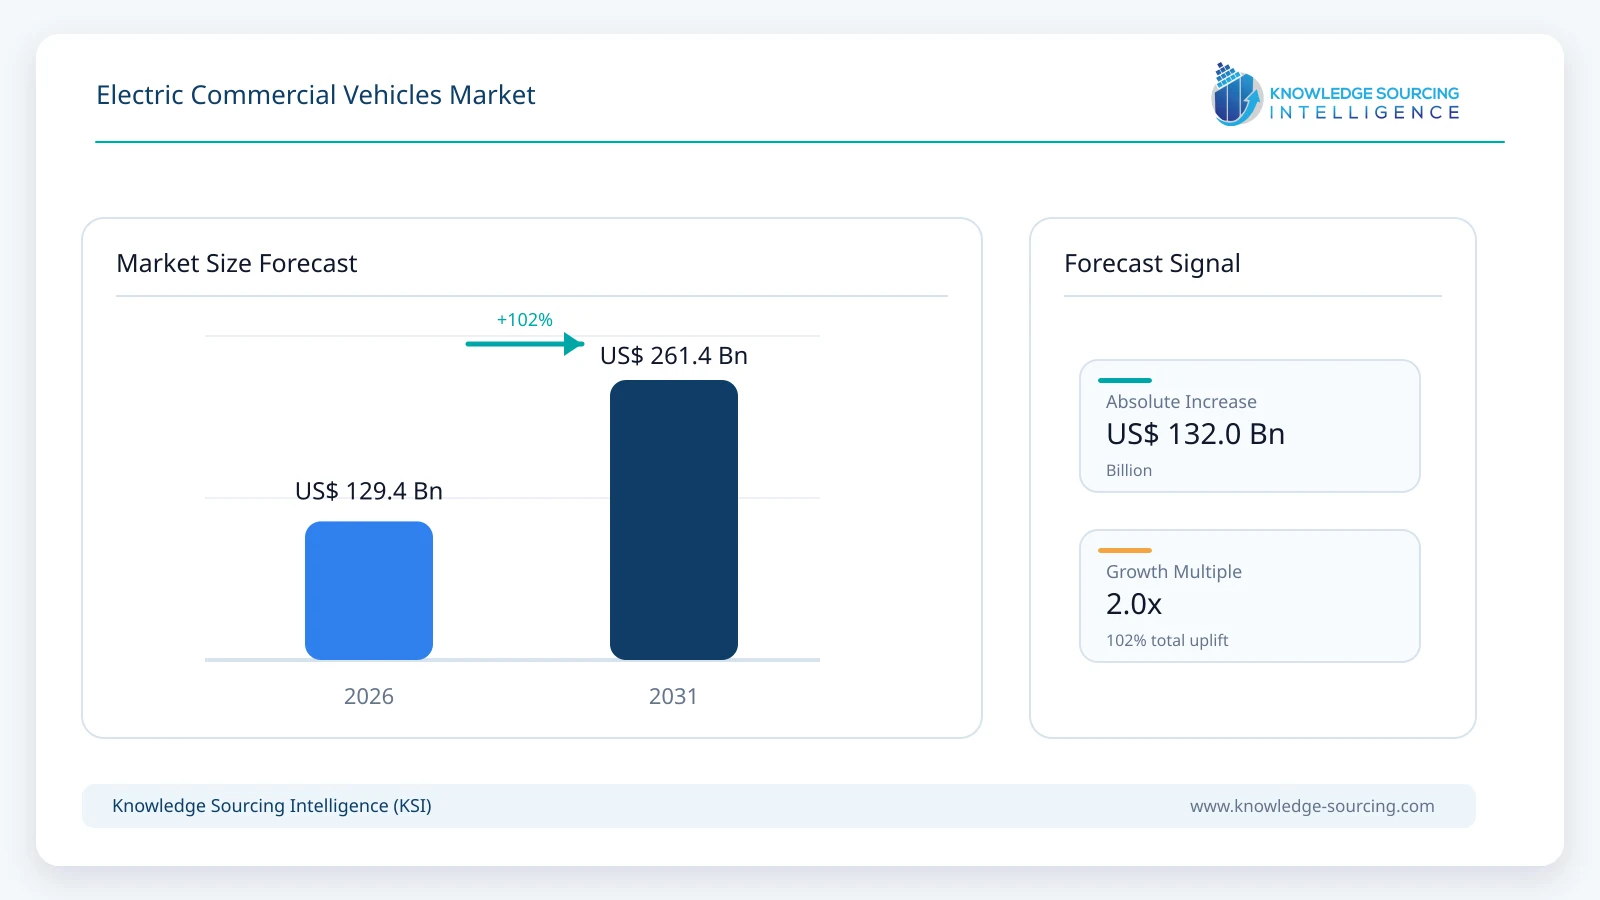
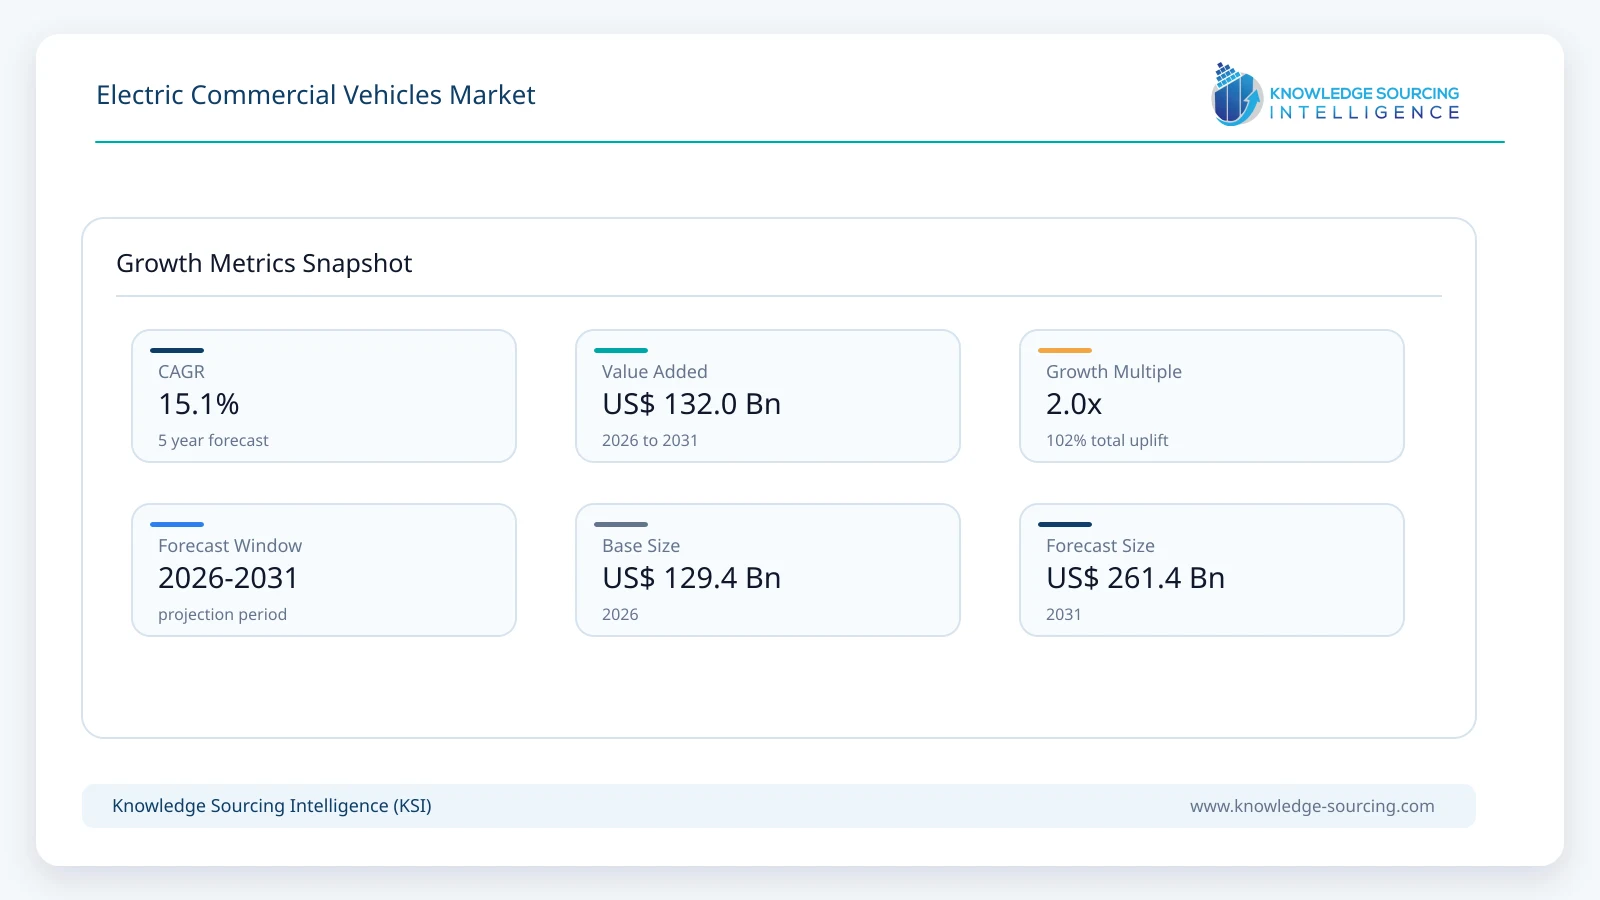
Electric Commercial Vehicles Market Report, Size, Share, Opportunities, and Trends Segmented By Vehicle Type, Propulsion, Power Output, Application, and Geography – Forecasts from 2025 to 2030
Comprehensive analysis of demand drivers, supply-side constraints, competitive landscape, and growth opportunities across applications and regions.
Description
Electric Commercial Vehicles Market Size:
The Electric Commercial Vehicles Market is set to witness robust growth at a CAGR of 15.23% during the forecast period, to be worth US$228.202 billion in 2030 from US$112.337 billion in 2025.
Electric Commercial Vehicles Market Highlights:
- Driving fleet electrification: Companies are adopting zero-emission vehicles to meet regulations.
- Enhancing battery performance: Advanced EV batteries are extending range for commercial use.
- Expanding charging infrastructure: Fast-charging networks are reducing downtime for electric fleets.
- Boosting public transit: Electric buses are transforming sustainable urban transportation systems.
- Optimizing logistics efficiency: AI and telematics are improving electric truck operations.
- Supporting V2G integration: EVs are enabling energy feedback for grid stability.
- Leading in Asia-Pacific: China and India are pioneering electric vehicle adoption.
To learn more about this report, request a free sample copy
Electric Commercial Vehicles Market Introduction:
The electric commercial vehicle market is reshaping transportation by focusing on sustainability and efficiency. Encompassing the electric trucks market, electric buses market, and electric vans market, it includes the eLCV market (light-duty electric vehicles), medium-duty electric vehicles, and heavy-duty electric vehicles. Zero-emission commercial vehicles are gaining traction as industries prioritize fleet electrification to meet stringent emissions regulations and reduce operational costs. Advancements in battery technology, charging infrastructure, and vehicle range are driving adoption across logistics, public transit, and delivery sectors. This market is pivotal for achieving decarbonization goals in global commercial transportation systems.
Electric Commercial Vehicles Market Trends:
The market for electric commercial vehicles is growing due to environmental concerns, lower costs, and technological advancements. Strict governmental emission regulations are being established worldwide to fight climate change because EVs deliver zero-emission capabilities. These automobiles present reduced maintenance costs and lower operating expenses due to their usage of less expensive electricity and lower maintenance intensity. The performance of electric commercial vehicles, a broader accessible charging network, enhanced battery technology, and electric drivetrain developments are becoming more attainable for these vehicles.
The electric commercial vehicle market is advancing with innovative technologies. EV battery technology improvements enhance range and durability, while fast charging commercial vehicles and megawatt charging systems (MCS) reduce downtime for heavy-duty fleets. Vehicle-to-grid (V2G) commercial solutions enable energy feedback, optimizing grid stability. AI fleet management and telematics for electric vehicles improve operational efficiency through predictive analytics and real-time monitoring. Autonomous electric trucks are emerging, streamlining logistics with enhanced safety. Modular EV platforms offer flexibility, enabling scalable designs for diverse applications. These trends underscore the industry’s focus on efficiency, sustainability, and technological integration in commercial transportation.
Electric Commercial Vehicles Market Growth Drivers:
- Stringent Regulatory Support and Environmental Policies: Governments worldwide enforce strict environmental rules that combine incentives and subsidies for Electric Vehicles to boost consumer demand for electric automobiles. The adoption of electric technology in commercial fleets is rising because companies are working to attract eco-conscious consumers and minimize their carbon emissions. In August 2024, India launched its BHARAT Zero Emission Trucking Policy to push zero-emission trucking projects while decreasing transportation sector emissions, targeting 100% sales penetration by 2050 as a part of the Net Zero 2070 commitment.
- Growing Technological Advancement: New EV battery technologies and improved EV charging technologies in the commercial sector allow drivers to operate vehicles with heavier load limits for longer distances. Fast-charging networks have helped remove range anxiety for electric commercial vehicle operators, thus making these vehicles more approachable for fleet operations. Fleet operators find electric commercial automobiles highly appealing as companies push forward their commercial EV portfolio investments. In November 2024, Mahindra Last Mile Mobility Limited achieved leadership status in sustainable transportation and commercial EV innovation by selling over 2,00,000 electric vehicles in India.
Electric Commercial Vehicles Market Segmentation Analysis By Vehicle Type:
- Buses and Coaches: Widespread adoption in city transportation systems drives the demand for electric buses and coaches because they provide lower costs for ownership and service. There is also broad governmental backing for zero-emission public transport.
- Trucks: The electric truck segment is growing significantly because logistics companies aim to lower environmental impact and operational costs. Established auto producers develop new vehicle models at expanded capacity while improving electrical range performance and fast refueling technology.
Electric Commercial Vehicles Market Segmentation Analysis By Propulsion:
- Battery Electric Vehicles (BEVs): The BEV segment holds the largest market share for electric commercial vehicles, by controlling extensive sales. The current increase in consumer demand for zero-emission vehicles drives manufacturers to create fully electric models for their product lines. Electric vehicle development experts are advancing lithium-ion batteries to increase the vehicle range while lowering prices.
- Plug-in Hybrid Electric Vehicles (PHEVs): Blending electric components with traditional combustion power into PHEVs provides businesses with flexible electric range capabilities despite limited charging options. Current electric models enable fleet operators to reduce their reliance on fossil fuels for city driving while they await the complete transition to electric vehicles.
Electric Commercial Vehicles Market Geographical Outlook:
The Electric Commercial Vehicles Market report analyzes growth factors across the following five regions:
- North America: Widespread interest in zero-emission vehicles, growing environmental awareness, and rising fuel prices are driving electric vehicle adoption across North America. Programs like California's Advanced Clean Trucks regulation and New York City's Clean Trucks Program are contributing to the regional market growth.
- South America: South American electric commercial vehicle adoption rates have risen quickly as Brazil and Chile emerge at the forefront of the market. Sustainable transportation development and pollution reduction form the core objectives of the present government programs. Insufficient charging infrastructure hinders market expansion; thus, government investments in renewable energy will be necessary for further development.
- Europe: European nations are making headway toward electric car adoption through solid regulatory systems and investments in charging stations. The EU's Green Deal envisions reducing emissions until they reach almost 55% of their previous levels by 2030, alongside Germany and the UK, among other countries operating as pioneers in infrastructure design.
- Middle East and Africa: Growing environmental awareness in urban areas in the Middle East and African region is increasing the exploration of EVs in South African markets. Proper charging infrastructure is critical, but insufficient policy support hinders the successful adoption of electric commercial vehicles.
- Asia-Pacific: Due to rapid urbanization, demand for efficient public transport solutions is surging across the Asia-Pacific region, where China and India are leading nations. China's BEV market success relies on government support through policies and monetary support, yet India advances the electric mobility drive through policies like FAME II.
List of Top Electric Commercial Vehicle Companies:
- Daimler Truck
- BYD Co., Ltd.
- Tesla, Inc.
- Volvo Trucks
Companies are securing stronger market standings through fresh product launches and strategic alliance formation as major vehicle producers collaborate with technology organizations to develop enhanced powertrain and charging infrastructure. New startup ventures continue to access this market by introducing revolutionary business concepts alongside unique technological approaches.
Electric Commercial Vehicles Market Latest Developments:
- In October 2024, Volvo announced that it plans to launch an FH Electric version with an increased range of 600 km on one full charge. This will allow transport businesses to cover long-range interstate runs and operate throughout an entire working day before needing to recharge. This long-range electric truck model is expected to become available during the second half of 2025.
- In April 2024, Daimler India Commercial Vehicles (DICV) under Daimler Truck AG unveiled the all-electric light-duty truck Next Generation eCanter for India's market while developing a sustainable, CO2-neutral propulsive strategy for future products through the battery-electric market entry.
Electric Commercial Vehicles Market Scope:
Report Metric | Details |
Electric Commercial Vehicles Market Size in 2025 | US$112.337 billion |
Electric Commercial Vehicles Market Size in 2030 | US$228.202 billion |
Growth Rate | CAGR of 15.23% |
Study Period | 2020 to 2030 |
Historical Data | 2020 to 2023 |
Base Year | 2024 |
Forecast Period | 2025 – 2030 |
Forecast Unit (Value) | USD Billion |
Segmentation |
|
Geographical Segmentation | North America, South America, Europe, Middle East and Africa, Asia Pacific |
List of Major Companies in the Electric Commercial Vehicles Market |
|
Customization Scope | Free report customization with purchase |
Electric Commercial Vehicles Market Segmentation:
- By Vehicle Type
- Buses and Coaches
- Trucks (Light-Duty Trucks, Medium-Duty Trucks, Heavy-Duty Trucks)
- Vans
- By Propulsion
- Battery Electric Vehicles (BEVs)
- Plug-in Hybrid Electric Vehicles (PHEVs)
- Fuel Cell Electric Vehicles (FCEVs)
- By Power Output
- Up to 150 kW
- 150-250 kW
- Above 250 kW
- By Application
- Logistics and Transportation
- Public Transportation
- Construction (Excavators, Loaders, Others)
- Mining
- Agriculture (Tractors, Harvesters, Others)
- Others
- By Geography
- North America
- USA
- Canada
- Mexico
- South America
- Brazil
- Argentina
- Others
- Europe
- United Kingdom
- Germany
- France
- Spain
- Others
- Middle East and Africa
- Saudi Arabia
- UAE
- Others
- Asia Pacific
- China
- Japan
- India
- South Korea
- Taiwan
- Australia
- Others
- North America
Our Best-Performing Industry Reports:
- Vehicle-To-Grid (V2G) Market
- Global Electric Vehicle Market
- Electric Vehicle Charging Stations Market
Navigation
- Electric Commercial Vehicles Market Size:
- Electric Commercial Vehicles Market Highlights:
- Electric Commercial Vehicles Market Introduction:
- Electric Commercial Vehicles Market Trends:
- Electric Commercial Vehicles Market Growth Drivers:
- Electric Commercial Vehicles Market Segmentation Analysis By Vehicle Type:
- Electric Commercial Vehicles Market Segmentation Analysis By Propulsion:
- Electric Commercial Vehicles Market Geographical Outlook:
- List of Top Electric Commercial Vehicle Companies:
- Electric Commercial Vehicles Market Latest Developments:
- Electric Commercial Vehicles Market Scope:
- Our Best-Performing Industry Reports:
Page last updated on: September 26, 2025
Table Of Contents
1. Executive Summary
2. Market Snapshot
2.1. Market Overview
2.2. Market Definition
2.3. Scope of the Study
2.4. Market Segmentation
3. Business Landscape
3.1. Market Drivers
3.2. Market Restraints
3.3. Market Opportunities
3.4. Porter’s Five Forces Analysis
3.5. Industry Value Chain Analysis
3.6. Bandwidth Availability
3.7. Number of Users
3.8. Policies and Regulations
3.9. Strategic Recommendations
4. Technological Advancements
5. Electric Commercial Vehicles Market By Vehicle Type (2020-2030)
5.1. Introduction
5.2. Buses and Coaches
5.3. Trucks
5.3.1. Light-Duty Trucks
5.3.2. Medium-Duty Trucks
5.3.3. Heavy-Duty Trucks
5.4. Vans
6. Electric Commercial Vehicles Market By Propulsion (2020-2030)
6.1. Introduction
6.2. Battery Electric Vehicles (BEVs)
6.3. Plug-in Hybrid Electric Vehicles (PHEVs)
6.4. Fuel Cell Electric Vehicles (FCEVs)
7. Electric Commercial Vehicles Market By Power Output (2020-2030)
7.1. Introduction
7.2. Up to 150 kW
7.3. 150-250 kW
7.4. Above 250 kW
8. Electric Commercial Vehicles Market By Application (2020-2030)
8.1. Introduction
8.2. Logistics and Transportation
8.3. Public Transportation
8.4. Construction
8.4.1. Excavators
8.4.2. Loaders
8.4.3. Others
8.5. Mining
8.6. Agriculture
8.6.1. Tractors
8.6.2. Harvesters
8.6.3. Others
8.7. Others
9. Electric Commercial Vehicles Market By Geography (2020-2030)
9.1. Introduction
9.2. North America
9.2.1. By Vehicle Type
9.2.2. By Propulsion
9.2.3. By Power Output
9.2.4. By Application
9.2.5. By Country
9.2.5.1. United States
9.2.5.2. Canada
9.2.5.3. Mexico
9.3. South America
9.3.1. By Vehicle Type
9.3.2. By Propulsion
9.3.3. By Power Output
9.3.4. By Application
9.3.5. By Country
9.3.5.1. Brazil
9.3.5.2. Argentina
9.3.5.3. Others
9.4. Europe
9.4.1. By Vehicle Type
9.4.2. By Propulsion
9.4.3. By Power Output
9.4.4. By Application
9.4.5. By Country
9.4.5.1. United Kingdom
9.4.5.2. Germany
9.4.5.3. France
9.4.5.4. Spain
9.4.5.5. Others
9.5. Middle East and Africa
9.5.1. By Vehicle Type
9.5.2. By Propulsion
9.5.3. By Power Output
9.5.4. By Application
9.5.5. By Country
9.5.5.1. Saudi Arabia
9.5.5.2. UAE
9.5.5.3. Others
9.6. Asia Pacific
9.6.1. By Vehicle Type
9.6.2. By Propulsion
9.6.3. By Power Output
9.6.4. By Application
9.6.5. By Country
9.6.5.1. China
9.6.5.2. Japan
9.6.5.3. India
9.6.5.4. South Korea
9.6.5.5. Taiwan
9.6.5.6. Australia
9.6.5.7. Others
10. Competitive Environment and Analysis
10.1. Major Players and Strategy Analysis
10.2. Market Share Analysis
10.3. Mergers, Acquisitions, Agreements, and Collaborations
10.4. Competitive Dashboard
11. Company Profiles
11.1. BYD Co., Ltd.
11.2. Tesla, Inc.
11.3. Ford Motor Company
11.4. Rivian
11.5. Workhorse Group Inc.
11.6. Nikola Corporation
11.7. Daimler Truck AG
11.8. AB Volvo
11.9. Volkswagen Group
11.10. Hyundai Motor Company
11.11. Tata Motors
11.12. Mahindra & Mahindra Limited
12. Research Methodology
List of Tables
Table 1: Electric Commercial Vehicles Market, Key Findings
Table 2: Electric Commercial Vehicles Market, By Vehicle Type, USD Billion, 2020–2030
Table 3: Electric Commercial Vehicles Market, By Vehicle Type, Thousand Units, 2020–2030
Table 4: Electric Commercial Vehicles Market Shares, By Vehicle Type, 2025 and 2030 (%)
Table 5: Electric Commercial Vehicles Market, By Propulsion, USD Billion, 2020–2030
Table 6: Electric Commercial Vehicles Market, By Propulsion, Thousand Units, 2020–2030
Table 7: Electric Commercial Vehicles Market Shares, By Propulsion, 2025 and 2030 (%)
Table 8: Electric Commercial Vehicles Market, By Power Output, USD Billion, 2020–2030
Table 9: Electric Commercial Vehicles Market, By Power Output, Thousand Units, 2020–2030
Table 10: Electric Commercial Vehicles Market Shares, By Power Output, 2025 and 2030 (%)
Table 11: Electric Commercial Vehicles Market, By Application, USD Billion, 2020–2030
Table 12: Electric Commercial Vehicles Market, By Application, Thousand Units, 2020–2030
Table 13: Electric Commercial Vehicles Market Shares, By Application, 2025 and 2030 (%)
Table 14: Electric Commercial Vehicles Market, By Geography, USD Billion, 2020–2030
Table 15: Electric Commercial Vehicles Market, By Geography, Thousand Units, 2020–2030
Table 16: Electric Commercial Vehicles Market Shares, By Geography, 2025 and 2030 (%)
Table 17: North America Electric Commercial Vehicles Market, By Vehicle Type, USD Billion, 2020–2030
Table 18: North America Electric Commercial Vehicles Market, By Vehicle Type, Thousand Units, 2020–2030
Table 19: North America Electric Commercial Vehicles Market Shares, By Vehicle Type, 2025 and 2030 (%)
Table 20: North America Electric Commercial Vehicles Market, By Propulsion, USD Billion, 2020–2030
Table 21: North America Electric Commercial Vehicles Market, By Propulsion, Thousand Units, 2020–2030
Table 22: North America Electric Commercial Vehicles Market Shares, By Propulsion, 2025 and 2030 (%)
Table 23: North America Electric Commercial Vehicles Market, By Power Output, USD Billion, 2020–2030
Table 24: North America Electric Commercial Vehicles Market, By Power Output, Thousand Units, 2020–2030
Table 25: North America Electric Commercial Vehicles Market Shares, By Power Output, 2025 and 2030 (%)
Table 26: North America Electric Commercial Vehicles Market, By Application, USD Billion, 2020–2030
Table 27: North America Electric Commercial Vehicles Market, By Application, Thousand Units, 2020–2030
Table 28: North America Electric Commercial Vehicles Market Shares, By Application, 2025 and 2030 (%)
Table 29: North America Electric Commercial Vehicles Market, By Country, USD Billion, 2020–2030
Table 30: North America Electric Commercial Vehicles Market, By Country, Thousand Units, 2020–2030
Table 31: North America Electric Commercial Vehicles Market Shares, By Country, 2025 and 2030 (%)
Table 32: South America Electric Commercial Vehicles Market, By Vehicle Type, USD Billion, 2020–2030
Table 33: South America Electric Commercial Vehicles Market, By Vehicle Type, Thousand Units, 2020–2030
Table 34: South America Electric Commercial Vehicles Market Shares, By Vehicle Type, 2025 and 2030 (%)
Table 35: South America Electric Commercial Vehicles Market, By Propulsion, USD Billion, 2020–2030
Table 36: South America Electric Commercial Vehicles Market, By Propulsion, Thousand Units, 2020–2030
Table 37: South America Electric Commercial Vehicles Market Shares, By Propulsion, 2025 and 2030 (%)
Table 38: South America Electric Commercial Vehicles Market, By Power Output, USD Billion, 2020–2030
Table 39: South America Electric Commercial Vehicles Market, By Power Output, Thousand Units, 2020–2030
Table 40: South America Electric Commercial Vehicles Market Shares, By Power Output, 2025 and 2030 (%)
Table 41: South America Electric Commercial Vehicles Market, By Application, USD Billion, 2020–2030
Table 42: South America Electric Commercial Vehicles Market, By Application, Thousand Units, 2020–2030
Table 43: South America Electric Commercial Vehicles Market Shares, By Application, 2025 and 2030 (%)
Table 44: South America Electric Commercial Vehicles Market, By Country, USD Billion, 2020–2030
Table 45: South America Electric Commercial Vehicles Market, By Country, Thousand Units, 2020–2030
Table 46: South America Electric Commercial Vehicles Market Shares, By Country, 2025 and 2030 (%)
Table 47: Europe Electric Commercial Vehicles Market, By Vehicle Type, USD Billion, 2020–2030
Table 48: Europe Electric Commercial Vehicles Market, By Vehicle Type, Thousand Units, 2020–2030
Table 49: Europe Electric Commercial Vehicles Market Shares, By Vehicle Type, 2025 and 2030 (%)
Table 50: Europe Electric Commercial Vehicles Market, By Propulsion, USD Billion, 2020–2030
Table 51: Europe Electric Commercial Vehicles Market, By Propulsion, Thousand Units, 2020–2030
Table 52: Europe Electric Commercial Vehicles Market Shares, By Propulsion, 2025 and 2030 (%)
Table 53: Europe Electric Commercial Vehicles Market, By Power Output, USD Billion, 2020–2030
Table 54: Europe Electric Commercial Vehicles Market, By Power Output, Thousand Units, 2020–2030
Table 55: Europe Electric Commercial Vehicles Market Shares, By Power Output, 2025 and 2030 (%)
Table 56: Europe Electric Commercial Vehicles Market, By Application, USD Billion, 2020–2030
Table 57: Europe Electric Commercial Vehicles Market, By Application, Thousand Units, 2020–2030
Table 58: Europe Electric Commercial Vehicles Market Shares, By Application, 2025 and 2030 (%)
Table 59: Europe Electric Commercial Vehicles Market, By Country, USD Billion, 2020–2030
Table 60: Europe Electric Commercial Vehicles Market, By Country, Thousand Units, 2020–2030
Table 61: Europe Electric Commercial Vehicles Market Shares, By Country, 2025 and 2030 (%)
Table 62: Middle East and Africa Electric Commercial Vehicles Market, By Vehicle Type, USD Billion, 2020–2030
Table 63: Middle East and Africa Electric Commercial Vehicles Market, By Vehicle Type, Thousand Units, 2020–2030
Table 64: Middle East and Africa Electric Commercial Vehicles Market Shares, By Vehicle Type, 2025 and 2030 (%)
Table 65: Middle East and Africa Electric Commercial Vehicles Market, By Propulsion, USD Billion, 2020–2030
Table 66: Middle East and Africa Electric Commercial Vehicles Market, By Propulsion, Thousand Units, 2020–2030
Table 67: Middle East and Africa Electric Commercial Vehicles Market Shares, By Propulsion, 2025 and 2030 (%)
Table 68: Middle East and Africa Electric Commercial Vehicles Market, By Power Output, USD Billion, 2020–2030
Table 69: Middle East and Africa Electric Commercial Vehicles Market, By Power Output, Thousand Units, 2020–2030
Table 70: Middle East and Africa Electric Commercial Vehicles Market Shares, By Power Output, 2025 and 2030 (%)
Table 71: Middle East and Africa Electric Commercial Vehicles Market, By Application, USD Billion, 2020–2030
Table 72: Middle East and Africa Electric Commercial Vehicles Market, By Application, Thousand Units, 2020–2030
Table 73: Middle East and Africa Electric Commercial Vehicles Market Shares, By Application, 2025 and 2030 (%)
Table 74: Middle East and Africa Electric Commercial Vehicles Market, By Country, USD Billion, 2020–2030
Table 75: Middle East and Africa Electric Commercial Vehicles Market, By Country, Thousand Units, 2020–2030
Table 76: Middle East and Africa Electric Commercial Vehicles Market Shares, By Country, 2025 and 2030 (%)
Table 77: Asia Pacific Electric Commercial Vehicles Market, By Vehicle Type, USD Billion, 2020–2030
Table 78: Asia Pacific Electric Commercial Vehicles Market, By Vehicle Type, Thousand Units, 2020–2030
Table 79: Asia Pacific Electric Commercial Vehicles Market Shares, By Vehicle Type, 2025 and 2030 (%)
Table 80: Asia Pacific Electric Commercial Vehicles Market, By Propulsion, USD Billion, 2020–2030
Table 81: Asia Pacific Electric Commercial Vehicles Market, By Propulsion, Thousand Units, 2020–2030
Table 82: Asia Pacific Electric Commercial Vehicles Market Shares, By Propulsion, 2025 and 2030 (%)
Table 83: Asia Pacific Electric Commercial Vehicles Market, By Power Output, USD Billion, 2020–2030
Table 84: Asia Pacific Electric Commercial Vehicles Market, By Power Output, Thousand Units, 2020–2030
Table 85: Asia Pacific Electric Commercial Vehicles Market Shares, By Power Output, 2025 and 2030 (%)
Table 86: Asia Pacific Electric Commercial Vehicles Market, By Application, USD Billion, 2020–2030
Table 87: Asia Pacific Electric Commercial Vehicles Market, By Application, Thousand Units, 2020–2030
Table 88: Asia Pacific Electric Commercial Vehicles Market Shares, By Application, 2025 and 2030 (%)
Table 89: Asia Pacific Electric Commercial Vehicles Market, By Country, USD Billion, 2020–2030
Table 90: Asia Pacific Electric Commercial Vehicles Market, By Country, Thousand Units, 2020–2030
Table 91: Asia Pacific Electric Commercial Vehicles Market Shares, By Country, 2025 and 2030 (%)
Table 92: Electric Commercial Vehicles Market, Strategy Analysis of Major Players
Table 93: Electric Commercial Vehicles Market, Mergers, Acquisitions, Agreements, and Collaborations
Table 94: BYD Co., Ltd., Products and Services
Table 95: Tesla, Inc., Products and Services
Table 96: Ford Motor Company, Products and Services
Table 97: Rivian, Products and Services
Table 98: Workhorse Group Inc., Products and Services
Table 99: Nikola Corporation, Products and Services
Table 100: Daimler Truck AG, Products and Services
Table 101: AB Volvo, Products and Services
Table 102: Volkswagen Group, Products and Services
Table 103: Hyundai Motor Company, Products and Services
Table 104: Tata Motors, Products and Services
Table 105: Mahindra & Mahindra Limited, Products and Services
List of Figures
Figure 1: Electric Commercial Vehicles Market Size, USD Billion, 2020–2030
Figure 2: Electric Commercial Vehicles Market Size, Thousand Units, 2020–2030
Figure 3: Electric Commercial Vehicles Market Segmentation
Figure 4: Key Market Drivers Impact Analysis
Figure 5: Key Market Restraints Impact Analysis
Figure 6: Key Market Opportunities Impact Analysis
Figure 7: Porter’s Five Forces Analysis: Bargaining Power of Suppliers
Figure 8: Porter’s Five Forces Analysis: Bargaining Power of Buyers
Figure 9: Porter’s Five Forces Analysis: Threat of New Entrants
Figure 10: Porter’s Five Forces Analysis: Threat of Substitutes
Figure 11: Porter’s Five Forces Analysis: Competitive Rivalry in the Industry
Figure 12: Electric Commercial Vehicles Market, Industry Value Chain Analysis
Figure 13: Electric Commercial Vehicles Market, Bandwidth Availability, 2020–2030
Figure 14: Electric Commercial Vehicles Market, Number of Users, 2020–2030
Figure 15: Electric Commercial Vehicles Market Share (%), By Vehicle Type, 2025 and 2030
Figure 16: Electric Commercial Vehicles Market Attractiveness by Vehicle Type, 2030
Figure 17: Electric Commercial Vehicles Market Share (%), By Propulsion, 2025 and 2030
Figure 18: Electric Commercial Vehicles Market Attractiveness by Propulsion, 2030
Figure 19: Electric Commercial Vehicles Market Share (%), By Power Output, 2025 and 2030
Figure 20: Electric Commercial Vehicles Market Attractiveness by Power Output, 2030
Figure 21: Electric Commercial Vehicles Market Share (%), By Application, 2025 and 2030
Figure 22: Electric Commercial Vehicles Market Attractiveness by Application, 2030
Figure 23: Electric Commercial Vehicles Market Share (%), By Geography, 2025 and 2030
Figure 24: Electric Commercial Vehicles Market Attractiveness by Geography, 2030
Figure 25: North America Electric Commercial Vehicles Market, USD Billion, 2020–2030
Figure 26: North America Electric Commercial Vehicles Market, Thousand Units, 2020–2030
Figure 27: North America Electric Commercial Vehicles Market Share (%), By Vehicle Type, 2025 and 2030
Figure 28: North America Electric Commercial Vehicles Market Attractiveness, By Vehicle Type, 2030
Figure 29: North America Electric Commercial Vehicles Market Share (%), By Propulsion, 2025 and 2030
Figure 30: North America Electric Commercial Vehicles Market Attractiveness, By Propulsion, 2030
Figure 31: North America Electric Commercial Vehicles Market Share (%), By Power Output, 2025 and 2030
Figure 32: North America Electric Commercial Vehicles Market Attractiveness, By Power Output, 2030
Figure 33: North America Electric Commercial Vehicles Market Share (%), By Application, 2025 and 2030
Figure 34: North America Electric Commercial Vehicles Market Attractiveness, By Application, 2030
Figure 35: North America Electric Commercial Vehicles Market Share (%), By Country, 2025 and 2030
Figure 36: North America Electric Commercial Vehicles Market Attractiveness, By Country, 2030
Figure 37: South America Electric Commercial Vehicles Market, USD Billion, 2020–2030
Figure 38: South America Electric Commercial Vehicles Market, Thousand Units, 2020–2030
Figure 39: South America Electric Commercial Vehicles Market Share (%), By Vehicle Type, 2025 and 2030
Figure 40: South America Electric Commercial Vehicles Market Attractiveness, By Vehicle Type, 2030
Figure 41: South America Electric Commercial Vehicles Market Share (%), By Propulsion, 2025 and 2030
Figure 42: South America Electric Commercial Vehicles Market Attractiveness, By Propulsion, 2030
Figure 43: South America Electric Commercial Vehicles Market Share (%), By Power Output, 2025 and 2030
Figure 44: South America Electric Commercial Vehicles Market Attractiveness, By Power Output, 2030
Figure 45: South America Electric Commercial Vehicles Market Share (%), By Application, 2025 and 2030
Figure 46: South America Electric Commercial Vehicles Market Attractiveness, By Application, 2030
Figure 47: South America Electric Commercial Vehicles Market Share (%), By Country, 2025 and 2030
Figure 48: South America Electric Commercial Vehicles Market Attractiveness, By Country, 2030
Figure 49: Europe Electric Commercial Vehicles Market, USD Billion, 2020–2030
Figure 50: Europe Electric Commercial Vehicles Market, Thousand Units, 2020–2030
Figure 51: Europe Electric Commercial Vehicles Market Share (%), By Vehicle Type, 2025 and 2030
Figure 52: Europe Electric Commercial Vehicles Market Attractiveness, By Vehicle Type, 2030
Figure 53: Europe Electric Commercial Vehicles Market Share (%), By Propulsion, 2025 and 2030
Figure 54: Europe Electric Commercial Vehicles Market Attractiveness, By Propulsion, 2030
Figure 55: Europe Electric Commercial Vehicles Market Share (%), By Power Output, 2025 and 2030
Figure 56: Europe Electric Commercial Vehicles Market Attractiveness, By Power Output, 2030
Figure 57: Europe Electric Commercial Vehicles Market Share (%), By Application, 2025 and 2030
Figure 58: Europe Electric Commercial Vehicles Market Attractiveness, By Application, 2030
Figure 59: Europe Electric Commercial Vehicles Market Share (%), By Country, 2025 and 2030
Figure 60: Europe Electric Commercial Vehicles Market Attractiveness, By Country, 2030
Figure 61: Middle East and Africa Electric Commercial Vehicles Market, USD Billion, 2020–2030
Figure 62: Middle East and Africa Electric Commercial Vehicles Market, Thousand Units, 2020–2030
Figure 63: Middle East and Africa Electric Commercial Vehicles Market Share (%), By Vehicle Type, 2025 and 2030
Figure 64: Middle East and Africa Electric Commercial Vehicles Market Attractiveness, By Vehicle Type, 2030
Figure 65: Middle East and Africa Electric Commercial Vehicles Market Share (%), By Propulsion, 2025 and 2030
Figure 66: Middle East and Africa Electric Commercial Vehicles Market Attractiveness, By Propulsion, 2030
Figure 67: Middle East and Africa Electric Commercial Vehicles Market Share (%), By Power Output, 2025 and 2030
Figure 68: Middle East and Africa Electric Commercial Vehicles Market Attractiveness, By Power Output, 2030
Figure 69: Middle East and Africa Electric Commercial Vehicles Market Share (%), By Application, 2025 and 2030
Figure 70: Middle East and Africa Electric Commercial Vehicles Market Attractiveness, By Application, 2030
Figure 71: Middle East and Africa Electric Commercial Vehicles Market Share (%), By Country, 2025 and 2030
Figure 72: Middle East and Africa Electric Commercial Vehicles Market Attractiveness, By Country, 2030
Figure 73: Asia Pacific Electric Commercial Vehicles Market, USD Billion, 2020–2030
Figure 74: Asia Pacific Electric Commercial Vehicles Market, Thousand Units, 2020–2030
Figure 75: Asia Pacific Electric Commercial Vehicles Market Share (%), By Vehicle Type, 2025 and 2030
Figure 76: Asia Pacific Electric Commercial Vehicles Market Attractiveness, By Vehicle Type, 2030
Figure 77: Asia Pacific Electric Commercial Vehicles Market Share (%), By Propulsion, 2025 and 2030
Figure 78: Asia Pacific Electric Commercial Vehicles Market Attractiveness, By Propulsion, 2030
Figure 79: Asia Pacific Electric Commercial Vehicles Market Share (%), By Power Output, 2025 and 2030
Figure 80: Asia Pacific Electric Commercial Vehicles Market Attractiveness, By Power Output, 2030
Figure 81: Asia Pacific Electric Commercial Vehicles Market Share (%), By Application, 2025 and 2030
Figure 82: Asia Pacific Electric Commercial Vehicles Market Attractiveness, By Application, 2030
Figure 83: Asia Pacific Electric Commercial Vehicles Market Share (%), By Country, 2025 and 2030
Figure 84: Asia Pacific Electric Commercial Vehicles Market Attractiveness, By Country, 2030
Figure 85: Electric Commercial Vehicles Market Share, 2025
Figure 86: Competitive Dashboard
Figure 87: BYD Co., Ltd., Financials, 2022–2024
Figure 88: Tesla, Inc., Financials, 2022–2024
Figure 89: Ford Motor Company, Financials, 2022–2024
Figure 90: Rivian, Financials, 2022–2024
Figure 91: Workhorse Group Inc., Financials, 2022–2024
Figure 92: Nikola Corporation, Financials, 2022–2024
Figure 93: Daimler Truck AG, Financials, 2022–2024
Figure 94: AB Volvo, Financials, 2022–2024
Figure 95: Volkswagen Group, Financials, 2022–2024
Figure 96: Hyundai Motor Company, Financials, 2022–2024
Figure 97: Tata Motors, Financials, 2022–2024
Figure 98: Mahindra & Mahindra Limited, Financials, 2022–2024
Companies Profiled
BYD Co., Ltd.
Tesla, Inc.
Ford Motor Company
Rivian
Nikola Corporation
Daimler Truck AG
AB Volvo
Volkswagen Group
Hyundai Motor Company
Tata Motors
Mahindra & Mahindra Limited
Related Reports
Report Name | Published Month | Download Sample |
---|---|---|
Vehicle Emission Sensor Market Report: Size, Share, Forecast 2030 | May 2025 | |
Electric Vehicle Telematics Market Report: Size, Forecast 2030 | July 2025 | |
EV Charging Connectors Market: Size, Trends, Forecast 2030 | July 2025 | |
EV Battery Cooling Market: Size, Growth, Trends, Forecast 2030 | July 2025 | |
Electric Vehicle Tires Market: Growth, Trends, Forecast 2030 | July 2025 |