
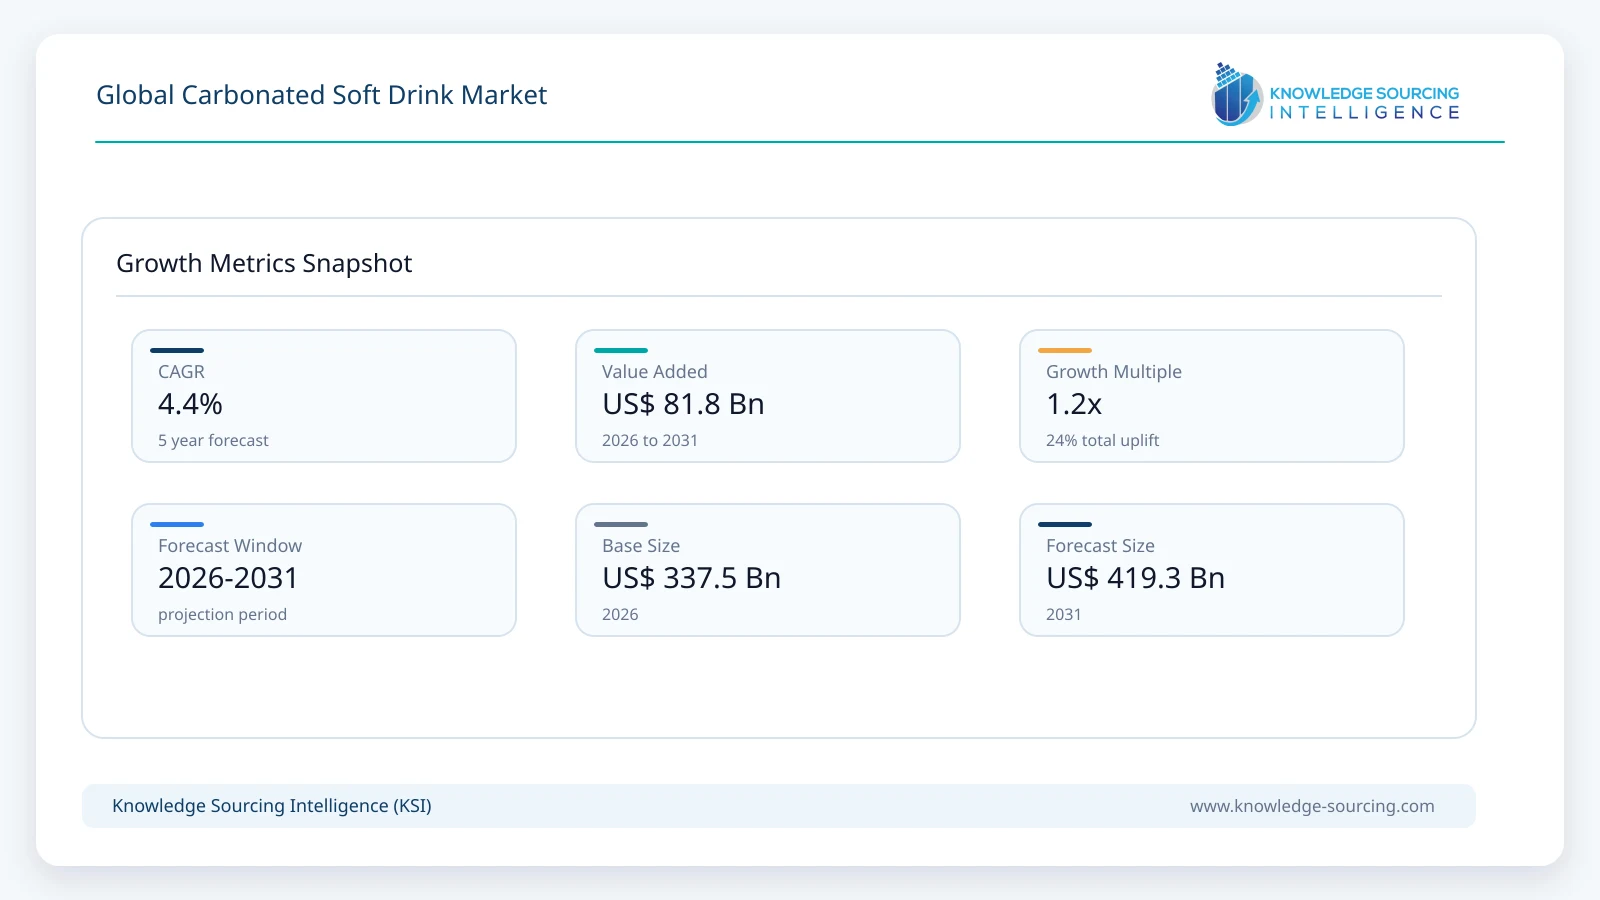
The carbonated soft drink market is forecast to grow at a CAGR of 4.4%, reaching USD 419.3 billion in 2031 from USD 337.5 billion in 2026.
Highlights:
- 1Regular carbonated soft drinks account for approximately 74% of market value in 2026, but their share declines to around 72% by 2031.
- 2Diet products, including zero-sugar variants within the existing KSI classification, increase from approximately 26% in 2026 to 28% by 2031.
- 3Bottled products represent approximately 55% of market value in 2026 and remain the largest packaging format.
- 4Cans are projected to increase from around 33% of market value in 2026 to 35% by 2031.
- 5Offline distribution remains dominant, although online sales increase from approximately 9% to 12% of market value during the forecast period.
- 6North America remains the largest regional market in 2026, while Asia Pacific grows faster and increases its share to approximately 31% by 2031.
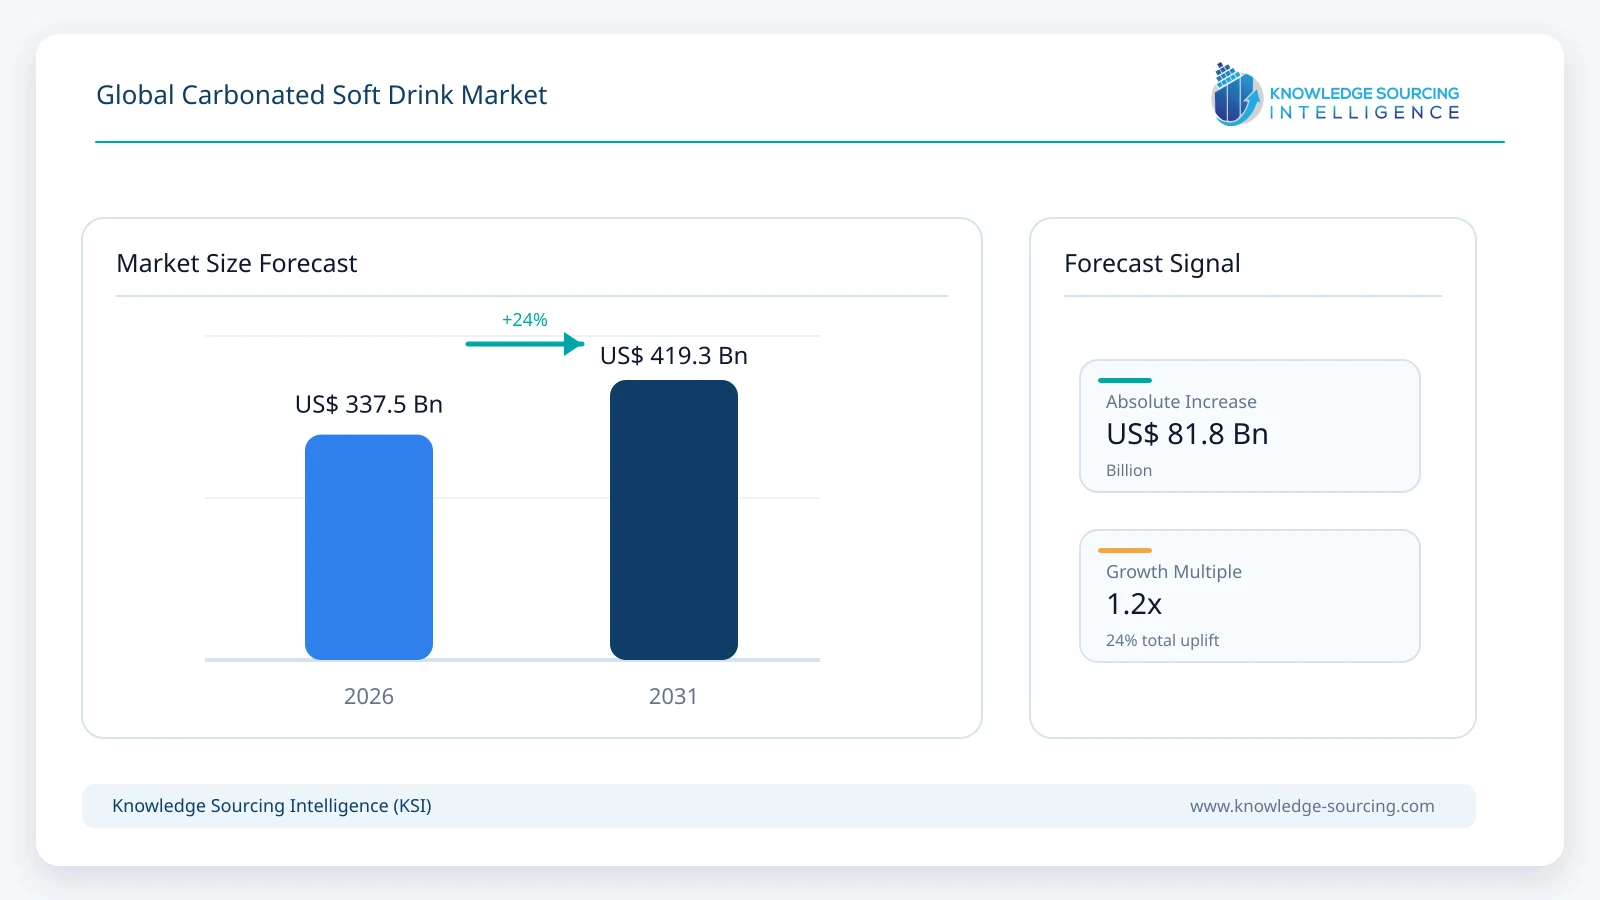
The category remains one of the largest parts of the packaged non-alcoholic beverage industry, supported by established brands, broad retail availability, foodservice distribution and frequent product reformulation. Growth is increasingly based on pricing, zero-sugar products, flavour extensions and packaging changes rather than large increases in conventional full-sugar cola volumes.
The scale of established CSD consumption remains substantial. The Coca-Cola system sold 33.8 billion unit cases across its beverage portfolio in 2025, with sparkling soft drinks accounting for 69% of worldwide unit-case volume. Sparkling products represented 61% of Coca-Cola’s U.S. volume and 70% of its non-U.S. volume, while Mexico, China, Brazil and India together represented a significant part of company-wide unit cases. The data indicate that mature Western markets remain important, but the category is also supported by large consumption bases outside North America.
Volume growth is slower than value growth in several mature markets. Coca-Cola Consolidated reported essentially unchanged sparkling beverage case volume in 2025 while sparkling beverage revenue increased 3.5%, largely through pricing and product mix. This difference is important to the market forecast because the 4.4% value CAGR does not require equivalent physical-volume expansion. Product reformulation, zero-sugar alternatives, premium packs and higher average selling prices can continue increasing market value even where per-capita consumption is mature.
Market Growth Drivers and Trends
Zero-Sugar Products Are Taking a Larger Share of Established CSD Portfolios
Reduced- and zero-sugar products are becoming more important within established soda brands rather than operating only as separate diet ranges. Keurig Dr Pepper reported in February 2026 that zero-sugar products were generating six times more dollar growth than regular CSD varieties and stated that all of its 2026 CSD innovations would be offered in both regular and zero-sugar formats. Coca-Cola also expanded its cherry portfolio during 2026 with both full-sugar and zero-sugar variants and returned Diet Coke Cherry to national distribution in the United States and Canada. The result is a broader choice of reduced-sugar products without requiring consumers to move away from familiar trademarks.
The shift does not imply that regular CSDs lose their dominant position during the forecast period. Coca-Cola’s core trademarks continue to account for a large share of global sparkling volume, while conventional Pepsi, Dr Pepper, 7UP and regional products remain widely consumed. KSI therefore models the Diet segment as increasing from approximately 26% of market value in 2026 to 28% by 2031 rather than replacing the regular category.
Functional Ingredients Are Moving Into Conventional Soda
Functional positioning is beginning to enter the traditional carbonated soft-drink category. PepsiCo completed the USD 1.95 billion acquisition of prebiotic soda brand poppi in May 2025 and subsequently launched Pepsi Prebiotic Cola nationally in the United States in February 2026. The Pepsi product contains 5 grams of sugar and 3 grams of prebiotic fibre, combining a conventional cola trademark with characteristics previously associated mainly with specialist functional soda brands.
Poppi’s performance indicates that this is developing into a meaningful CSD subcategory rather than remaining limited to small direct-to-consumer brands. PepsiCo reported estimated poppi retail sales of almost USD 745 million in 2025, more than 45% above the previous year, and launched the brand in the United Kingdom in February 2026 as its first international market. Functional soda remains small relative to conventional cola, but it gives manufacturers another way to retain consumers who would otherwise reduce traditional soft-drink consumption.
Flavour Rotation Is Increasing Purchase Frequency Without Changing the Core Category
Large CSD manufacturers are using frequent flavour launches to generate trial within established brands. Keurig Dr Pepper’s 2026 innovation programme includes Dr Pepper Creamy Coconut, Canada Dry Fruit Splash Strawberry, A&W Root Beer Float, 7UP seasonal products and multiple zero-sugar variants. The company reported that 44% of U.S. consumers and 72% of Gen Z consumers try new beverages each month, supporting a faster innovation cycle than the traditional permanent-flavour model.
The same pattern is visible across Coca-Cola. Coca-Cola Cherry Float was introduced in both full-sugar and zero-sugar formats in February 2026, while Diet Coke Cherry returned to national distribution. These launches use existing brands and bottling systems rather than requiring entirely new consumer propositions, allowing manufacturers to refresh mature CSD franchises at relatively large distribution scale.
Smaller Packs Are Supporting Portion Control and Higher Revenue Per Unit of Volume
Packaging strategy is becoming more important as manufacturers respond to consumers who want smaller portions without leaving the category. Coca-Cola expanded individual mini-can availability in U.S. convenience stores, covering products including Coca-Cola Original Taste, Coca-Cola Zero Sugar, Coca-Cola Cherry, Sprite and Fanta Orange. Smaller packs allow consumers to reduce serving size while manufacturers can maintain comparatively high value per litre.
This partly explains why value growth can remain above physical-volume growth. Packaging mix, single-serve formats and convenience-channel pricing can raise average realized revenue even where the quantity of liquid sold changes only modestly. Cans also benefit from strong single-serve demand and high recycling rates in markets with established aluminium collection systems, supporting a moderate increase in their share through 2031.
Distribution Scale Remains a Major Barrier to New Entrants
CSD competition depends heavily on bottling and distribution rather than brand development alone. Coca-Cola operates through a global network of bottling partners, distributors, wholesalers and retailers across more than 200 countries and territories, while PepsiCo, Keurig Dr Pepper and regional bottlers maintain similarly extensive route-to-market systems in their core markets. Coca-Cola’s five largest independent bottling partners alone cover major parts of Latin America, Europe, Asia and other regions.
This distribution structure allows established companies to introduce new flavours, zero-sugar products and packaging formats across thousands of outlets quickly. Emerging brands can generate consumer interest through digital channels, but national or international expansion typically requires access to manufacturing, warehousing, cold equipment and store-level distribution. PepsiCo’s acquisition of poppi demonstrates one route by which a fast-growing challenger can gain access to a much larger distribution platform.
Market Restraints
Sugar Reduction Policies Continue to Affect Regular CSD Demand
Governments increasingly use sugar taxes, labelling requirements and health policy to reduce consumption of high-sugar beverages. These measures increase the price differential between conventional products and reformulated alternatives and give manufacturers an incentive to reduce sugar levels or expand zero-sugar portfolios. The market does not necessarily lose the entire consumption occasion, but volume can shift from regular products toward diet and zero-sugar variants.
The effect differs considerably by country because tax thresholds and consumer responses vary. Manufacturers with strong formulation capability and established zero-sugar brands are better positioned to retain category demand, while smaller producers can face higher reformulation and compliance costs.
Mature Markets Have Limited Volume Growth
Per-capita CSD consumption is already high in several North American and European markets, limiting the scope for sustained volume growth. Coca-Cola’s 2025 results show that global system unit-case volume increased only slightly, while regional performance varied substantially. Coca-Cola Consolidated similarly reported no meaningful increase in sparkling bottle and can case volume despite higher sales value.
Future value growth in these markets therefore depends more heavily on pricing, package mix, premiumisation and new formulations. This makes category performance more sensitive to consumer willingness to accept higher prices.
Bottling and Packaging Costs Affect Margin
CSD production requires sweeteners, concentrates, carbon dioxide, aluminium, PET resin, glass, water, energy and freight. Changes in aluminium, resin and energy prices can materially affect bottlers because packaging represents a significant proportion of finished beverage cost.
Large companies can use scale, long-term procurement and multiple packaging formats to reduce exposure, but cost increases can still require higher retail prices. Smaller brands and regional bottlers generally have less purchasing leverage and can therefore face greater margin pressure.
Competition from Other Non-Alcoholic Beverages Is Increasing
Consumers can choose from bottled water, energy drinks, sports drinks, tea, coffee, juice, sparkling water and functional beverages in addition to conventional soda. Large beverage companies increasingly own products across several of these categories, reducing company-level dependence on CSDs but increasing competition for the consumer occasion.
Coca-Cola’s 2026 second-quarter results illustrate this portfolio approach, with growth across Coca-Cola, Powerade and other beverage platforms alongside new functional products. CSD manufacturers therefore need to maintain product relevance while competing with adjacent categories that may carry stronger hydration, energy or wellness positioning.
Regulatory and Sustainability Requirements Increase Packaging Complexity
Single-use packaging is under increasing regulatory scrutiny, particularly in Europe and markets introducing deposit-return, recycled-content or producer-responsibility requirements. Bottlers need to increase recycled PET use, redesign packaging and participate in collection systems while maintaining product shelf life and carbonation performance.
The regulation does not remove demand for carbonated beverages, but it raises capital and operating requirements throughout the packaging system. Manufacturers with established returnable glass, refillable PET or closed-loop recycling infrastructure are better positioned than smaller suppliers where requirements become more stringent.
Carbonated Soft Drink Market Segmentation Analysis
By Type
Regular
Regular carbonated soft drinks account for approximately USD 249.75 billion, or 74% of market value, in 2026. Conventional cola, lemon-lime, orange, root beer, ginger ale and other sweetened products retain large consumer bases and extensive distribution through supermarkets, convenience stores, restaurants and vending channels. Coca-Cola reported that sparkling soft drinks accounted for 69% of its worldwide unit-case volume in 2025, illustrating the continuing scale of the core category.
The segment is projected to reach approximately USD 301.9 billion by 2031. Growth remains positive but below the total market as sugar reduction, zero-sugar formulations and functional sodas absorb part of incremental spending. Regular products still account for roughly 72% of market value at the end of the forecast period.
Diet
Diet carbonated soft drinks account for approximately USD 87.75 billion, or 26% of market value, in 2026. The existing KSI classification captures diet and zero-sugar products within this segment, including major brand extensions such as Coca-Cola Zero Sugar, Diet Coke, Pepsi Zero Sugar and Dr Pepper Zero Sugar.
Keurig Dr Pepper’s 2026 portfolio strategy provides evidence of the changing mix, with every CSD innovation planned in regular and zero-sugar versions and zero-sugar products generating materially faster dollar growth than conventional variants. KSI projects Diet CSD value to reach approximately USD 117.4 billion by 2031, increasing its share to around 28%.
By Packaging
Bottled
Bottled CSDs represent approximately 55% of market value in 2026 and remain the largest packaging segment. PET bottles support family packs, convenience sizes and broad retail distribution, while returnable glass continues to be important in parts of Latin America, Asia and other markets.
The segment reaches approximately USD 222.2 billion by 2031 but declines to around 53% share as cans grow faster. Bottles remain structurally important because of their wide range of sizes and compatibility with both immediate and future consumption.
Canned
Cans account for approximately 33% of market value in 2026 and are projected to reach around 35% by 2031. The format performs strongly in convenience stores, supermarkets and single-serve consumption and is widely used for limited-edition flavours and zero-sugar products.
The segment grows at approximately 5.7% annually through 2031. Smaller cans also allow manufacturers to address portion-control requirements without removing products from the category, while aluminium recycling infrastructure supports the format in many developed markets.
Soda Fountain
Soda Fountain accounts for approximately 12% of market value in 2026 and maintains broadly stable share through 2031. Quick-service restaurants, cinemas, entertainment venues and other foodservice locations remain the main demand base.
The segment benefits from comparatively low packaging requirements and strong restaurant partnerships but is tied more closely to out-of-home traffic than packaged retail formats. Fountain systems also increasingly support multiple regular, diet and flavoured products from the same equipment.
By Distribution Channel
Offline channels account for approximately 91% of market value in 2026 because supermarkets, convenience stores, restaurants, vending machines and other physical outlets remain the main purchasing points for CSDs. Immediate-consumption purchases are especially important because consumers often select single bottles or cans for consumption shortly after purchase.
Online channels represent approximately 9% of market value in 2026 but are projected to reach around 12% by 2031. Multi-pack purchases, grocery delivery and direct digital promotions support faster growth, although the economics of shipping individual heavy beverage packages limit the extent to which online channels can displace physical distribution.
Geographical Outlook
North America accounts for approximately 31% of global market value in 2026 and remains the largest regional market at the start of the forecast period. The United States combines high per-capita CSD consumption with major producers including Coca-Cola, PepsiCo and Keurig Dr Pepper. Growth is increasingly concentrated in zero-sugar products, flavour innovation and pricing rather than major expansion in conventional soda volume.
Asia Pacific accounts for approximately 29% of market value in 2026 and is projected to reach around 31% by 2031. China and India provide large consumer bases, while international and domestic beverage companies continue expanding local bottling and distribution. Coca-Cola identified China and India among its largest non-U.S. markets by unit-case volume in 2025, alongside Mexico and Brazil.
Europe represents approximately 24% of market value in 2026. The region retains substantial demand but faces strong sugar-reduction and packaging regulation, contributing to faster movement toward no-sugar variants and reformulated products. Its share declines modestly to approximately 23% through 2031.
South America represents around 10% of the market, led by Brazil and Argentina. Coca-Cola FEMSA reported 2025 volume growth in Brazil and Argentina despite weaker performance in Mexico, showing that Latin American CSD demand remains substantial but varies materially by country and economic conditions.
Middle East & Africa accounts for approximately 6% of market value in 2026. Population growth, urbanisation and broader modern retail support expansion, although income differences and distribution infrastructure produce significant variation between countries.
Recent Developments
August 2026, Keurig Dr Pepper introduced the largest reformulation of 7UP in more than 15 years, shifting the brand toward a more lime-forward formulation across regular, zero-sugar and cherry variants. The change illustrates how major CSD brands are using formulation and flavour positioning to refresh mature franchises.
February 2026, PepsiCo launched Pepsi Prebiotic Cola nationally in the United States following an initial limited release. The product contains 5 grams of sugar and 3 grams of prebiotic fibre and is available in Original Cola and Cherry Vanilla, bringing functional formulation directly into an established cola trademark.
February 2026, poppi entered the United Kingdom, its first international market following PepsiCo’s acquisition of the brand. PepsiCo reported strong U.S. performance for the prebiotic soda and is using its international distribution platform to extend the brand beyond its original market.
February 2026, Coca-Cola launched Coca-Cola Cherry Float and Coca-Cola Zero Sugar Cherry Float and returned Diet Coke Cherry to national distribution in the United States and Canada. The launch combines flavour extensions with parallel full-sugar and zero-sugar formats.
February 2026, Keurig Dr Pepper announced more than 35 new beverage varieties across its portfolio, including Dr Pepper Creamy Coconut, Canada Dry Fruit Splash Strawberry and A&W Root Beer Float. All of its 2026 CSD innovations were planned in regular and zero-sugar formats, reflecting the increasing importance of parallel formulation strategies.
During the second quarter of 2026, Coca-Cola reported 5% volume growth for Trademark Coca-Cola and continued extending Coca-Cola Zero Zero into Asia Pacific and Latin America after stronger European performance. The company also adapted Sprite+Tea for China, showing how large beverage groups increasingly localize innovation rather than use a single global formulation strategy.
Competitive Environment
The carbonated soft drink market remains concentrated around a small number of global trademark owners supported by large bottling networks. The Coca-Cola Company and PepsiCo have the broadest international scale, while Keurig Dr Pepper maintains a particularly strong North American CSD position through Dr Pepper, 7UP, Canada Dry and A&W. Suntory Beverage & Food, Carlsberg through Britvic, A.G. Barr, National Beverage and several regional companies add meaningful competition in individual countries and flavour categories.
Bottling companies are also important competitive participants because manufacturing and route-to-market capability determine physical availability. Coca-Cola FEMSA, Coca-Cola Europacific Partners, Arca Continental, Coca-Cola ?çecek and Swire Coca-Cola operate large franchise territories, while Varun Beverages performs a similar role across a substantial part of PepsiCo’s international bottling network.
Regional brands remain viable where they have strong local distribution and flavour recognition. Reliance Consumer Products is rebuilding Campa in India, Parle Agro operates products such as Appy Fizz, Hamoud Boualem has an established North African position and F&N participates across Southeast Asian soft drinks. The market therefore combines highly concentrated global trademarks with significant local competition at country level.
Carbonated Soft Drink Market Scope:
| Report Metric | Details |
|---|---|
| Total Market Size in 2026 | USD 337.5 billion |
| Total Market Size in 2031 | USD 419.3 billion |
| Forecast Unit | Billion |
| Growth Rate | 4.4% |
| Study Period | 2021 to 2031 |
| Historical Data | 2021 to 2024 |
| Base Year | 2025 |
| Forecast Period | 2026 – 2031 |
| Segmentation | Type, Packaging, Distribution Channel, Geography |
| Companies |
|
Market Segmentation
By Type
Regular
Diet
By Packaging
Bottled
Canned
Soda Fountain
By Distribution Channel
Online
Offline
By Geography
North America
United States
Canada
Mexico
South America
Brazil
Argentina
Others
Europe
Germany
France
United Kingdom
Italy
Others
Middle East and Africa
Saudi Arabia
Israel
Others
Asia Pacific
China
Japan
South Korea
India
Others
Table of Contents
. EXECUTIVE SUMMARY
2. MARKET SNAPSHOT
2.1. Market Overview
2.2. Market Definition
2.3. Scope of the Study
2.4. Market Segmentation
3. BUSINESS LANDSCAPE
3.1. Market Drivers
3.1.1. Expansion of Zero-Sugar Variants Across Established CSD Brands
3.1.2. Entry of Prebiotic and Functional Formulations into Conventional Soda
3.1.3. Higher Frequency of Flavour Extensions and Limited-Edition Products
3.1.4. Greater Use of Smaller Packs and Single-Serve Formats
3.1.5. Expansion of CSD Distribution Across Emerging Consumer Markets
3.2. Market Restraints
3.2.1. Sugar Taxes and Public-Health Measures Affecting Full-Sugar Products
3.2.2. Limited Physical-Volume Growth in Mature CSD Markets
3.2.3. Aluminium, PET, Glass, Energy and Distribution Cost Pressure
3.2.4. Competition from Water, Energy, Sports and Functional Beverages
3.2.5. Packaging Recovery and Recycled-Content Requirements
3.3. Market Opportunities
3.4. Porter's Five Forces Analysis
3.5. Industry Value Chain Analysis
3.6. Policies and Regulations
3.7. Strategic Recommendations
4. TECHNOLOGICAL OUTLOOK
4.1. Reduced- and Zero-Sugar Formulation
4.2. Functional and Prebiotic Carbonated Beverages
4.3. Sweetener Technology
4.4. Sustainable Bottle and Can Packaging
4.5. Fountain Dispensing and Connected Equipment
5. GLOBAL CARBONATED SOFT DRINK MARKET BY TYPE
5.1. Introduction
5.2. Regular
5.3. Diet
6. GLOBAL CARBONATED SOFT DRINK MARKET BY PACKAGING
6.1. Introduction
6.2. Bottled
6.3. Canned
6.4. Soda Fountain
7. GLOBAL CARBONATED SOFT DRINK MARKET BY DISTRIBUTION CHANNEL
7.1. Introduction
7.2. Online
7.3. Offline
8. GLOBAL CARBONATED SOFT DRINK MARKET BY GEOGRAPHY
8.1. Introduction
8.2. North America
8.2.1. By Type
8.2.2. By Packaging
8.2.3. By Distribution Channel
8.2.4. By Country
8.2.4.1. United States
8.2.4.2. Canada
8.2.4.3. Mexico
8.3. South America
8.3.1. By Type
8.3.2. By Packaging
8.3.3. By Distribution Channel
8.3.4. By Country
8.3.4.1. Brazil
8.3.4.2. Argentina
8.3.4.3. Others
8.4. Europe
8.4.1. By Type
8.4.2. By Packaging
8.4.3. By Distribution Channel
8.4.4. By Country
8.4.4.1. Germany
8.4.4.2. France
8.4.4.3. United Kingdom
8.4.4.4. Italy
8.4.4.5. Others
8.5. Middle East and Africa
8.5.1. By Type
8.5.2. By Packaging
8.5.3. By Distribution Channel
8.5.4. By Country
8.5.4.1. Saudi Arabia
8.5.4.2. Israel
8.5.4.3. Others
8.6. Asia Pacific
8.6.1. By Type
8.6.2. By Packaging
8.6.3. By Distribution Channel
8.6.4. By Country
8.6.4.1. China
8.6.4.2. Japan
8.6.4.3. South Korea
8.6.4.4. India
8.6.4.5. Others
9. COMPETITIVE ENVIRONMENT AND ANALYSIS
9.1. Major Players and Strategy Analysis
9.2. Market Share Analysis
9.3. Mergers, Acquisitions, Agreements, and Collaborations
9.4. Competitive Dashboard
10. COMPANY PROFILES
10.1. The Coca-Cola Company
10.2. PepsiCo, Inc.
10.3. Keurig Dr Pepper Inc.
10.4. Suntory Beverage & Food Limited
10.5. Carlsberg A/S
10.6. National Beverage Corp.
10.7. A.G. Barr plc
10.8. Jones Soda Co.
10.9. F&N Foods Pte Ltd
10.10. Refresco Group B.V.
10.11. Coca-Cola FEMSA, S.A.B. de C.V.
10.12. Coca-Cola Europacific Partners plc
10.13. Arca Continental, S.A.B. de C.V.
10.14. Coca-Cola ?çecek A.?.
10.15. Swire Coca-Cola Limited
10.16. Varun Beverages Limited
10.17. Reliance Consumer Products Limited
10.18. Parle Agro Pvt. Ltd.
10.19. Hamoud Boualem S.p.A.
10.20. Sinalco International GmbH & Co. KG
11. APPENDIX
11.1. Currency
11.2. Assumptions
11.3. Base and Forecast Years Timeline
11.4. Key Benefits for Stakeholders
11.5. Research Methodology
11.6. Abbreviations
Navigate
Trusted by the world's leading organizations











