
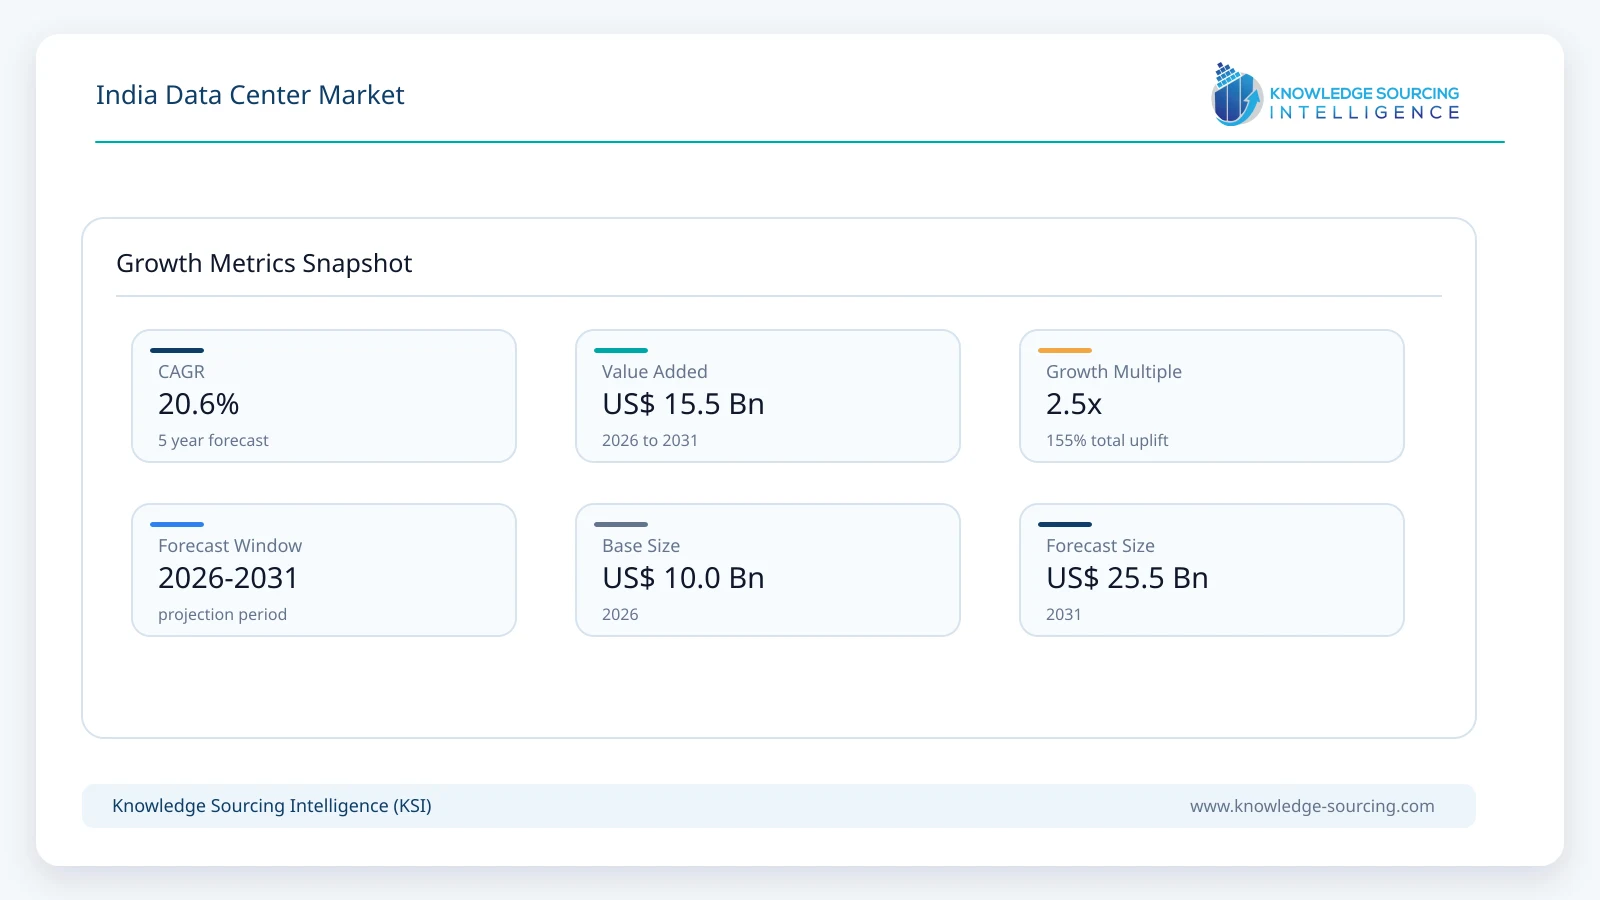
The India data center market is estimated at USD 10.0 billion in 2026 and is projected to reach USD 25.5 billion by 2031, representing a CAGR of 20.6% during 2026–2031.
Highlights:
- 1Installed capacity has increased more than fourfold since 2020.MeitY reports about 1,575 MW in 2026 versus 375 MW in 2020.
- 2Third-party operator revenue remains on a steep growth path.CRISIL expects approximately INR 20,000 crore of annual revenue by fiscal 2028, supported by capacity of about 2.3-2.5 GW.
- 3Hyperscalers account for more than half of third-party capacity tie-ups.Large built-to-suit campuses and long-duration contracts are therefore becoming more important.
- 4Power availability is the highest-rated market restraint.Grid capacity and future MW expansion rights increasingly determine project timing.
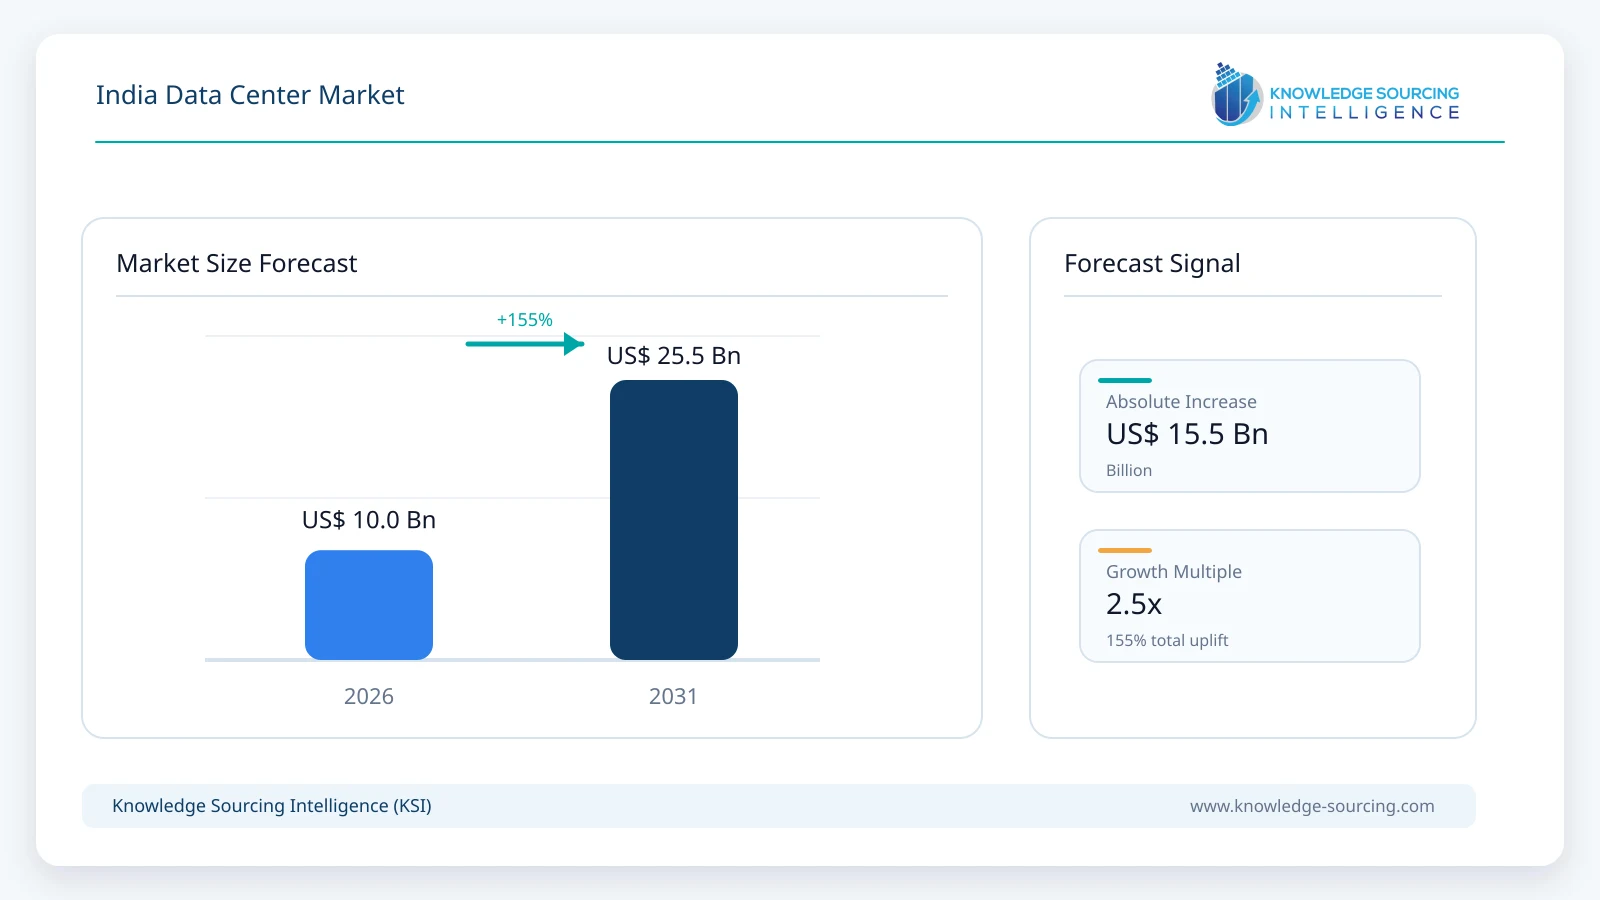
India's data center market is shifting toward hyperscale, AI-ready and high-density infrastructure, with power availability, cooling readiness and interconnection becoming as important as physical floor space.
The India data center market covers annual spending and revenue associated with data-center-specific hardware, software and services supporting facilities located in India. It includes servers, storage, networking, power and cooling systems, facility software, colocation, managed hosting, interconnection, disaster recovery and related infrastructure services. Public-cloud application revenue, SaaS revenue, telecom access revenue and customer application software not directly attributable to data center operations are excluded to avoid double counting.
The Ministry of Electronics and Information Technology reported installed capacity of about 1,575 MW in August 2026, up from 375 MW in 2020. Expansion is also moving beyond established hubs into Andhra Pradesh, Madhya Pradesh, Chhattisgarh and West Bengal. At the same time, AI and high-performance computing are raising rack density and accelerating adoption of direct-to-chip, immersion and other advanced cooling technologies. Source: Press Information Bureau / MeitY.
Market Segmentation Dashboard
Segmentation | Largest segment in 2026 | 2026 share | 2026 Value | Fastest-growing segment, 2026-2031 | CAGR (26-31) |
|---|---|---|---|---|---|
By Component | Hardware | 52% | US$5.2 billion | Services | 23.3% |
By Data Center Type | Colocation | 38% | US$3.8 billion | Hyperscale | 27.0% |
By Tier Level | Tier III | 63% | US$6.3 billion | Tier IV | ~32% |
By Enterprise Size | Large Enterprises | 78% | US$7.8 billion | Small & Medium Enterprises | 25.6% |
By End User | IT, Telecom & Cloud | 35% | US$3.5 billion | IT, Telecom & Cloud | 23.9% |
Analysis of Key Segments
Hardware Leads with an Estimated 52% Share of 2026 Market Value
New capacity requires servers, storage, networking, switchgear, UPS systems, generators, cooling infrastructure, racks and security equipment. CRISIL estimates INR 55,000-65,000 crore of data-center-operator capex across fiscals 2026-2028 and notes that land and buildings represent only about 25-30% of overall capex. Hardware therefore remains the largest component, although services gain share as managed infrastructure, interconnection and operating requirements expand. Source: CRISIL Ratings.
Colocation Accounts for an Estimated 38% of 2026 Market Value
Colocation remains the largest modeled facility type because enterprises and cloud customers can access resilient power, connectivity, security and expansion capacity without owning the complete facility stack. CRISIL's analysis of operators representing 75-80% of India's operational third-party capacity projects operator revenue of about INR 20,000 crore by fiscal 2028. Hyperscale is modeled as the fastest-growing type at about 27.0% CAGR; CRISIL reports that hyperscalers already represent more than half of third-party capacity tie-ups. Source: CRISIL Ratings.
Tier III Remains the Largest Tier; Tier IV Gains Share Fastest
Tier III remains predominant because concurrently maintainable infrastructure offers a strong balance between availability and cost for enterprise and colocation workloads. Uptime Institute's India awards database shows a broad base of Tier III-certified facilities, while Tier IV adoption is increasing for AI, financial services and other mission-critical workloads. The approximately 32% modeled Tier IV CAGR is an analytical estimate derived from the 2026 and 2031 market model, not a published industry statistic. Source: Uptime Institute.
Large Enterprises Represent an Estimated 78% of 2026 Market Value
Large enterprises account for the majority of modeled demand because banks, telecom operators, digital platforms, manufacturers, government-linked organizations and large technology companies consume substantially more compute, storage, security and resilience capacity per customer. They also have stronger requirements for multi-site disaster recovery, private connectivity and long-term reserved capacity. Small and medium enterprises start from a smaller value base but are modeled to grow faster at approximately 25.6% CAGR as managed infrastructure, cloud-connected colocation and consumption-based services reduce the need for customers to own dedicated facilities.
IT, Telecom and Cloud Form the Largest End-User Group
IT, telecom and cloud workloads are estimated to represent approximately 35% of 2026 market value. This group combines hyperscale cloud infrastructure, network-intensive digital services, SaaS platforms, AI workloads and technology-company demand. It is also modeled as the fastest-growing end-user group at about 23.9% CAGR through 2031. BFSI remains another major demand pool because payment systems, digital banking, cybersecurity and business-continuity requirements support high-value resilient infrastructure, while retail, government, healthcare and manufacturing contribute a broader diversification of workloads.
Market Drivers and Restraints
Market factor | Direction | Impact | Time horizon | Most exposed segments | Evidence confidence |
|---|---|---|---|---|---|
AI and high-performance computing | Driver | 5/5 - Very High | 2026-2031 | Hyperscale, colocation, hardware | High |
Cloud migration and infrastructure outsourcing | Driver | 5/5 - Very High | 2026-2031 | Colocation, services | High |
Government digital and AI infrastructure programmes | Driver | 4/5 - High | Medium-long term | Cloud, hyperscale, government workloads | High |
Power availability and grid interconnection | Restraint | 5/5 - Very High | 2026-2031 | Hyperscale, Tier IV, large campuses | High |
Capital intensity and commissioning complexity | Restraint | 4/5 - High | 2026-2031 | Hyperscale, large greenfield projects | High |
Impact scale: 1/5 indicates a limited effect, 3/5 (significant effect on major segments), and 5/5 (major effect which will be felt across the industry)
AI Is Changing the Economics of New Capacity
AI increases requirements for substations, high-speed networking, high-density power distribution and advanced cooling. MeitY states that Indian facilities are adopting direct-to-chip liquid cooling, adiabatic cooling, immersion cooling and high-density racks for AI and HPC. Yotta's February 2026 announcement of 20,736 NVIDIA Blackwell Ultra GPUs, backed by more than US$2 billion of investment, illustrates the scale of this infrastructure shift. Source: Yotta Data Services.
Cloud Migration Keeps Third-Party Infrastructure Demand Strong
Enterprise architecture increasingly combines public cloud, private infrastructure and carrier-neutral colocation. Sify reports 14 operating data centers with 188 MW of live capacity, while STT GDC India reports about 400 MW across 30 facilities including projects under construction. The value proposition now centres on resilient power, interconnection, cloud access, security and scalability rather than rack rental alone.
Power Availability Is the Primary Physical Constraint
Large campuses require dependable multi-megawatt grid connections, redundancy and long-term access to additional power. AI makes the constraint more acute because compute density can increase MW requirements faster than building footprint. Grid interconnection and substation readiness can therefore determine commissioning schedules even where land and demand are available.
Capital Requirements Favour Large Platforms
Nxtra announced a US$1 billion investment round in March 2026 and stated that its roughly 300 MW portfolio is intended to scale to 1 GW. CtrlS announced up to INR 7,000 crore of investment from CPP Investments in June 2026. These transactions show that access to long-duration institutional capital is becoming a competitive advantage alongside technical capability.
Geographic Intelligence
Government data confirms that capacity remains concentrated in a small group of metropolitan hubs, while newer states are beginning to attract projects.
Major hub | Operational capacity reported by MeitY, March 2026 | Market position | Strategic reason |
|---|---|---|---|
Mumbai / Navi Mumbai | 790 MW | Largest hub | Submarine cables, financial services, operator density, interconnection |
Chennai | 305 MW | Second-largest hub | Subsea connectivity, land availability, hyperscale campuses |
Bengaluru | 182 MW | Technology-demand hub | Cloud, SaaS, enterprise and AI workloads |
Hyderabad | 152 MW | Fast-expanding major hub | Large campuses, state support, cloud and AI investment |
Delhi NCR / Noida | 76 MW | Northern enterprise/government hub | Government, enterprise, telecom and disaster-recovery demand |
Source: Press Information Bureau / MeitY, March 2026
Competitive Intelligence
Operator | Current disclosed position | Strategic signal |
|---|---|---|
STT GDC India | 30 facilities across 10 cities; ~400 MW IT load including projects under construction | Pan-India scale and enterprise/hyperscale customer base |
Nxtra by Airtel | ~300 MW current capacity; target of ~1 GW | Telecom-linked connectivity and AI-ready expansion |
CtrlS | More than 200 MW operating capacity; multi-gigawatt development ambitions | Rated-4 facilities, hyperscale campuses and power-led expansion |
Sify Technologies | 14 operating data centers; 188 MW live capacity | Colocation plus network, cloud and managed services |
AdaniConneX | 65.4 MW operational; 960+ MW cumulative tied-up capacity | Energy-integrated hyperscale development |
Yotta Data Services | 60 MW Greater Noida D2 facility scalable to 250 MW | Sovereign cloud and high-density GPU infrastructure |
Competitive differentiation increasingly depends on secured power, commissioning speed, high-density workload support and network depth rather than facility count alone.
Recent Developments and Market Impact
Development | Date | Market implication |
|---|---|---|
AdaniConneX secures a new 400 MW hyperscale order | July 2026 | Takes cumulative tied-up capacity above 960 MW and shows how single hyperscale commitments can shape development pipelines. |
CtrlS receives up to INR 7,000 crore commitment from CPP Investments | June 2026 | Supports larger hyperscale campuses and infrastructure-scale financing. |
Nxtra announces US$1 billion investment round | March 2026 | Accelerates expansion from roughly 300 MW toward a stated 1 GW ambition. |
Yotta announces 20,736 NVIDIA Blackwell Ultra GPUs | February 2026 | Raises demand for liquid cooling, high-density rack design and dedicated power. |
Regulatory and Policy Environment
India's Digital Personal Data Protection Act does not impose a universal requirement that all personal data remain in India. Section 16 enables the Central Government to restrict transfers to specified countries or territories, while sector-specific rules may be stricter. Domestic infrastructure demand is therefore supported by governance, security, resilience, latency and sector regulation rather than a blanket localization rule. MeitY also reported more than 38,000 GPUs onboarded through empanelled service providers under the national AI compute framework by March 2026. Source: MeitY.
Key Market Questions Answered
Which data center segment is largest in India?
Colocation is the largest modeled data-center-type segment at approximately 38% of 2026 market value. Enterprises and cloud customers use it to access resilient power, connectivity, security and expansion capacity without owning the full facility stack.
Which data center type is growing fastest?
Hyperscale infrastructure is modeled to grow at approximately 27.0% CAGR during 2026-2031. CRISIL reports that hyperscalers already account for more than half of third-party capacity tie-ups, while new built-to-suit commitments are increasingly measured in hundreds of megawatts.
Is Tier IV replacing Tier III?
No. Tier III remains the largest tier, but Tier IV is gaining share faster. Tier III meets the needs of a broad enterprise and colocation base, while Tier IV demand rises where downtime costs are especially high.
Why is Mumbai still India's largest data center hub?
Mumbai combines the country's largest operating capacity with submarine-cable access, financial-services demand and a dense interconnection ecosystem. MeitY reported about 790 MW across Mumbai and Navi Mumbai in March 2026.
Which location is gaining strategic importance fastest?
Hyderabad is one of the strongest emerging large-scale hubs. Its smaller current base, large campus announcements, state support and cloud/AI investment create substantial room for capacity expansion.
What is the biggest constraint on new capacity?
Securing reliable, scalable power is the principal physical constraint. Customers increasingly require guaranteed MW capacity and future expansion rights, making grid interconnection and substation readiness central to project timing.
What should an enterprise evaluate when selecting a colocation provider?
Buyers should compare guaranteed power, utility interconnection timelines, future MW expansion rights, supported rack density, liquid-cooling readiness, UE/WUE performance, and utility-price treatment among other relevant factors.
Analyst View
Power is becoming the real unit of competitive capacity. For AI-heavy deployments, secured megawatts can matter more than headline square footage.
The market is becoming more service-intensive even while hardware remains largest. Interconnection, managed infrastructure and cloud connectivity create recurring value around the physical asset base.
Hyperscalers will influence economics disproportionately. Their contracts improve utilization visibility but also increase bargaining power and financing requirements.
Geographic expansion will follow power and connectivity rather than population alone. Mumbai retains structural advantages, while Hyderabad, Chennai and new state-level destinations can gain share.
Research and Estimation Approach
The market model uses an evidence-first volume-and-value framework. Installed IT capacity is the principal volume indicator, while operator revenue, project capex, customer tie-ups and equipment/service intensity provide the value bridge. Core data facts comes from MeitY/PIB, CRISIL and company disclosures.
The market estimates are developed through a triangulated evidence framework combining installed and planned data center capacity, operator revenue and investment disclosures, project commissioning schedules, utilization trends, and the demand for different data center services. Segment shares are analyzed independently using segment-specific indicators, while growth rates are calculated from the resulting annual market trajectories.
India Data Center Market Scope
| Report Metric | Details |
|---|---|
| Total Market Size in 2026 | USD 10.0 billion |
| Total Market Size in 2031 | USD 25.5 billion |
| Forecast Unit | Billion |
| Growth Rate | 20.6% |
| Study Period | 2021 to 2031 |
| Historical Data | 2021 to 2024 |
| Base Year | 2025 |
| Forecast Period | 2026 – 2031 |
| Segmentation | Component, Data Center Type, Tier Level, Enterprise Size, End User, Region |
| Companies |
|
The study covers the India data center market by component, data center type, tier level, enterprise size, end user and region for 2021-2031. Detailed annual values, complete segment and subsegment shares, company analysis, assumptions, scenarios and supporting datasets remain part of the full report. Revenue estimates represent data-center-specific infrastructure hardware, software and services associated with India-based facilities.
Market Segmentation
By Component
By Data Center Type
By Tier Level
By Enterprise Size
By End User
By Region
Table of Contents
1. EXECUTIVE SUMMARY
2. MARKET SNAPSHOT
2.1. Market Overview
2.2. Market Definition
2.3. Scope of the Study
2.4. Market Segmentation
3. BUSINESS LANDSCAPE
3.1. Market Drivers
3.2. Market Restraints
3.3. Market Opportunities
3.4. Porter’s Five Forces Analysis
3.5. Industry Value Chain Analysis
3.6. Policies and Regulations
3.7. Strategic Recommendations
4. TECHNOLOGICAL OUTLOOK
5. INDIA DATA CENTER MARKET BY COMPONENT
5.1. Introduction
5.2. Hardware
5.2.1. Servers
5.2.2. Network Infrastructure
5.2.3. Storage Infrastructure
5.2.4. Power Infrastructure
5.2.5. Cooling Infrastructure
5.2.6. Cabling Infrastructure
5.2.7. Physical Security Infrastructure
5.3. Software and Services
6. INDIA DATA CENTER MARKET BY DATA CENTER TYPE
6.1. Introduction
6.2. Colocation Data Center
6.3. Enterprise Data Center
6.4. Hyperscale Data Center
6.5. Edge Data Center
6.6. Micro Data Center
7. INDIA DATA CENTER MARKET BY TIER LEVEL
7.1. Introduction
7.2. Tier I
7.3. Tier II
7.4. Tier III
7.5. Tier IV
8. INDIA DATA CENTER MARKET BY ENTERPRISE SIZE
8.1. Introduction
8.2. Large Enterprises
8.3. Small and Medium Enterprises (SMEs)
9. INDIA DATA CENTER MARKET BY END USER
9.1. Introduction
9.2. IT & Telecommunications
9.3. Banking, Financial Services, and Insurance (BFSI)
9.4. Government and Public Sector
9.5. Healthcare and Life Sciences
9.6. Retail and E-commerce
9.7. Manufacturing
9.8. Energy and Utilities
9.9. Media and Entertainment
9.10. Others
10. INDIA DATA CENTER MARKET BY REGION
10.1. Introduction
10.2. Maharashtra
10.3. Tamil Nadu
10.4. Telangana
10.5. Karnataka
10.6. Uttar Pradesh
10.7. Others
11. COMPETITIVE ENVIRONMENT AND ANALYSIS
11.1. Major Players and Strategy Analysis
11.2. Market Share Analysis
11.3. Mergers, Acquisitions, Agreements, and Collaborations
11.4. Competitive Dashboard
12. COMPANY PROFILES
12.1. Nxtra Data Limited
12.2. Yotta Data Services Private Limited
12.3. CtrlS Datacenters Ltd.
12.4. Reliance Jio Infocomm Limited
12.5. Equinix, Inc.
12.6. ST Telemedia Global Data Centres (India)
12.7. Sify Technologies Limited
12.8. Iron Mountain Data Centers
12.9. ESDS Software Solution Limited
12.10. Microsoft Corporation
12.11. Oracle Corporation
12.12. AdaniConneX Private Limited
12.13. NTT Global Data Centers
13. APPENDIX
13.1. Currency
13.2. Assumptions
13.3. Base and Forecast Years Timeline
13.4. Key Benefits for Stakeholders
13.5. Research Methodology
13.6. Abbreviations
LIST OF FIGURES
LIST OF TABLES
Navigate
Trusted by the world's leading organizations











