Renewable Energy Market - Strategic Insights and Forecasts (2026-2031)
Renewable Energy Market Share, Growth, Forecasts and Industry Trends By Technology (Solar Photovoltaic, Onshore Wind, Offshore Wind, Hydropower, Bioenergy, Geothermal, Others), Project Scale (Utility Scale, Commercial and Industrial Distributed, Residential Distributed), End-User (Utilities and Independent Power Producers, Commercial and Industrial Buyers, Residential Users), and Geography
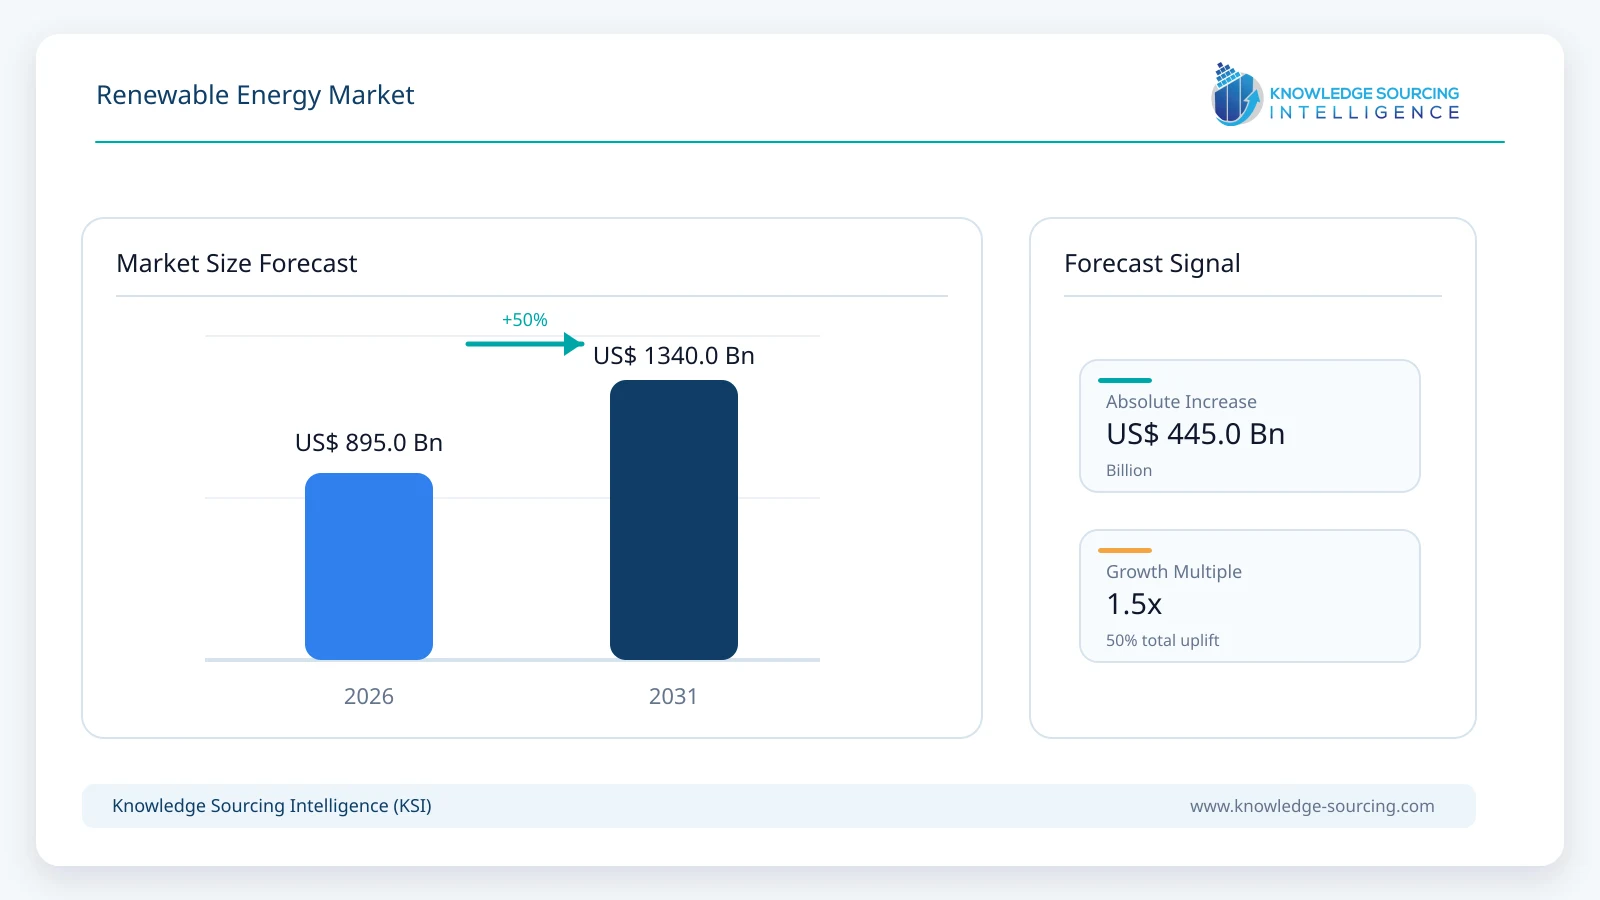
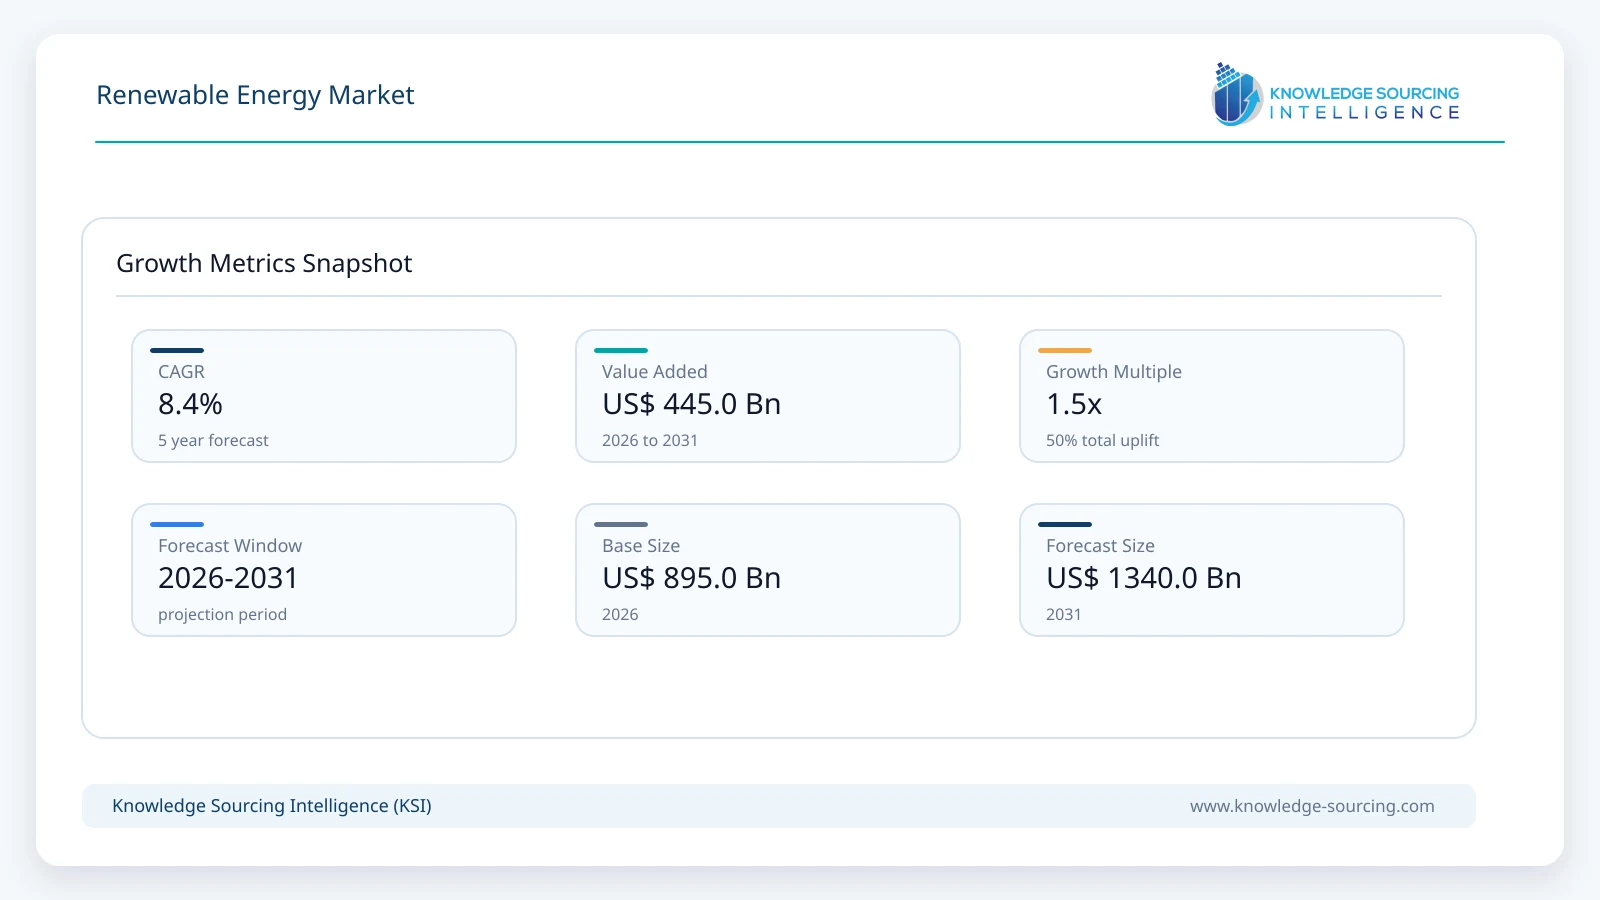
The renewable energy market is estimated at USD 895.0 billion in 2026 and is projected to reach USD 1,340.0 billion by 2031, at a CAGR of 8.4% during the forecast period.
Highlights:
1
Solar photovoltaic projects account for approximately 58% of global renewable deployment value in 2026.
2
Offshore wind is projected to grow at approximately 11.2% annually through 2031.
3
Utility-scale projects generate about USD 653 billion of global market value in 2026.
4
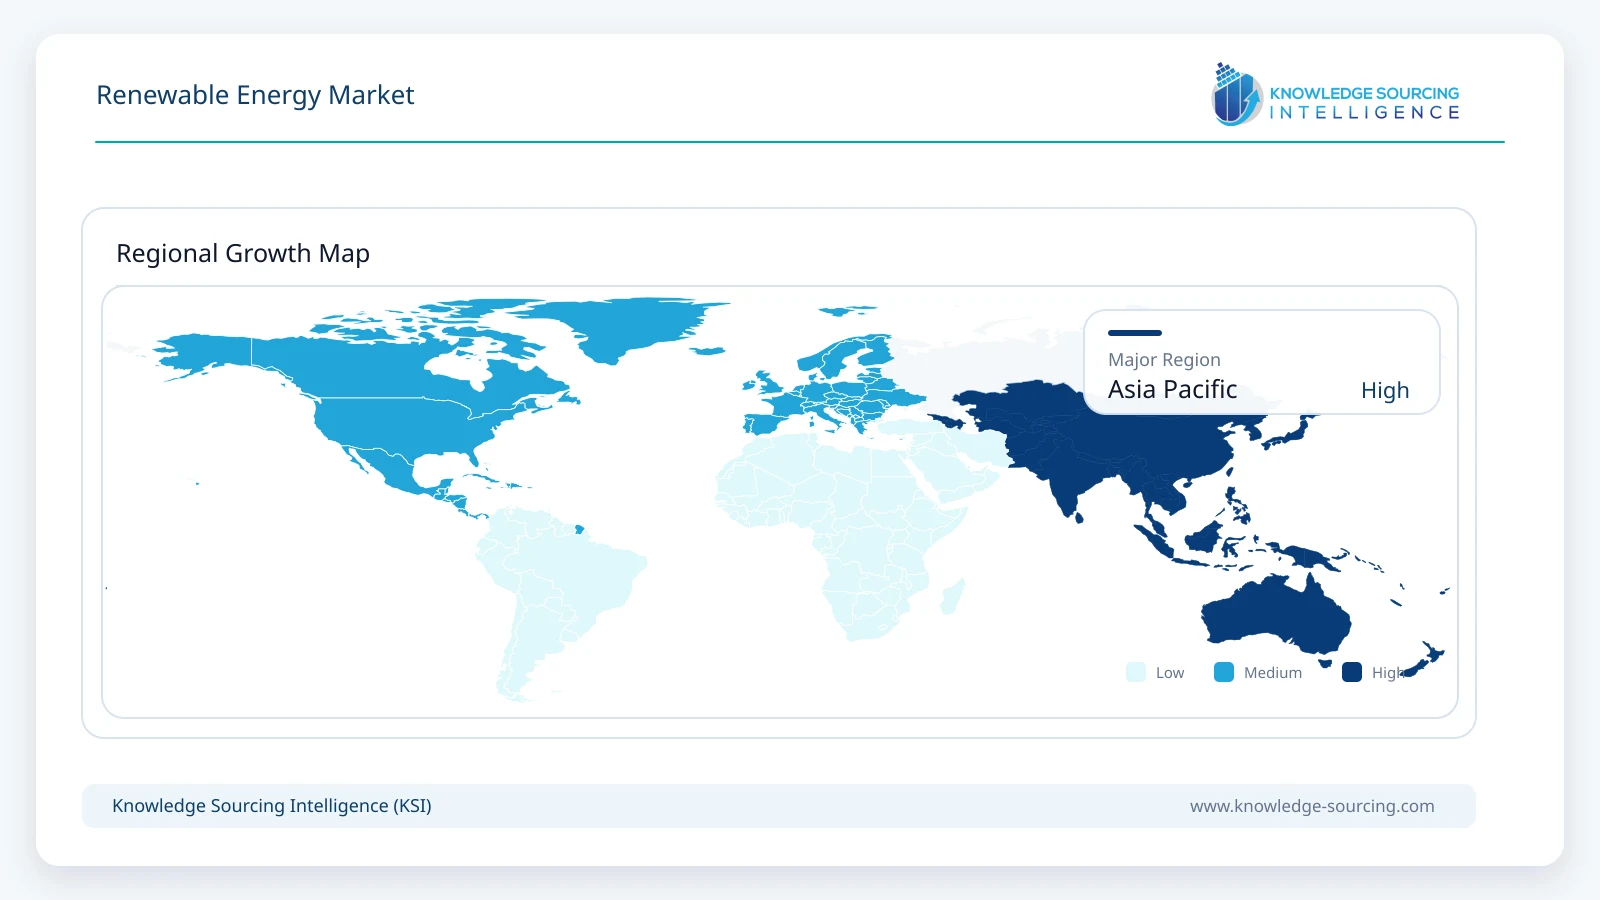
Asia Pacific represents approximately 52% of global renewable energy market value in 2026.
5
Grid availability is becoming as important as generation cost in project development decisions.
6
Corporate buyers increasingly use long-term power contracts to secure renewable electricity supply.
Renewable power development is now dominated by solar and wind, but the commercial structure differs sharply by technology. Solar projects can be developed at distributed, commercial and utility scales and generally have shorter construction cycles. Onshore wind requires larger sites, grid studies and transport logistics. Offshore wind has materially higher capital intensity and longer development cycles but can provide large blocks of generation close to coastal demand centers. Hydropower remains the largest installed renewable technology in many countries, although growth is slower because suitable sites and permitting requirements limit new development.
The market is also moving from standalone generation toward integrated project design. Developers increasingly combine renewable generation with storage, transmission upgrades, flexible demand or co-located industrial loads even when storage itself is outside the market total. This reflects a shift in value creation. The cheapest generation technology does not necessarily create the most valuable project if it cannot secure a timely grid connection or deliver power when the system needs it. Project developers therefore compete on land access, interconnection rights, financing, procurement, construction execution and long-term offtake as much as on equipment cost.
Market Trends
Solar continues to dominate new renewable capacity additions
Solar photovoltaic technology accounted for nearly three-quarters of renewable capacity added globally in 2025. Its growth is supported by modular construction, short development cycles and a diversified application base ranging from rooftops to gigawatt-scale projects. The International Energy Agency expects solar PV to remain the main source of renewable expansion through 2030. Utility-scale solar is also being paired more frequently with storage and flexible grid connections, which can improve project value in markets with midday oversupply or transmission constraints.
Offshore wind is entering a more disciplined investment phase
Offshore wind remains strategically important, but the market is becoming more selective after several years of cost inflation and project repricing. Developers are concentrating capital on projects with clearer revenue frameworks, stronger supply chains and better grid visibility. Ørsted brought the 913 MW Borkum Riffgrund 3 project into commercial operation in August 2026, while RWE began monopile installation at the 795 MW OranjeWind project in September 2026. The technology continues to offer large project scale, but financing, turbine availability and construction risk remain more significant than in onshore renewables.
Renewable projects are being designed around grid constraints rather than generation alone
Grid congestion is now a central commercial issue in high-renewable markets. Developers increasingly evaluate curtailment risk, connection timing, redispatch exposure and the ability to add storage or flexible demand before committing capital. RWE took a final investment decision in September 2026 on a 400 MW battery in the Netherlands partly to improve renewable system integration around its offshore portfolio. Storage is excluded from the renewable generation market total, but projects of this type materially influence the economics and timing of renewable investment.
Market Drivers
Electricity demand growth is increasing the need for new generation capacity
Electricity demand is rising as data centers, industrial electrification, electric transport and cooling loads expand. Renewable energy is positioned to capture a large share of new capacity because solar and wind projects can often be developed faster than conventional large-scale generation. The IEA expects renewables to maintain strong growth through 2030 and solar PV to account for the largest share of additions. This broad demand environment supports project pipelines even as individual markets face policy or interconnection constraints.
Project economics remain competitive across major solar and onshore wind markets
Equipment cost reductions, standardized project design and larger supply chains have improved renewable economics over the past decade. Solar modules and inverters can be procured at global scale, while onshore wind benefits from larger turbines and higher capacity factors. Developers increasingly compete on financing and grid access rather than pure generation cost. Renewable projects also provide long-term fuel-cost certainty because solar and wind have no commodity fuel input, which remains attractive to utilities and corporate buyers managing exposure to volatile energy prices.
Corporate procurement and industrial decarbonization broaden the buyer base
Large technology companies, manufacturers and industrial users are increasingly contracting directly for renewable electricity through power purchase agreements and related structures. This creates demand outside traditional utility procurement. New projects can be linked to data centers, hydrogen facilities, mining operations, semiconductor plants and other electricity-intensive loads. The ability to secure a high-quality corporate offtaker can improve financing and accelerate investment, particularly in markets where merchant power prices are volatile.
Market Restraint
Grid access, permitting and financing can delay otherwise economic projects
The largest constraint is increasingly the ability to connect projects rather than the cost of generating renewable electricity. Transmission systems in many regions were not designed for the volume and location of new renewable capacity now entering development. Interconnection queues can extend for years, while local permitting and environmental reviews can slow project schedules. Higher interest rates also affect capital-intensive technologies such as offshore wind and hydropower more strongly than modular solar. These constraints can shift market value between countries even when underlying resource quality remains attractive.
Segment Analysis
By Technology - Solar Photovoltaic
Solar photovoltaic generation is the largest technology segment because it combines the highest annual deployment volume with applications ranging from residential rooftops to multi-gigawatt utility projects. The segment is projected to reach approximately USD 790 billion in annual market value by 2031. Growth is supported by continued module-cost improvements, shorter construction cycles and strong deployment in China, the United States, India, Europe and the Middle East. Utility-scale solar remains the main value pool, while distributed systems broaden demand across commercial and residential users.
By Project Scale - Utility Scale
Utility-scale renewable projects remain the largest project-scale segment because most new wind, hydropower, geothermal and large solar capacity is developed through centralized projects. The segment is projected to grow at approximately 8.1% annually through 2031. Large projects benefit from lower procurement and financing costs but face greater exposure to permitting, grid connection and land constraints. Distributed renewable generation grows faster in selected markets where retail electricity prices are high and rooftop economics are attractive.
By End User - Utilities and Independent Power Producers
Utilities and independent power producers form the largest buyer and developer group because they own or contract most utility-scale renewable generation. The segment accounts for approximately 68% of global market value in 2026. Their investment decisions are increasingly influenced by long-term power contracts, grid access and portfolio diversification rather than isolated project returns. Corporate and industrial buyers are expanding their role through direct procurement, but utilities and independent developers remain central to project development, financing and operation.
By Geography - Asia Pacific
Asia Pacific is the largest regional renewable energy market because it combines the world’s largest solar and wind deployment programs with major equipment manufacturing capacity. Regional market value is projected to reach approximately USD 720 billion by 2031. China remains the dominant market, while India is expanding solar and wind auctions and Southeast Asia is increasing renewable procurement. Japan, South Korea and Australia maintain strong demand for distributed generation, corporate procurement and selected offshore wind projects.
Competitive Environment
The renewable energy market includes project developers, integrated utilities and technology suppliers. NextEra Energy Resources, Iberdrola, Enel, RWE, Ørsted and Brookfield Renewable are major developers and owners across multiple markets. Their competitive advantages include project pipelines, interconnection positions, financing access and the ability to operate large portfolios. Iberdrola reported 56.6 GW of generation capacity in the first half of 2026, while Ørsted had more than 18 GW of installed renewable capacity across its portfolio.
Technology suppliers form a separate but closely linked competitive layer. Vestas and Goldwind are major wind-turbine suppliers, while First Solar, LONGi, JinkoSolar, Trina Solar and Canadian Solar are important in solar equipment and project supply chains. Equipment pricing remains competitive, but developers increasingly value bankability, warranty support, local manufacturing and delivery certainty. Supply-chain localization is becoming more important as governments use industrial policy to support domestic manufacturing.
Competition is therefore shifting from simple capacity growth toward portfolio quality. Companies with contracted revenue, strong grid positions and disciplined project selection are better placed to manage financing and construction risk. Offshore wind developers are becoming more selective, while solar developers are moving faster into markets where grid access and offtake can be secured. The market remains fragmented globally even though a relatively small group of companies participates across multiple regions and technologies.
Recent Developments
September 2026: RWE installed the first monopile at the 795 MW OranjeWind offshore wind project in the Netherlands.
September 2026: Enel closed the acquisition of an 810 MW portfolio of solar plants in the United States.
September 2026: Vestas announced new wind-turbine orders in Germany and Italy, extending its third-quarter 2026 order intake.
August 2026: Ørsted brought the 913 MW Borkum Riffgrund 3 offshore wind farm in Germany into commercial operation.
August 2026: Ørsted reported continued progress across its 8.1 GW renewable construction portfolio.
First Half 2026: Iberdrola increased generation capacity to 56,599 MW, with offshore wind showing the fastest capacity growth.
March 2026: IRENA reported a record 692 GW of global renewable capacity additions during 2025.
Renewable Energy Market Scope:
Report Metric
Details
Total Market Size in 2026
USD 895.0 billion
Total Market Size in 2031
USD 1,340.0 billion
Forecast Unit
Billion
Growth Rate
8.4%
Study Period
2021 to 2031
Historical Data
2021 to 2024
Base Year
2025
Forecast Period
2026 – 2031
Segmentation
Technology, Project Scale, End-User, Geography
Companies
NextEra Energy Resources
Iberdrola S.A.
Enel S.p.A.
RWE AG
Orsted A/S
Market Segmentation
By Technology
Solar Photovoltaic
Onshore Wind
Offshore Wind
Hydropower
Bioenergy
Geothermal
Others
By Project Scale
Utility Scale
Commercial and Industrial Distributed
Residential Distributed
By End User
Utilities and Independent Power Producers
Commercial and Industrial Buyers
Residential Users
By Geography
North America
United States
Canada
Mexico
South America
Brazil
Chile
Argentina
Others
Europe
Germany
United Kingdom
Spain
France
Italy
Others
Middle East and Africa
Saudi Arabia
UAE
South Africa
Others
Asia Pacific
China
India
Japan
South Korea
Australia
Indonesia
Others
Table of Contents
1. EXECUTIVE SUMMARY
2. MARKET SNAPSHOT
2.1. Market Overview
2.2. Market Definition
2.3. Market Segmentation
3. BUSINESS LANDSCAPE
3.1. Market Drivers
3.1.1. Electricity Demand Growth is Increasing the Need for New Generation Capacity
3.1.2. Project Economics Remain Competitive Across Major Solar and Onshore Wind Markets
3.1.3. Corporate Procurement and Industrial Decarbonization Broaden the Buyer Base
3.2. Market Restraint
3.2.1. Grid Access, Permitting and Financing Can Delay Otherwise Economic Projects
3.3. Market Opportunities
3.4. Porter's Five Forces Analysis
3.5. Industry Value Chain Analysis
3.6. Policies and Regulations
3.7. Strategic Recommendations
4. TECHNOLOGICAL OUTLOOK
4.1. Utility-Scale Solar PV
4.2. Onshore Wind
4.3. Offshore Wind
4.4. Hydropower and Pumped Hydro
4.5. Bioenergy and Geothermal
4.6. Hybrid Renewable Project Design
5. RENEWABLE ENERGY MARKET BY TECHNOLOGY
5.1. Introduction
5.2. Solar Photovoltaic
5.3. Onshore Wind
5.4. Offshore Wind
5.5. Hydropower
5.6. Bioenergy
5.7. Geothermal
5.8. Others
6. RENEWABLE ENERGY MARKET BY PROJECT SCALE
6.1. Introduction
6.2. Utility Scale
6.3. Commercial and Industrial Distributed
6.4. Residential Distributed
7. RENEWABLE ENERGY MARKET BY END USER
7.1. Introduction
7.2. Utilities and Independent Power Producers
7.3. Commercial and Industrial Buyers
7.4. Residential Users
8. RENEWABLE ENERGY MARKET BY GEOGRAPHY
8.1. Introduction
8.2. North America
8.2.1. United States
8.2.2. Canada
8.2.3. Mexico
8.3. South America
8.3.1. Brazil
8.3.2. Chile
8.3.3. Argentina
8.3.4. Others
8.4. Europe
8.4.1. Germany
8.4.2. United Kingdom
8.4.3. Spain
8.4.4. France
8.4.5. Italy
8.4.6. Others
8.5. Middle East and Africa
8.5.1. Saudi Arabia
8.5.2. UAE
8.5.3. South Africa
8.5.4. Others
8.6. Asia Pacific
8.6.1. China
8.6.2. India
8.6.3. Japan
8.6.4. South Korea
8.6.5. Australia
8.6.6. Indonesia
8.6.7. Others
9. COMPETITIVE ENVIRONMENT AND ANALYSIS
9.1. Major Players and Strategy Analysis
9.2. Market Share Analysis
9.3. Technology and Portfolio Positioning
9.4. Mergers, Acquisitions, Agreements and Collaborations