
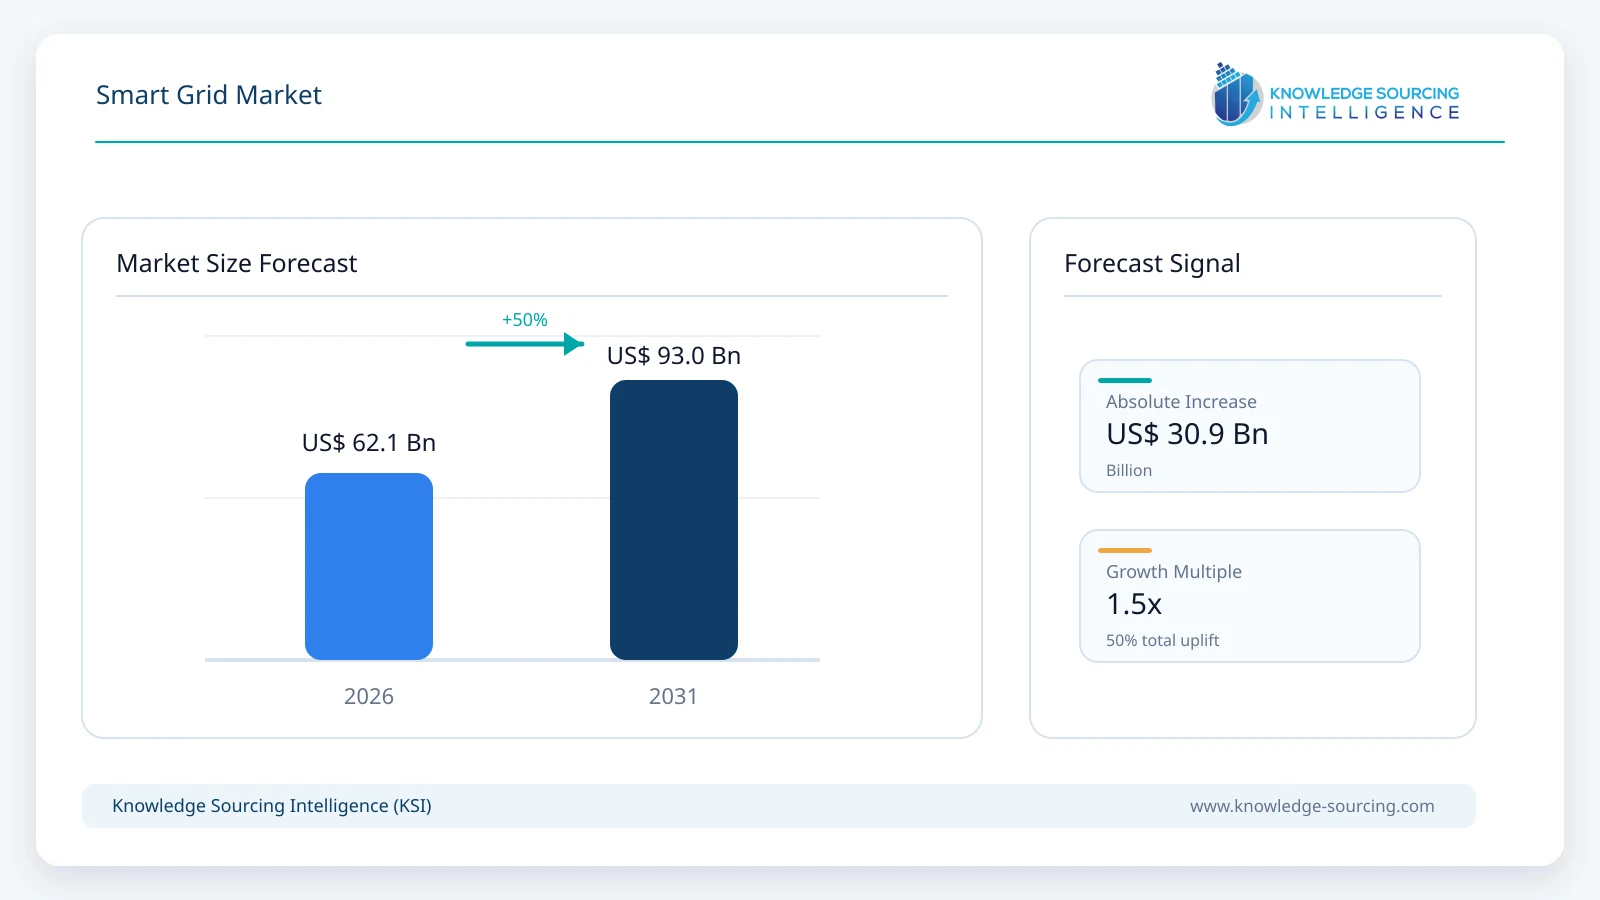
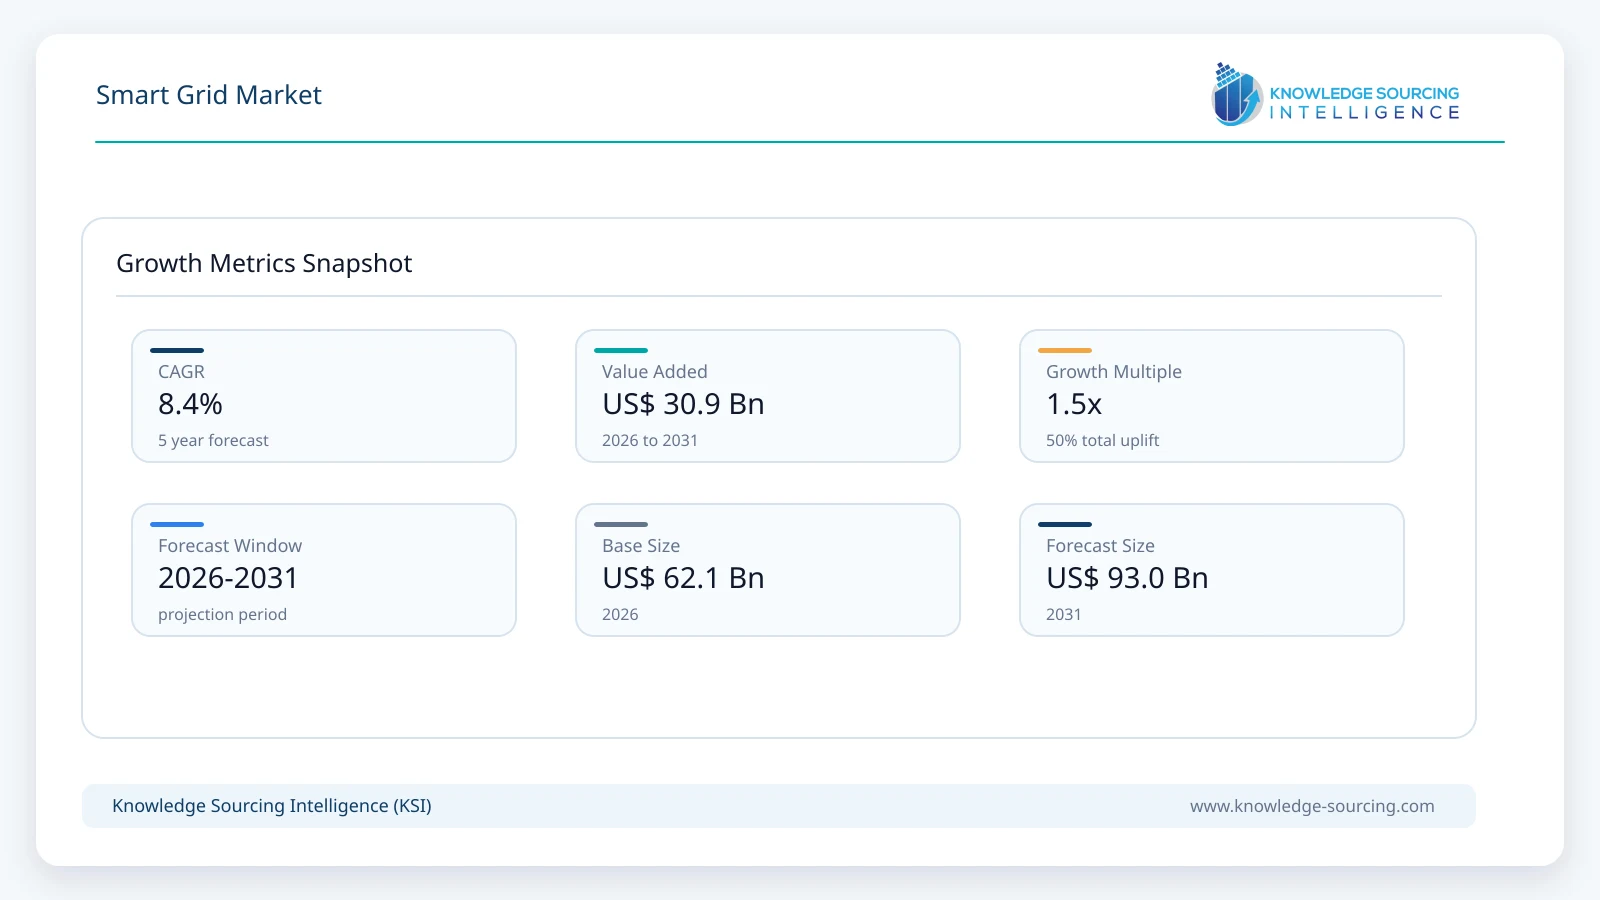
The smart grid market is forecast to grow at a CAGR of 8.4%, reaching USD 93.0 billion in 2031 from USD 62.1 billion in 2026.
Highlights:
- 1Hardware accounts for approximately 46% of global smart grid revenue in 2026.
- 2Wireless smart-grid connectivity is projected to grow at approximately 10.0% annually through 2031.
- 3Distribution applications account for approximately 41% of global smart grid revenue in 2026.
- 4Asia Pacific contributes approximately 36% of global smart grid revenue in 2026.
- 5Grid-edge intelligence is extending AMI from billing infrastructure into operational network control.
Smart grid spending spans hardware, software and services used to improve visibility, control, automation, reliability and flexibility across power networks. Hardware includes smart meters, sensors, communications equipment, protection and control devices and other intelligent grid-edge equipment. Software covers AMI platforms, advanced distribution management, network management, asset management, substation automation, cybersecurity, DERMS and related analytics. Deployment, integration, consulting and support services form the third commercial layer because utilities must connect these systems with legacy operational technology, enterprise applications and field assets that can remain in service for decades.
The 2026 market is being shaped by a much larger underlying grid investment cycle. GE Vernova reported USD 6.62 billion of Grid Solutions revenue in 2025 and USD 973 million from Electrification Software, while its Electrification equipment backlog rose sharply. Landis+Gyr reported USD 1.17 billion of FY2025 continuing-operations revenue and a committed backlog approaching USD 3.9 billion after refocusing on grid-edge intelligence. Schneider Electric reported double-digit growth in digital services for grid customers during 2025, and Hitachi Energy India closed FY2026 with a substantially larger order backlog supported by transmission, SCADA upgrades and grid-connection work. These figures include products beyond the strict smart-grid scope, but collectively show the scale of utility digitalization, automation and intelligent-grid investment supporting the market estimate.
Market Trends
Grid software is converging into orchestration platforms
Utilities historically deployed energy management, distribution management, outage management, DER management, forecasting and planning tools as separate systems. The current product direction is toward common data layers and coordinated operating environments that can use real-time network states, forecasts and asset information across transmission and distribution. GE Vernova introduced GridOS for Transmission in June 2026 as a unified environment combining transmission operations, dynamic capacity awareness, forecasting and system-stability intelligence. Siemens is extending Gridscale X with agentic transmission-planning capabilities and a shared digital foundation, while Schneider Electric is integrating ADMS, GIS, transmission operations and external risk intelligence through its One Digital Grid approach. The commercial implication is a shift from point-solution procurement toward platform architectures with higher software and lifecycle-service content.
AMI is evolving into grid-edge intelligence rather than remaining a metering system
Advanced metering infrastructure increasingly serves as a distributed sensing and communications layer for the wider grid. Utilities are using meter and endpoint data for outage detection, voltage optimization, transformer loading, DER identification, demand flexibility and local network visibility. Itron is positioning its AMI and distributed-intelligence portfolio around grid-edge applications and DER coordination, Landis+Gyr is expanding its Revelo edge ecosystem, and Hubbell is adding analytics around Aclara grid-edge devices. This extends the economic value of meter deployments beyond automated billing and creates recurring opportunities in analytics, communications, device applications and managed services. It also raises interoperability requirements because utilities increasingly expect meter networks to support multiple applications over long asset lifecycles.
Market Drivers
Electrification and renewable integration are forcing utilities to unlock additional grid capacity
Electricity networks are under simultaneous pressure from renewable generation, battery storage, electric vehicles, heat pumps, industrial electrification and data-center demand. The IEA estimates that more than 2,500 GW of renewable, storage and large-load projects are stalled in grid queues and that annual grid investment needs to rise about 50% by 2030 from current levels near USD 400 billion. Physical network expansion remains essential, but digital technologies can release capacity faster by improving network visibility, dynamic line utilization, voltage management, fault restoration and dispatch of flexible resources. China has announced approximately USD 574 billion of State Grid investment for 2026-2030, while the U.S. Department of Energy continues financing advanced grid technologies through programs including GRIP and the 2026 SPARK opportunity. This investment cycle directly expands the addressable market for automation, sensing, communications and grid-control software.
Smart metering and distribution automation programs are expanding the digital grid foundation
Distribution networks represent the largest number of physical grid endpoints and are becoming considerably more complex as power flows turn bidirectional. Smart meters, feeder sensors, automated switches, digital substations and communications networks provide the data and remote-control capability needed to manage that complexity. India illustrates the scale of this rollout: the government reported 5.28 crore smart meters installed across schemes by the end of December 2025, while RDSS had sanctioned smart metering for 19.79 crore consumers in addition to distribution transformers and feeders. Similar modernization programs across North America, Europe and Asia are upgrading first-generation AMI toward higher-frequency data, edge processing and multi-application networks, creating recurring demand for meters, communications, analytics and integration services.
Market Restraint
Long utility procurement and integration cycles slow deployment despite strong investment need
Smart-grid projects frequently involve regulated utilities, critical infrastructure and operational systems that must remain reliable through multi-year transformation programs. Procurement therefore includes extensive testing, cybersecurity review, interoperability requirements, regulatory approvals and staged integration with legacy SCADA, outage-management, billing and asset systems. Utilities may operate equipment from several generations and vendors, which increases migration complexity and makes rip-and-replace strategies commercially unattractive. Capital constraints add another layer, particularly where distribution utilities have weak financial positions or regulated returns do not immediately compensate new digital investment. The result is a market where demand can be strategically urgent but deployment remains gradual, favoring suppliers that support open standards, phased modernization and long lifecycle commitments.
Segment Analysis
By Component - Hardware
Hardware remains the largest component, accounting for approximately 46% of smart grid revenue in 2026 and projected to generate about USD 40.0 billion by 2031. Smart meters form the largest installed base within this category, complemented by sensors, field communications, programmable controllers, intelligent electronic devices and other grid-edge equipment required for automation and monitoring. The segment benefits from large national AMI programs and from replacement cycles as utilities move from first-generation meters toward platforms capable of higher-resolution data and edge applications. Hardware growth is slower than software because unit prices face scale and procurement pressure, but demand remains substantial: Landis+Gyr reports more than 180 million connected intelligent devices in its installed base, while Itron, Xylem Sensus, Kamstrup, Honeywell and Hubbell continue to expand metering, communications and grid-edge portfolios.
By Communication Technology - Wireless
Wireless smart-grid connectivity is projected to expand at approximately 10.0% annually through 2031, reaching about USD 19.8 billion in communication-related market value by the end of the period. Cellular, RF mesh, Wi-SUN and private wireless networks reduce the dependence on dedicated wireline infrastructure for AMI, distribution automation and field devices, particularly in low- and medium-voltage networks. The architecture is becoming more heterogeneous rather than converging on a single technology because utilities balance latency, coverage, cybersecurity, spectrum availability and lifecycle cost across different applications. Cisco supports cellular and mesh-based utility field networks, Landis+Gyr combines RF mesh IP and cellular connectivity, while Xylem Sensus, Trilliant and Itron operate multi-purpose networks for metering and grid automation. Wireline technologies remain important in substations, control centers and high-reliability backbone communications.
By Application - Distribution
Distribution accounts for approximately 41% of global smart-grid revenue in 2026 and is projected to generate about USD 40 billion by 2031, making it the most important application area. The segment combines AMI, feeder automation, FLISR, Volt/VAR optimization, outage management, DERMS, distribution management, transformer monitoring and increasingly granular grid-edge sensing. Distribution networks face the greatest operational change from rooftop solar, behind-the-meter batteries, EV charging and flexible loads because these assets alter local power flows and voltage conditions. Software suppliers are therefore linking ADMS and DERMS with meter data and edge intelligence, while equipment companies are adding sensing and communications to switches, reclosers and secondary substations. Investment is shifting from simple remote visibility toward automated and eventually more autonomous distribution operations.
By Geography - Asia Pacific
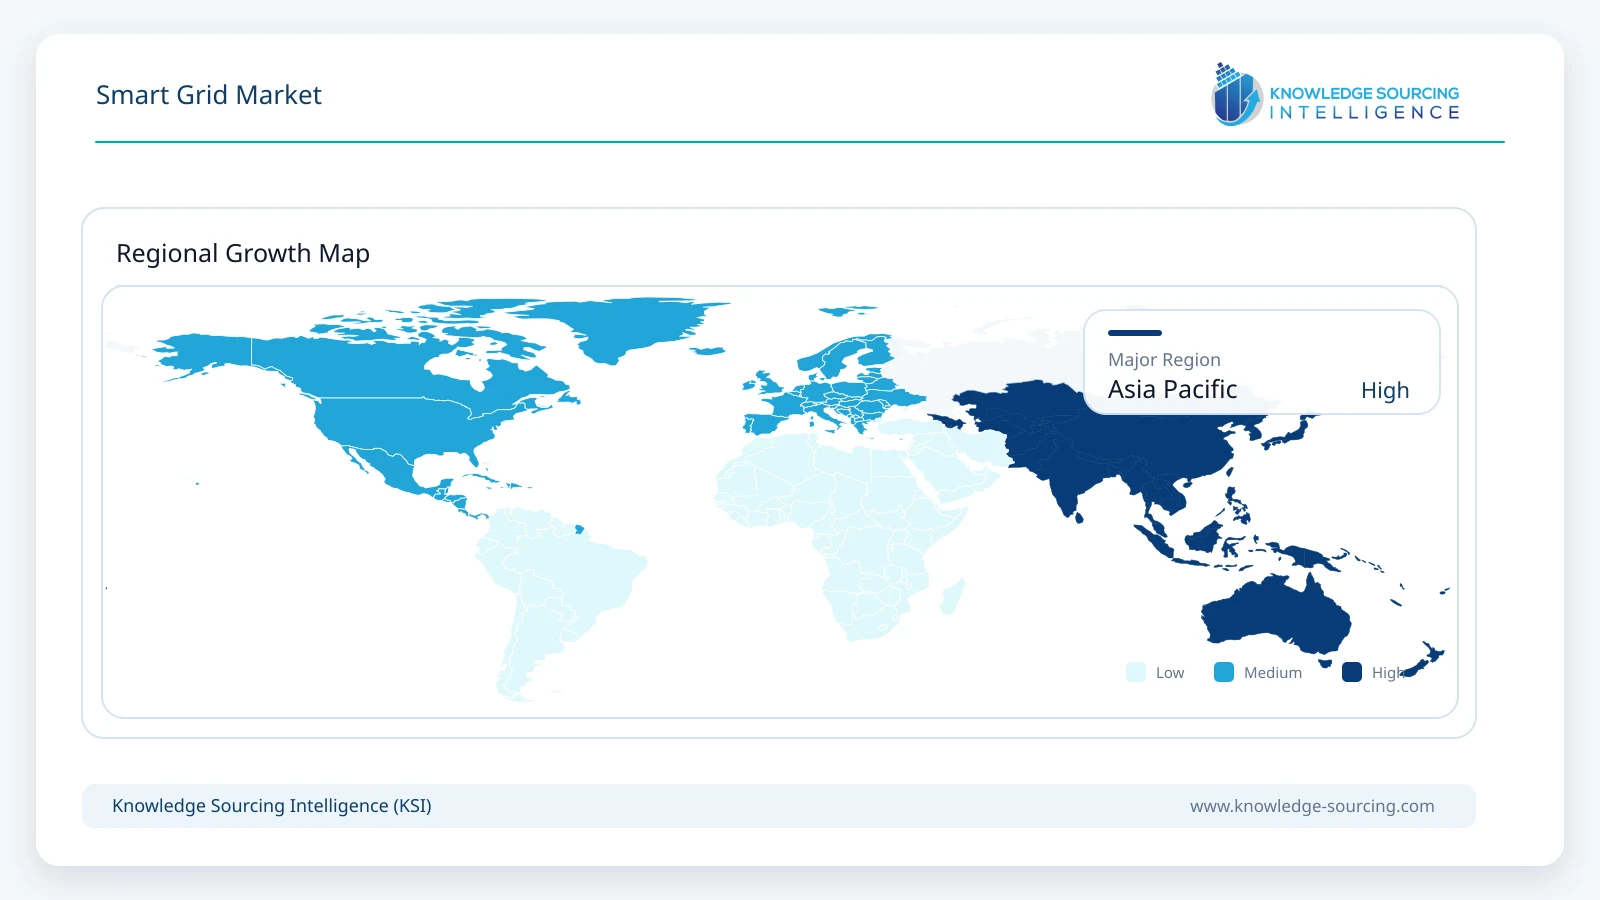
Asia Pacific is the largest regional market, contributing approximately 36% of global smart-grid revenue in 2026 and projected to approach USD 35.0 billion by 2031. China combines the world’s largest electricity system with a record 2026-2030 grid investment program focused on transmission expansion, distribution reinforcement, microgrids and improved management of renewable generation. India is scaling smart metering and distribution-system digitalization under RDSS, while Japan, South Korea and Australia continue investing in advanced metering, DER integration and grid-edge applications. Southeast Asian markets are earlier in the modernization cycle but face rapid electricity-demand growth and increasing renewable penetration. The region therefore combines mature high-value digital-grid markets with large-volume infrastructure programs, supporting faster growth than most developed regions through 2031.
Competitive Environment
Competition spans several distinct supplier groups. Schneider Electric, Siemens, GE Vernova and Hitachi Energy combine grid equipment, automation and software with large utility project capabilities. ABB and Eaton participate strongly in distribution automation, protection, control and grid-modernization hardware. Itron, Landis+Gyr, Xylem Sensus, Kamstrup and Honeywell have strong positions in AMI, metering and communications, while Oracle Utilities competes in ADMS and DERMS software and Cisco provides utility communications and cybersecurity infrastructure. Trilliant and Hubbell Aclara add multi-technology communications, metering and grid-edge intelligence.
Competitive differentiation is increasingly based on interoperability and the ability to extend installed infrastructure into new applications. Utilities are reluctant to replace entire operating environments each time a new DER, communications technology or analytics application is added, so suppliers are opening platforms and supporting third-party applications. Landis+Gyr expanded its edge-app ecosystem in Australia during 2026, Siemens is enabling utilities to integrate their own applications into Gridscale X, and GE Vernova is using a federated data foundation within GridOS. Scale still matters in hardware, but software architecture, cybersecurity, integration capability and lifecycle services are becoming more important determinants of long-term supplier position.
Recent Developments
August 2026: Landis+Gyr expanded its Grid Edge Application Ecosystem in Australia by adding Future Grid and Operational Technology Solutions, extending real-time distribution intelligence on its open edge platform.
June 2026: GE Vernova introduced GridOS for Transmission, combining real-time operations, capacity awareness, forecasting and stability monitoring in a unified transmission-orchestration environment.
May 2026: Siemens announced the next evolution of Gridscale X with AI-powered agentic transmission planning and a shared platform designed to support utility-developed and third-party applications.
February 2026: Schneider Electric introduced new grid and transmission software capabilities at DTECH, including predictive major-event management and enhanced transmission-distribution coordination.
Smart Grid Market Scope:
| Report Metric | Details |
|---|---|
| Total Market Size in 2026 | USD 62.1 billion |
| Total Market Size in 2031 | USD 93.0 billion |
| Forecast Unit | Billion |
| Growth Rate | 8.4% |
| Study Period | 2021 to 2031 |
| Historical Data | 2021 to 2024 |
| Base Year | 2025 |
| Forecast Period | 2026 – 2031 |
| Segmentation | Component, Communication Technology, Application, Geography |
| Companies |
|
Market Segmentation
By Component
Software
Advanced Metering Infrastructure Software
Smart Grid Distribution Management
Smart Grid Network Management
Grid Asset Management
Substation Automation
Smart Grid Security
Others
Hardware
Sensors
Programmable Logic Controllers
Smart Meters
Networking Hardware
Services
Consulting
Deployment and Integration
Support and Maintenance
By Communication Technology
Wireline
Wireless
By Application
Generation
Transmission
Distribution
Consumption
By Geography
North America
USA
Canada
Mexico
South America
Brazil
Argentina
Others
Europe
United Kingdom
Germany
France
Spain
Italy
Netherlands
Others
Middle East and Africa
Saudi Arabia
UAE
South Africa
Others
Asia Pacific
China
India
Japan
South Korea
Australia
Indonesia
Thailand
Others
Table of Contents
1. EXECUTIVE SUMMARY
2. MARKET SNAPSHOT
2.1. Market Overview
2.2. Market Definition
2.3. Scope of the Study
2.4. Market Segmentation
3. BUSINESS LANDSCAPE
3.1. Market Drivers
3.1.1. Electrification and Renewable Integration Are Forcing Utilities to Unlock Additional Grid Capacity
3.1.2. Smart Metering and Distribution Automation Programs Are Expanding the Digital Grid Foundation
3.2. Market Restraint
3.2.1. Long Utility Procurement and Integration Cycles Slow Deployment Despite Strong Investment Need
3.3. Market Opportunities
3.4. Porter's Five Forces Analysis
3.5. Industry Value Chain Analysis
3.6. Policies and Regulations
3.7. Strategic Recommendations
4. TECHNOLOGICAL OUTLOOK
4.1. Unified Grid-Orchestration Platforms
4.2. Grid-Edge Intelligence and AMI 2.0
4.3. AI-Enabled Planning, Forecasting and Autonomous Grid Operations
5. SMART GRID MARKET BY COMPONENT
5.1. Introduction
5.2. Software
5.2.1. Advanced Metering Infrastructure Software
5.2.2. Smart Grid Distribution Management
5.2.3. Smart Grid Network Management
5.2.4. Grid Asset Management
5.2.5. Substation Automation
5.2.6. Smart Grid Security
5.2.7. Others
5.3. Hardware
5.3.1. Sensors
5.3.2. Programmable Logic Controllers
5.3.3. Smart Meters
5.3.4. Networking Hardware
5.4. Services
5.4.1. Consulting
5.4.2. Deployment and Integration
5.4.3. Support and Maintenance
6. SMART GRID MARKET BY COMMUNICATION TECHNOLOGY
6.1. Introduction
6.2. Wireline
6.3. Wireless
7. SMART GRID MARKET BY APPLICATION
7.1. Introduction
7.2. Generation
7.3. Transmission
7.4. Distribution
7.5. Consumption
8. SMART GRID MARKET BY GEOGRAPHY
8.1. Introduction
8.2. North America
8.2.1. USA
8.2.2. Canada
8.2.3. Mexico
8.3. South America
8.3.1. Brazil
8.3.2. Argentina
8.3.3. Others
8.4. Europe
8.4.1. United Kingdom
8.4.2. Germany
8.4.3. France
8.4.4. Spain
8.4.5. Italy
8.4.6. Netherlands
8.4.7. Others
8.5. Middle East and Africa
8.5.1. Saudi Arabia
8.5.2. UAE
8.5.3. South Africa
8.5.4. Others
8.6. Asia Pacific
8.6.1. China
8.6.2. India
8.6.3. Japan
8.6.4. South Korea
8.6.5. Australia
8.6.6. Indonesia
8.6.7. Thailand
8.6.8. Others
9. COMPETITIVE ENVIRONMENT AND ANALYSIS
9.1. Major Players and Strategy Analysis
9.2. Market Share Analysis
9.3. Mergers, Acquisitions, Agreements and Collaborations
9.4. Competitive Dashboard
10. COMPANY PROFILES
10.1. Schneider Electric SE
10.2. Siemens AG
10.3. GE Vernova Inc.
10.4. Hitachi Energy Ltd.
10.5. ABB Ltd.
10.6. Eaton Corporation plc
10.7. Itron, Inc.
10.8. Landis+Gyr Group AG
10.9. Xylem Inc. (Sensus)
10.10. Honeywell International Inc.
10.11. Cisco Systems, Inc.
10.12. Oracle Corporation (Oracle Utilities)
10.13. Kamstrup A/S
10.14. Trilliant Holdings, Inc.
10.15. Hubbell Incorporated (Aclara)
11. APPENDIX
11.1. Currency
11.2. Assumptions
11.3. Base and Forecast Years Timeline
11.4. Key Benefits for Stakeholders
11.5. Research Methodology
11.6. Abbreviations
LIST OF FIGURES
LIST OF TABLES
Navigate
Trusted by the world's leading organizations











