
The global AI in Cancer Diagnostics Market is projected to expand at a CAGR of 36.5%, reaching USD 17,608.5 million in 2031 from USD 3,717.2 million in 2026.
Highlights:
- 1Software is the largest identifiable commercial component, with paid image analysis and pathology applications extending across multiple hospital locations.
- 2Breast and lung screening create sizable repeat diagnostic workloads; prostate pathology provides a separate route through digital-slide adoption.
- 3Deep learning remains the central analytical architecture, but computer vision and conventional machine learning are important in specialised workflows.
- 4Cloud deployment offers multi-site scale; on-premises systems retain a place where clinical data residency or latency requirements are restrictive.
- 5North America benefits from established diagnostic digitisation and device-regulatory pathways; Asia Pacific has a faster modeled expansion profile.
- 6Clinical evidence, compatible workflow interfaces and product-specific authorisation matter more to procurement than general claims of diagnostic automation.

Cancer diagnostic AI comprises commercially supplied algorithms and identifiable supporting systems that help clinicians evaluate radiology images, digitised pathology slides, genomic results and other oncology-specific clinical evidence. Contracts may cover regulated detection software, analytical platforms, integration services and the portion of supporting equipment directly attributable to these applications. Sales of complete CT scanners, routine molecular assays, general cloud infrastructure and drug-discovery systems remain different economic activities, even when similar AI methods are used.
Deployment is organised around distinct care pathways. Imaging algorithms interact with picture archiving and reporting systems; pathology applications require whole-slide imaging, specimen tracking and laboratory workflow controls; genomic analysis needs structured variants and validated sample quality. A vendor’s route to market consequently depends on clinical indication, approved use, procurement budget and the ability to show results at the point where a clinician acts. Radiology and pathology specialists often enter through a narrow cancer use case before expanding their platform within the same hospital group.
Market Overview
Across breast and lung imaging, software procurement is becoming more closely tied to eligible examinations and the quality of the entire reading process. A detector that flags additional findings must not produce an unmanageable volume of false positives. The FDA’s March 2026 clearance for Lunit INSIGHT DBT version 1.2 and September clearance for Qure.ai qCT Lung apply to specific products and indications. Neither decision authorises autonomous interpretation across every cancer type. Healthcare buyers therefore examine scanner compatibility, post-clearance change controls and the evidence supporting the intended diagnostic role.
Digital pathology is making the commercial equation different. Tempus’s Paige Prostate research in UK hospitals and Ibex’s work on breast-marker quantification demonstrate the use of AI within actual laboratory processes, although individual modules differ in their regulatory status. The question for laboratories is whether digital slides, algorithm outputs and the final report can be handled without creating new bottlenecks or compromising diagnostic responsibility. Integrated vendors gain from installed infrastructure, but specialists with robust clinical evidence can still win a particular indication or reader-assistance task.
Market Trends
Regulated indications are defining the addressable market
A new clearance matters most when it maps onto an established diagnostic pathway. Median Technologies received FDA clearance for eyonis LCS in February 2026 for lung cancer screening, while Qure.ai obtained a separate clearance for qCT Lung in September. Both products address radiological assessment, but their indications, performance evidence and operating requirements must be evaluated individually. Procurement committees increasingly ask for the authorised configuration, intended patient group and monitoring commitments before agreeing to a network-wide licence.
Commercial execution now depends on implementation as much as product authorisation. Even a cleared algorithm cannot generate dependable recurring revenue until image routing, reader training, exception handling and support are working reliably. Vendors able to document early deployments and customer renewals are better placed than firms relying mainly on regulatory milestones.
Pathology AI is joining routine slide and reporting systems
Ibex introduced its next-generation pathology platform in March 2026 and subsequently disclosed European IVDR certification for breast immunohistochemistry applications. These developments extend automation from locating suspicious morphology to helping standardise quantitative reporting. For a pathology network, the meaningful gains lie in maintaining traceable specimen identity, consistent staining interpretation and reviewable outputs across laboratories.
Slide scanners and image-management platforms create a substantial initial investment, which favours software able to operate within an existing digital estate. PathAI’s multi-algorithm workflow updates similarly show how customer demand is moving toward coordinated analysis instead of disconnected AI viewers. Validation across staining protocols remains a separate burden even where the interface looks uniform.
Clinical evidence is moving beyond laboratory benchmarks
In July 2026 Tempus publicised a multicentre NHS study of the Paige Prostate suite involving more than 1,000 patients. The reported changes in diagnosis or grading provide a concrete measure of how a second-reader application can affect pathology work. Prospective evidence of this kind gives purchasers more information than retrospective slide accuracy alone, though the result should not be generalized to every hospital or unapproved module.
Future purchasing tests will likely include turnaround time, discordance review, repeat staining, downstream investigations and the workload transferred back to specialists. Financial value is clearest when the analysis reduces unnecessary work without introducing unsafe shortcuts in the diagnostic pathway.
AI-generated molecular signals require confirmatory discipline
Computational pathology and genomic tools increasingly propose biomarkers or quantify tumour-cell content before sequencing. PathAI’s deployment with University Hospital Zurich illustrates the practical importance of sample quality in molecular pathology. The software may help select better specimens, but it does not replace a clinically validated assay required to establish a treatment-relevant alteration.
This distinction affects commercial models. Research licences, laboratory process improvement and regulated molecular diagnostics support different prices and evidence expectations. Providers that preserve data lineage between images, specimens, variants and clinician decisions have a stronger basis for durable integration than vendors promising an all-purpose oncology prediction engine.

Segment Analysis
By Technology: Deep Learning
Image-based cancer diagnosis has become a natural application for deep learning because modern imaging and whole-slide files contain visual structure too complex for fixed-rule interpretation. Deep learning represents an estimated 42% of market value in 2026, reflecting the importance of high-dimensional image and tissue analysis. Competitive differentiation rests on reliable clinical outputs rather than the terminology vendors use for the underlying algorithms.
The commercial distinction is performance across scanners, acquisition settings and patient groups. New models may be more sensitive on an internal dataset yet require additional evidence before use in another hospital. Providers that maintain transparent version control and permit clinically controlled updates should capture greater value as deployment expands.
By Component: Software
Software represents an estimated 72% of 2026 attributed market spending and is expected to increase its share as more institutions connect existing imaging equipment to licensed diagnostic analysis. Recurrent per-study charges, enterprise licences and product-specific subscriptions let hospitals scale from a pilot unit to a network with less additional hardware. Hardware remains relevant in slide digitisation, but its full scanner value cannot be assumed to be AI revenue.
Procurement is rarely decided by licence price alone. Interoperability, storage, cybersecurity, downtime procedures and software lifecycle support can influence the effective cost over several years. Buyers increasingly favour a supplier able to report clinical performance and workflow exceptions after installation.
By Cancer Type: Breast Cancer
Breast cancer represents approximately one-quarter of attributable 2026 spending in the market. Screening generates frequent image interpretation, defined reader pathways and measurable recall and detection outcomes. The Lunit and ScreenPoint product portfolios illustrate two commercial approaches to breast AI, with workflow integration and independent evidence central to both.
Such algorithms must still operate within local screening eligibility, reader requirements and equipment configurations. The opportunity widens as tomosynthesis and multi-site imaging become more common, but a vendor cannot assume that a tool cleared for one modality has automatic coverage across all mammography installations.
By Application: Tumor Detection and Classification
Tumor detection and classification forms the leading application, with an estimated 29% of 2026 market revenue. The purchasing objective is to identify suspicious cases consistently and to provide clinicians with usable evidence, not simply to generate a risk score. Pathology, breast imaging and lung screening make different demands on accuracy, localisation and clinical escalation, and vendors must support those differences.
By 2031, this application is projected to reach approximately USD 4,930 million. Growth is reinforced by rising image volumes and digital infrastructure, but software cannot replace biopsy confirmation or qualified review when that remains the approved clinical standard.
By Deployment: Cloud-Based
Cloud-based deployment is allocated about 62% of attributable 2026 revenue and approximately 70% in 2031. Central model maintenance, multi-site access and the ability to scale image processing are attractive to diagnostic networks. Suppliers can implement consistent software updates and analytics oversight without requiring a separate computing cluster in each hospital.
Data localisation, information security and clinical service continuity limit how far that architecture can be standardised. Large laboratories may prefer controlled local execution or hybrid designs for identifiable patient data, especially when image transmission costs and latency affect workflow throughput.
By End-User: Hospitals and Clinics
Hospitals and clinics account for an estimated 48% of the 2026 market as oncology diagnostics remain connected to referral pathways, imaging departments and multidisciplinary cancer teams. Hospital buyers can justify software where it improves reader productivity, supports clearer review or shortens delays to a decisive test. Their purchases often depend on enterprise IT approval and a clinical champion rather than a technology demonstration alone.
Independent diagnostic centres are also important: large screening volumes can make per-examination economics attractive. Hospitals retain the leading share through 2031, although laboratory networks and diagnostic chains may expand faster when they can reuse a validated workflow across multiple sites.
Market Drivers
Screening workloads are outpacing specialist capacity
Mammography, lung CT and tissue pathology workloads grow with screening participation and the clinical burden of cancer. Qualified radiologists and pathologists cannot be added instantaneously, especially in smaller regional centres. Systems that prioritise suspicious findings or standardise repeatable measurements are gaining a clearer operational role within this mismatch.
Commercial adoption is strongest where purchasers can measure time saved per completed examination and sustained diagnostic consistency. An extra algorithmic finding has little value if no clinician is available to review it or act before the patient pathway changes.
Digital pathology investment makes AI deployable
Whole-slide scanning converts physical biopsy specimens into files that can be analysed, shared and reviewed remotely. Once laboratories have stable digital workflows, cancer-specific image interpretation becomes a more practical additional purchase. Ibex and Tempus illustrate how pathology software can attach to this infrastructure rather than requiring a wholly separate clinical system.
The pace depends on scanner selection, image storage and laboratory information integration. Providers that can demonstrate compatibility and support mixed installations benefit, while those demanding a costly closed ecosystem face a narrower pool of eligible buyers.
Precision oncology depends on interpretable complex data
Molecular panels and image-derived pathology features introduce an interpretation workload alongside conventional morphological diagnosis. AI can help triage specimens, organise genomic evidence and identify where confirmatory tests may be most useful. This creates a service opportunity around validated decision support for multidisciplinary oncology teams.
It also sets a limit on product claims. A predicted mutation or biomarker does not itself satisfy the analytic requirements of a clinical assay. Companies that present AI as assistance within an established evidence chain should have a more durable clinical proposition.
Product-specific regulatory pathways support purchasing
United States 510(k) records for Lunit INSIGHT DBT and Qure.ai qCT Lung, together with European certifications for selected pathology products, give buyers clear documents against which to assess scope. This matters particularly for hospital groups that must justify deployment through formal clinical governance.
Clearance does not establish revenue, reimbursement or suitability for every setting. Its commercial effect becomes material when deployment teams can translate authorised claims into procurement specifications, training, service-level expectations and monitored clinical outcomes.
Diagnostic networks are seeking platform economies
Large healthcare groups increasingly prefer a common route for image access, algorithm management and performance reporting across hospitals and laboratories. A multi-site deployment can spread IT integration costs over a larger case volume while keeping reporting and audit procedures consistent.
Vendors that supply reliable interfaces and implementation support may therefore secure broader contracts than narrowly differentiated algorithms alone. Conversely, a platform that forces unnecessary replacements of existing equipment may struggle even when its clinical performance is strong.
Market Restraints
Clinical generalisation remains an expensive validation task
Training datasets can underrepresent scanner types, staining practices, disease subgroups or patients treated outside major academic centres. Differences in acquisition and reporting may reduce performance after a product moves from its original development site. Purchasers now scrutinise external clinical testing and the controls used to detect unexpected shifts.
Suppliers need longitudinal monitoring, an escalation route and disciplined model change management. Those costs can be considerable for smaller vendors supporting multiple regulatory jurisdictions and patient populations.
Existing laboratory and imaging systems are difficult to integrate
Pathology scanners, PACS, laboratory information systems and electronic records were often deployed by different vendors under separate contracts. AI requires consistent identity, metadata and event flow between them. A technically successful algorithm can still fail commercially if its results appear outside the clinician’s working environment.
Integration usually involves site validation, cybersecurity reviews, staff training and revised exception procedures. These expenses constrain smaller hospitals and can prolong the time between a signed contract and productive use.
Regulatory evidence and clinical liability slow autonomous uses
Authorisation is specific to the device, intended users and indications supported by submitted evidence. Research demonstrations and clinical decision-support concepts cannot be promoted as equivalent to approved autonomous diagnosis. Physicians remain responsible for many decisions made with AI assistance.
Clear audit trails, controlled versions and explicit documentation of discordant findings are therefore central to implementation. A supplier that cannot explain when the clinician must override the system is unlikely to win broad deployment in high-risk diagnosis.
Reimbursement and budget attribution remain uneven
A hospital may need to finance licences, scanners, storage, integration and maintenance even when an AI product saves staff time. The value of fewer unnecessary follow-ups or improved consistency does not always translate into an identifiable reimbursement line. Smaller diagnostic centres consequently apply stricter payback tests.
Usage-based pricing can help access but creates budgeting uncertainty where examination volumes fluctuate. Stronger evidence on total pathway cost, rather than model accuracy alone, will be needed to sustain premium contracts.
Data stewardship and cybersecurity restrict deployment choices
Diagnostic images, genomic data and pathology records can reveal highly sensitive information. Sharing them between institutions raises requirements for permission, secure processing and traceable retention. Cloud solutions may be operationally efficient yet face restrictions imposed by local law or hospital policy.
These constraints favour vendors that can explain data handling, offer appropriate deployment architecture and maintain recovery procedures. They also limit the feasibility of pooling unrestricted data across regions to retrain a single model.
Regional Outlook
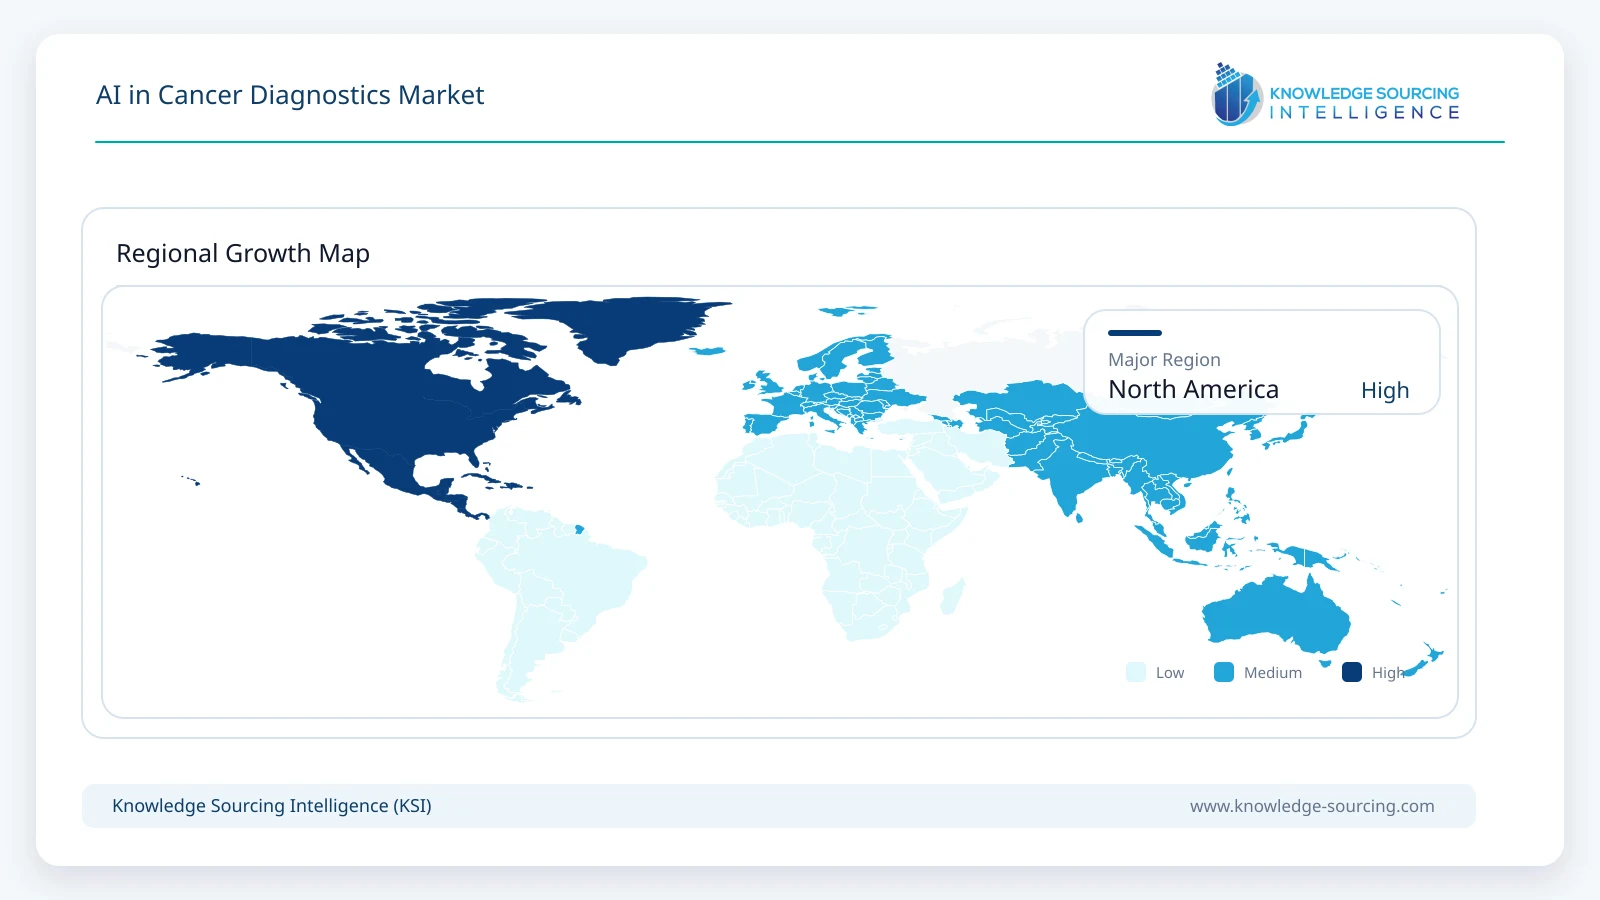
North America: Largest Commercial Region
North America accounts for an estimated 41% of worldwide revenue in 2026, equivalent to USD 1,524.1 million. The market is projected to rise to USD 6,515.1 million in 2031, implying 33.7% annual growth. The United States dominates regional procurement through established screening networks, digital pathology investment, oncology research capacity and the availability of identifiable FDA clearance records for many regulated software products.
Commercial scale is increasingly decided by repeatability across hospital systems. Screening providers want proven compatibility and consistent follow-up handling; pathology networks expect reliable slide identification and structured case review. Canada adds a well-organised clinical-research environment, while reimbursement decisions and varying hospital budgets continue to constrain the pace of broader expansion.
Asia Pacific: Fastest-Growing Region
Asia Pacific is modeled at USD 892.1 million in 2026 and USD 5,282.6 million by 2031. Its share rises from 24% to 30%, producing an implied regional CAGR of 42.7%, outpacing the other major regions in the forecast. The market combines sophisticated diagnostic technology suppliers in Japan and South Korea with increasing imaging volumes and digital-health investment in China and India.
The strongest opportunities are not identical across the region. A large urban hospital may purchase enterprise pathology and radiology AI, whereas a smaller centre may first need image digitisation, secure connectivity and trained readers. Local regulatory review, language support and reimbursement remain fragmented. Suppliers that adapt the same validated clinical function to different institutional workflows are likely to achieve steadier adoption than those assuming one deployment model fits every country.
Competitive Landscape
Competition is forming around three different capabilities: clinically indicated software, an installed diagnostic platform and the evidence needed to connect the two. Tempus AI, which acquired Paige in 2025, combines oncology data operations with a digital pathology portfolio. Ibex, PathAI and other pathology specialists compete through slide interpretation and laboratory workflows; Lunit, ScreenPoint, Hologic, iCAD and Median operate closer to imaging and screening. Qure.ai addresses cancer-related chest imaging, where integration with screening programmes remains decisive.
Large imaging technology groups including Siemens Healthineers and GE HealthCare have established hospital distribution and device integration advantages, although their total corporate sales are not comparable with this narrow cancer AI market. Specialist firms are more concentrated on an indication and may move faster through clinical validation. The strategic choice for buyers is whether to favour a multi-application ecosystem or a best-in-class tool connected to existing infrastructure. A device clearance should be assessed at the product level, not assumed across its owner’s portfolio.
Recent Developments
14 September 2026 | Qure.ai: The FDA recorded 510(k) substantial equivalence for qCT Lung version 1.0, a radiological computer-assisted detection/diagnosis product for lesions suspicious for cancer. The clearance is specific to its device scope.
23 July 2026 | Ibex Medical Analytics: Announced European IVDR certification for its breast ER, PR and Ki67 immunohistochemistry applications, expanding its clinically certified digital pathology workflow.
16 July 2026 | Tempus AI / Paige: Reported results from the UK NHS ARTICULATE Pro clinical study of Paige Prostate, identifying changes in diagnosis or grading for a subset of reviewed patients and documenting workflow effects.
3 July 2026 | Median Technologies: Announced CE marking under the EU Medical Device Regulation for eyonis LCS, extending its commercial regulatory coverage beyond its February US FDA clearance.
17 April 2026 | Lunit: Reported broader US breast-imaging deployments and its next-generation 3D mammography AI clearance; the underlying FDA record identifies a 26 March clearance date for INSIGHT DBT version 1.2.
18 March 2026 | Ibex Medical Analytics: Launched Ibex 4, a pathology platform combining tissue-image analysis and breast-marker quantification to support laboratory case review.
Market Outlook
Expansion through 2031 will depend on moving from promising algorithms to reliably used clinical systems. Breast and lung screening offer high-volume imaging tasks with relatively clear procurement pathways; tissue pathology creates wider opportunities as slide digitisation becomes routine. The most useful AI products will shorten a defined diagnostic process, increase consistency or help a clinician identify cases requiring closer inspection, with evidence capable of surviving independent review.
The market’s rapid forecast growth should not obscure the operational limits on implementation. Hospitals still need compatible infrastructure, qualified readers, regulated software lifecycle controls and a defensible economic case. Vendors that can demonstrate real-world performance, controlled upgrades and transparent clinical responsibility are better positioned than suppliers depending on broad claims that AI will replace diagnosis.
AI in Cancer Diagnostics Market Scope
| Report Metric | Details |
|---|---|
| Total Market Size in 2026 | USD 3,717.2 million |
| Total Market Size in 2031 | USD 17,608.5 million |
| Forecast Unit | Million |
| Growth Rate | 36.5% |
| Study Period | 2021 to 2031 |
| Historical Data | 2021 to 2024 |
| Base Year | 2025 |
| Forecast Period | 2026 – 2031 |
| Segmentation | Technology, Component, Cancer Type, Application, Deployment, End-User, Geography |
| Companies |
|
| Customization Scope | 15% Free Customization included with purchase — Request Custom Breakdown → |
| Sample & Data Access | PDF Sample, Excel Databook & Analyst Briefing — Download Free Sample → |
Market Segmentation
By Technology
Machine Learning
Deep Learning
Computer Vision
Natural Language Processing (NLP)
Others
By Component
Software
Hardware
Services
By Cancer Type
Breast Cancer
Lung Cancer
Prostate Cancer
Colorectal Cancer
Skin Cancer
Others
By Application
Tumor Detection and Classification
Image Analysis
Genomic Analysis
Treatment Planning
Clinical Decision Support
Others
By Deployment
Cloud-Based
On-Premises
By End-User
Hospitals and Clinics
Diagnostic Centers
Research Institutes
Others
By Geography
North America
United States
Canada
Mexico
South America
Brazil
Argentina
Rest of South America
Europe
United Kingdom
Germany
France
Italy
Spain
Rest of Europe
Middle East and Africa
Saudi Arabia
United Arab Emirates
South Africa
Rest of Middle East and Africa
Asia Pacific
China
India
Japan
South Korea
Australia
Indonesia
Thailand
Taiwan
Rest of Asia Pacific
Table of Contents
1. EXECUTIVE SUMMARY
1.1. Key Findings
1.2. Analyst View
2. MARKET SNAPSHOT
2.1. Market Definition and Scope
2.2. Market Size and Forecast
2.3. Segmentation Overview
3. BUSINESS LANDSCAPE
3.1. Market Drivers
3.1.1. Screening workloads are outpacing specialist capacity
3.1.2. Digital pathology investment makes AI deployable
3.1.3. Precision oncology depends on interpretable complex data
3.1.4. Product-specific regulatory pathways support purchasing
3.1.5. Diagnostic networks are seeking platform economies
3.2. Market Restraints
3.2.1. Clinical generalisation remains an expensive validation task
3.2.2. Existing laboratory and imaging systems are difficult to integrate
3.2.3. Regulatory evidence and clinical liability slow autonomous uses
3.2.4. Reimbursement and budget attribution remain uneven
3.2.5. Data stewardship and cybersecurity restrict deployment choices
3.3. Market Opportunities
3.4. Porter’s Five Forces Analysis
3.4.1. Supplier Bargaining Power
3.4.2. Buyer Bargaining Power
3.4.3. Threat of New Entrants
3.4.4. Threat of Substitutes
3.4.5. Competitive Rivalry
3.5. Industry Value Chain Analysis
3.6. Policies and Regulations
3.7. Strategic Recommendations
4. TECHNOLOGICAL OUTLOOK
4.1. Medical Image AI and Deep Learning
4.2. Digital Pathology and Biomarker Analysis
4.3. Multimodal Oncology Data Integration
5. AI IN CANCER DIAGNOSTICS MARKET BY TECHNOLOGY
5.1. Introduction
5.2. Machine Learning
5.3. Deep Learning
5.4. Computer Vision
5.5. Natural Language Processing (NLP)
5.6. Others
6. AI IN CANCER DIAGNOSTICS MARKET BY COMPONENT
6.1. Introduction
6.2. Software
6.3. Hardware
6.4. Services
7. AI IN CANCER DIAGNOSTICS MARKET BY CANCER TYPE
7.1. Introduction
7.2. Breast Cancer
7.3. Lung Cancer
7.4. Prostate Cancer
7.5. Colorectal Cancer
7.6. Skin Cancer
7.7. Others
8. AI IN CANCER DIAGNOSTICS MARKET BY APPLICATION
8.1. Introduction
8.2. Tumor Detection and Classification
8.3. Image Analysis
8.4. Genomic Analysis
8.5. Treatment Planning
8.6. Clinical Decision Support
8.7. Others
9. AI IN CANCER DIAGNOSTICS MARKET BY DEPLOYMENT
9.1. Introduction
9.2. Cloud-Based
9.3. On-Premises
10. AI IN CANCER DIAGNOSTICS MARKET BY END-USER
10.1. Introduction
10.2. Hospitals and Clinics
10.3. Diagnostic Centers
10.4. Research Institutes
10.5. Others
11. AI IN CANCER DIAGNOSTICS MARKET BY GEOGRAPHY
11.1. Introduction
11.2. North America
11.2.1. United States
11.2.2. Canada
11.2.3. Mexico
11.3. South America
11.3.1. Brazil
11.3.2. Argentina
11.3.3. Rest of South America
11.4. Europe
11.4.1. United Kingdom
11.4.2. Germany
11.4.3. France
11.4.4. Italy
11.4.5. Spain
11.4.6. Rest of Europe
11.5. Middle East and Africa
11.5.1. Saudi Arabia
11.5.2. United Arab Emirates
11.5.3. South Africa
11.5.4. Rest of Middle East and Africa
11.6. Asia Pacific
11.6.1. China
11.6.2. India
11.6.3. Japan
11.6.4. South Korea
11.6.5. Australia
11.6.6. Indonesia
11.6.7. Thailand
11.6.8. Taiwan
11.6.9. Rest of Asia Pacific
12. COMPETITIVE ENVIRONMENT AND ANALYSIS
12.1. Major Players and Strategy Analysis
12.2. Market Share Analysis
12.3. Agreements, Acquisitions and Collaborations
12.4. Competitive Dashboard
13. COMPANY PROFILES
13.1. Tempus AI, Inc. (including Paige)
13.2. Ibex Medical Analytics
13.3. Lunit, Inc.
13.4. Median Technologies
13.5. Qure.ai
13.6. ScreenPoint Medical
13.7. iCAD, Inc.
13.8. Hologic, Inc.
13.9. PathAI, Inc.
13.10. DeepHealth (RadNet, Inc.)
13.11. Siemens Healthineers AG
13.12. GE HealthCare Technologies Inc.
14. APPENDIX
14.1. Currency
14.2. Research Assumptions
14.3. Base and Forecast Years Timeline
14.4. Research Methodology
14.5. Abbreviations





Frequently asked questions
What is the projected market size for AI in Cancer Diagnostics by 2031?
The AI in Cancer Diagnostics Market is projected to reach USD 17,608.5 million by 2031.
What is the forecasted CAGR for the AI in Cancer Diagnostics market?
The AI in Cancer Diagnostics Market is projected to expand at a 36.5% CAGR.
Which region shows the fastest expansion profile?
Asia Pacific has a faster modeled expansion profile.
What is the largest commercial component in this market?
Software is the largest identifiable commercial component.
What are key clinical applications for AI in cancer diagnostics?
Breast, lung screening, and prostate pathology are key applications.
What factors drive procurement in this market?
Clinical evidence, workflow interfaces, and product authorization matter most.
Cite this report
Knowledge Sourcing Intelligence. (Oct 2026). AI in Cancer Diagnostics Market - Strategic Insights and Forecasts (2026-2031). https://www.knowledge-sourcing.com/report/ai-in-cancer-diagnostics-market