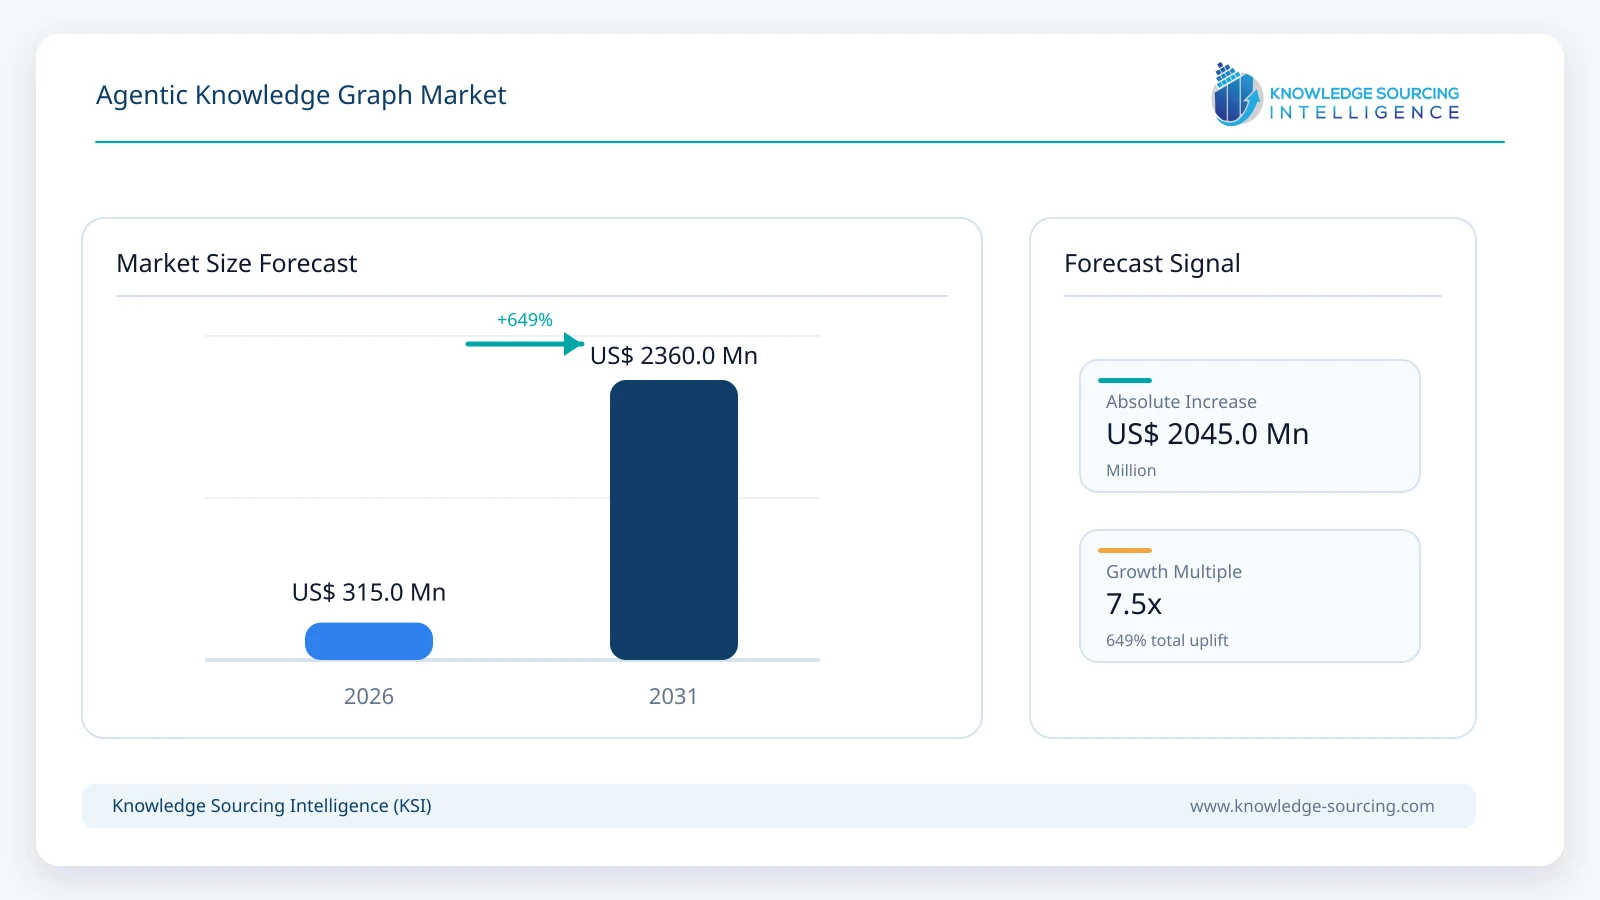
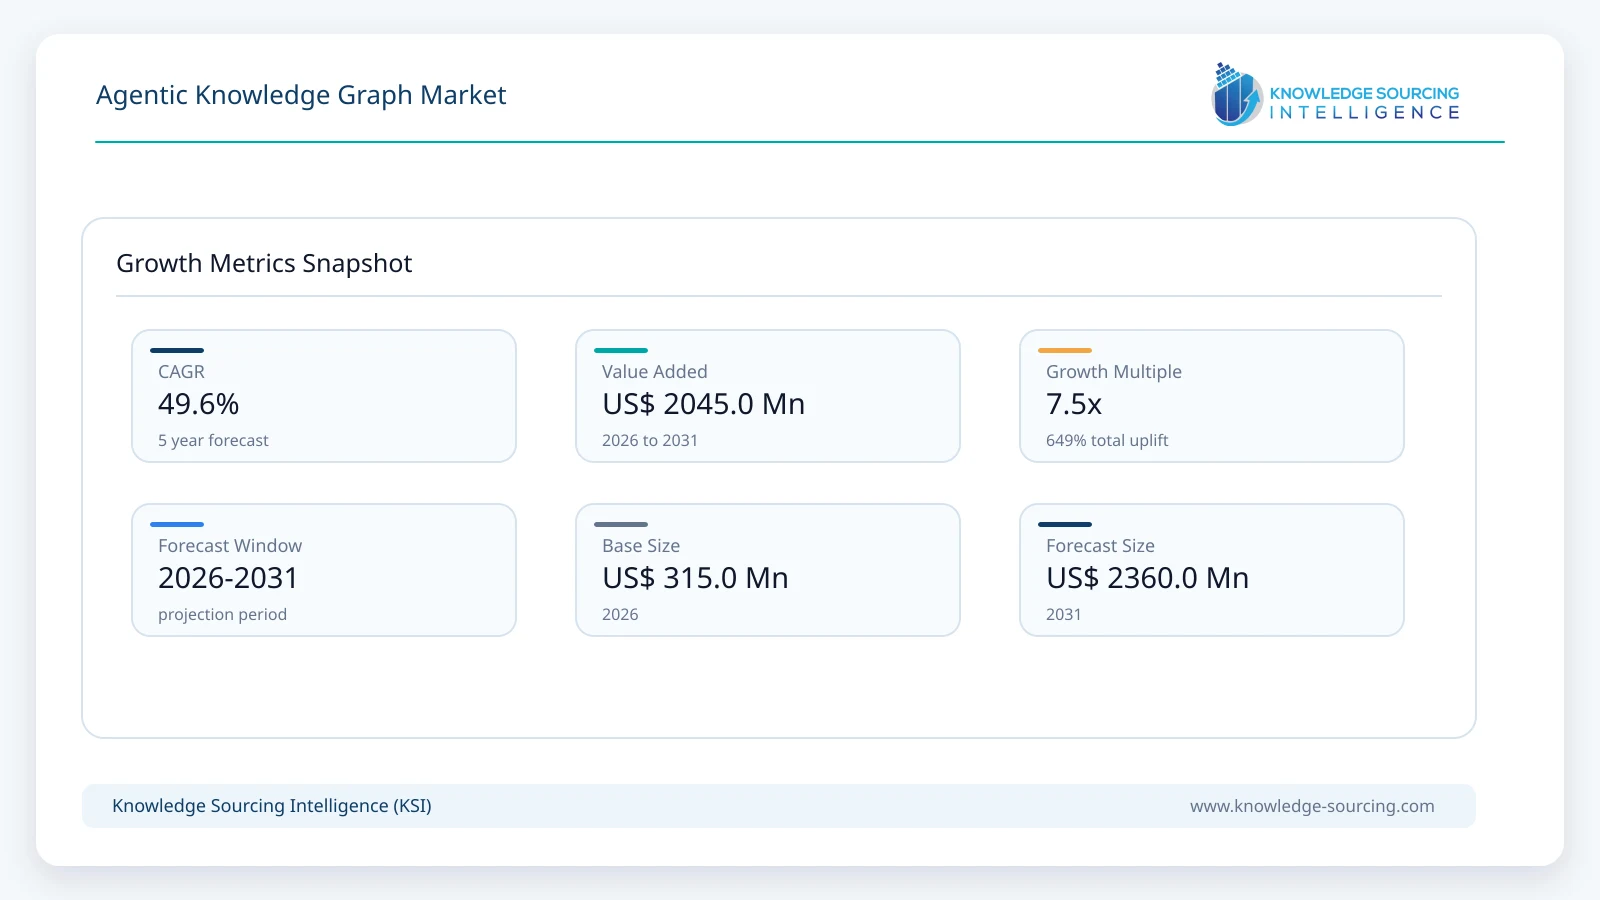
The Agentic Knowledge Graph Market is projected to grow from USD 315 million in 2026 to USD 2,360 million by 2031, at a CAGR of 49.60% during the forecast period.
Highlights:
- 1Agent-ready knowledge layers link corporate semantics, entity relationships and reasoning tools into repeatable enterprise workflows.
- 2Graph-grounded retrieval and multi-hop answering are the largest modeled functional category, supported by agentic research and investigation use cases.
- 3Managed cloud services gain deployment share as enterprises seek lower-friction graph construction and controlled agent-access APIs.
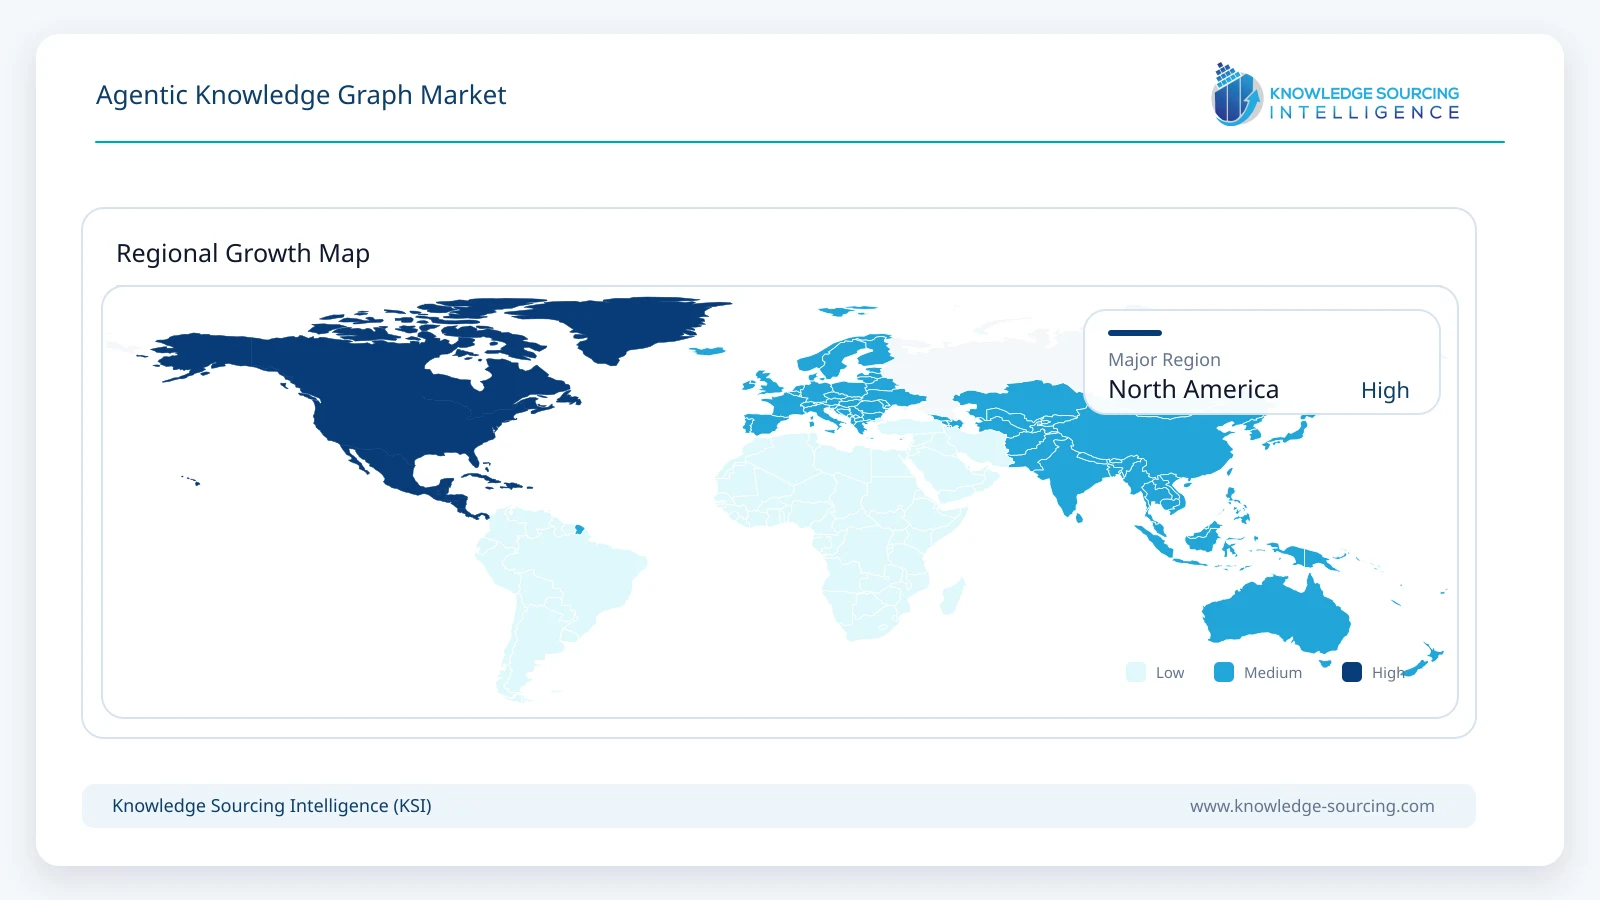
- 4North America leads initial spending, while Asia Pacific is expected to gain share through enterprise automation and graph-intensive operations.
- 5Source validation, ontology governance, incremental billing and access controls remain decisive for production adoption.
The market measures commercial software and managed services used to construct, govern and query connected knowledge specifically for AI-agent operations, rather than total spending on graph databases.
Enterprise AI agents increasingly need to discover how customer accounts, suppliers, policies, processes and recorded decisions relate across multiple systems. Neo4j Aura Agent, AWS graph-RAG services, Stardog Voicebox and Graphwise GraphRAG expose different approaches to building and accessing that connected context. Direct monetization includes hosted agent runtime, graph construction, premium ontology modules and integration services attributable to agent-facing use.
The report covers seven market dimensions: commercial offering, graph function, data architecture, deployment, data source, application and end-user industry. Regional analysis assesses North America and Asia Pacific in depth, with broader country coverage and a separate competitive assessment. The analysis examines how buyers choose agent-ready graph services alongside established databases, semantic platforms and enterprise AI applications.
Agent-based enterprise workflows require more than a list of documents relevant to a question; they need a reliable representation of the people, assets, transactions and procedures that influence an action. Knowledge graphs encode this relational structure, enabling agents to traverse links and explain which source records support a recommendation. This becomes commercially valuable in compliance, investigations, research and complex business-process automation where the answer depends on several connected facts.
Supplier product releases show a transition from manually assembled graph applications to reusable agent-facing services. Neo4j made Aura Agent generally available in February 2026 with hosted deployment and multi-hop graph retrieval, then introduced a broader Context Engine in October. Stardog expanded multi-step graph query reasoning through Voicebox, while Graphwise extended GraphRAG and Model Context Protocol tooling. These offerings move graph construction and access into defined software features rather than bespoke projects alone.
Enterprises increasingly evaluate graph-aware software as an extension to existing data platforms rather than as a complete replacement. Conventional graph storage, vector search, inference models and semantic services often remain part of the same technical stack, so agent-focused suppliers need to demonstrate the additional value of governed multi-hop decisions, automated graph construction and reusable ontologies. Transparent pricing and measurable quality improvements help distinguish premium software from bundled database functions.
Market Trends
Enterprise Ontologies Become Reusable Agent Context
Enterprise agent programs are moving toward shared domain vocabularies that describe business entities, policies and permissible actions. Neo4j Context Engine introduces a multi-layer business ontology intended to connect processes, physical systems and agent runtime knowledge, while Stardog and Graphwise support semantic graph approaches that link concepts to governed enterprise data.
Reusable ontologies help a customer-support agent and a risk-analysis agent interpret the same account or supplier consistently. Their commercial value depends on trustworthy updates, controlled access and the ability to reuse a knowledge layer across applications without counting the underlying graph database contract twice.
Document-to-Graph Automation Lowers Deployment Barriers
The automation of entity extraction and relationship assembly is reducing the amount of custom scripting needed to bring document-heavy enterprise knowledge into graphs. Neo4j introduced Document Intelligence within Aura in June 2026, while Graphwise announced visual graph automation workflows and expanded GraphRAG tooling for semantic search and agent integration.
Enterprises still need human validation of aliases, conflicting records and temporal relationships, especially where claims arise from unstructured reports or contracts. Commercial platforms can differentiate through provenance checks, entity resolution and incremental graph updates that avoid repeated full-corpus extraction.
Agentic GraphRAG Adds Planning and Multi-Hop Control
Agentic GraphRAG is expanding beyond fixed vector retrieval by allowing software agents to select graph paths, retrieve related records and perform further queries when evidence remains incomplete. Neo4j Aura Agent exposes graph-specific retrieval tools, AWS published a unified GraphRAG and LightRAG architecture in September 2026, and Stardog Voicebox supports multi-step questions against knowledge graphs.
The main tradeoff is additional processing, retrieval and graph governance cost. Buyers will favor systems that can demonstrate higher answer quality with clear citations, limited traversal depth and appropriate authorization checks, rather than repeatedly calling graph tools without measurable improvement.
Agentic Knowledge Graph Market Segment Analysis
By Commercial Offering
Agentic Graph Intelligence Platform Subscriptions
Enterprise buyers increasingly contract graph-agent platforms that combine ontology-aware access, governed traversal and reusable deployment tools. The segment is estimated at USD 107.00 million in 2026 and is projected to reach USD 754.00 million by 2031, with its share changing from 34.0% to 31.9%. They include attributable agent-enabled graph runtime, graph-specific access tooling and premium graph intelligence capabilities, not the full value of ordinary graph data storage. Neo4j Aura Agent illustrates a direct agent-facing monetization path, while semantic platform suppliers offer governed interfaces that can be allocated to agent use.
Platform buyers prioritize reusable graph-specific tools, auditability and access to hosted agent endpoints. Dedicated contracts are more compelling when vendors can allocate feature charges independently of base graph compute and storage.
By Graph Function
Agentic GraphRAG and Multi-Hop Retrieval
Agentic GraphRAG connects multiple entity and evidence paths so agents can answer complex questions that isolated document retrieval may miss. The segment is estimated at USD 94.50 million in 2026 and is projected to reach USD 755.20 million by 2031, with its share changing from 30.0% to 32.0%. It is driven by complex questions requiring paths between several records instead of simple semantic document matching. AWS, Neo4j and Graphwise provide relevant technology examples, but only separately attributable graph-related optimization or agent service fees are included.
Teams adopting multi-hop retrieval compare the correctness of linked evidence and the cost of each graph traversal. Controlled planning, query limits and explicit source paths can improve reliability without repeatedly searching the entire graph.
By Data Architecture
Property Graph
Property-graph architectures remain important for AI agents navigating transactions, identity networks and operational dependencies represented as linked entities. The segment is estimated at USD 138.60 million in 2026 and is projected to reach USD 1,132.80 million by 2031, with its share changing from 44.0% to 48.0%. Their node-edge representations fit transaction networks and operational entities used in agent decisions. RDF and ontology-first architectures remain commercially relevant for domain semantics, regulatory controls and knowledge integration requiring common definitions.
Architectural choices are influenced by existing data models, skills and semantic requirements. Organizations often combine property graphs with ontology and RDF capabilities when the same agent must navigate operational transactions and regulated domain definitions.
By Deployment Model
Managed Cloud and Metered APIs
Managed graph-cloud deployments and metered agent endpoints reduce infrastructure ownership while providing structured access to knowledge-graph intelligence. The segment is estimated at USD 151.20 million in 2026 and is projected to reach USD 1,274.40 million by 2031, with its share changing from 48.0% to 54.0%. Hosted graphs and managed agent access reduce deployment burden and make usage more closely observable. Hybrid and on-premises alternatives remain important for sensitive financial, industrial and government information.
Cloud adoption is balanced by data-residency requirements, contractual throughput commitments and the complexity of bringing legacy systems into a shared semantic layer. Hybrid implementations offer an intermediate path for sensitive enterprise deployments.
By Application
Agent Workflow and Decision Support
Operational agent workflows use graph-connected entity and policy context to support explainable decisions and validate permissible next actions. The segment is estimated at USD 59.85 million in 2026 and is projected to reach USD 590.00 million by 2031, with its share changing from 19.0% to 25.0%. Graph-native context helps agents identify dependencies, validate policies and select authorized next actions. Growth is expected in customer operations, supply-chain exception management and investigation workflows where action traceability has economic value.
Decision-support buyers want relationships that can be traced to their operational origin, not just plausible textual summaries. Graph intelligence can become a recurring budget when an agent repeatedly validates dependencies and business rules.
Market Drivers
Production Demand for Explainable Agent Decisions
Enterprise agents that act on customer, policy or operational records require connected evidence rather than isolated text matches. Graph-grounded systems can follow relationships and return supporting paths, allowing teams to audit why an agent recommended a payment hold, investigation or workflow action. Neo4j Context Engine and Stardog Voicebox reflect this shift toward meaning-aware and traceable decisions.
Automation of Enterprise Graph Construction
Organizations hold relationships across documents, contracts, data warehouses and application tables without an assembled knowledge graph. Automated entity extraction, graph enrichment and ontology-assisted ingestion reduce the manual work required to transform those sources into reusable agent context. Neo4j Document Intelligence and Graphwise automation illustrate how suppliers are lowering deployment friction.
Expansion of Multi-Hop Agentic Retrieval
Enterprise investigations and research often require linking several entities or events before an answer can be supported. Agentic GraphRAG combines graph traversal, semantic matching and adaptive query generation to address these requests. AWS graph-RAG architectures and Neo4j Aura Agent make multi-hop graph-grounded retrieval a practical platform capability.
Growing Need for Shared Semantic Governance
Multiple agents operating across customer, finance and operational workflows need consistent definitions of accounts, roles, suppliers and permissions. A governed graph can provide common business meaning and preserve relationship provenance while agents change. Stardog, Graphwise and Neo4j position ontologies, access controls and validated graph queries as core enterprise integration layers.
Managed Graph and Agent Service Monetization
Graph-native agent tools are increasingly exposed as chargeable cloud services rather than only consulting projects. Neo4j introduced per-agent-hour pricing for hosted Aura Agent workloads, while AWS offers Neptune graph capacity and supporting services for graph-grounded applications. These pricing models support recurring contracts for the incremental graph intelligence consumed by agents.
Market Restraints
Bundling with General Graph Database Infrastructure
Most enterprise graph platforms already charge for storage, compute and graph queries; a graph-connected agent may consume these without paying for a separate agentic feature. Counting the entire underlying platform contract would overstate the category, while bundled functions limit the price vendors can charge for incremental graph intelligence.
High Cost of Entity Resolution and Knowledge Maintenance
Extracted entities may contain aliases, duplicate organizations, conflicting dates and ambiguous relationships. Incorrect graph edges can make an agent confidently draw false conclusions even when the underlying language model follows its tools correctly. Enterprises must fund validation, temporal updates and quality monitoring before using graph-grounded automation in high-value workflows.
Data Permissions and Ontology Integration Complexity
Enterprise knowledge spans regulated records, departmental ownership boundaries and inconsistent business vocabularies. Merging these sources into one agent-accessible graph can create unauthorized inference pathways and difficult schema conflicts. Buyers frequently need private deployment, policy-aware traversal and access filtering, increasing implementation time.
Open-Source GraphRAG and Custom Integration Alternatives
Open-source tooling and conventional graph-query interfaces permit experienced teams to build agent integrations without a premium standalone subscription. AWS publishes graph-RAG toolkits, and Zep distributes the Graphiti framework openly. Specialist vendors must demonstrate better governance, maintenance efficiency or model quality to defend dedicated fees.
Unproven Economics for Broad Agent Deployments
Graph extraction, graph traversal, vector retrieval and model calls can all occur during one agent task. Latency and operating costs grow when agents repeat long traversals or reprocess changing source material. Production buyers need evidence that improved decision quality outweighs integration expense and incremental service charges.
Regional Outlook
North America
North America accounts for an estimated USD 132.30 million in 2026 and is projected to reach USD 873.20 million by 2031. The United States leads regional spending through established cloud graph infrastructure, software suppliers and early enterprise adoption of agent-backed operational intelligence. Financial services, technology providers and research-intensive users are important buyers of graph-grounded decision support.
Regional demand is supported by compliance-sensitive processes in which entity relationships, audit paths and policy access must be managed consistently across agents. Neo4j and AWS offer graph-oriented cloud capabilities, while independent ontology and graph engineering suppliers support private deployments. Budget owners increasingly require attribution of the agent-specific graph service rather than spending on the complete database environment.
Asia Pacific
Asia Pacific is estimated at USD 69.30 million in 2026 and USD 660.80 million by 2031, making it the fastest-growing region in the scenario. China, India, Japan, South Korea, Australia and Singapore are expected to contribute through enterprise AI deployments, industrial knowledge integration and financial risk applications that use related data across multiple repositories.
Demand is likely to favor managed graph services, adaptable semantic models and integration with local data platforms. Complex multilingual data, varying privacy requirements and uneven graph engineering capacity may slow adoption in some countries. Commercial opportunities increase as knowledge-graph construction is automated and enterprises adopt graph-grounded agents for repeatable operational decisions.
Competitive Landscape
The agentic knowledge graph ecosystem comprises graph platform vendors, semantic ontology specialists, hyperscalers and graph-memory developers. Neo4j, AWS, Stardog and Graphwise offer direct graph-to-agent capabilities, while TigerGraph, ArangoDB, Memgraph, Zep, Franz, Diffbot and Fluree participate through graph management, connected information and agent data services.
Competition is based on ontology consistency, entity resolution, integration breadth, retrieval quality, governance and commercial attribution. Providers able to combine graph reasoning with transparent billing and reusable tooling may obtain higher-value enterprise contracts, while basic graph storage remains competitive and widely bundled.
Recent Developments
October 2026: Neo4j introduced Context Engine in private preview, connecting domain ontology, governed GraphRAG, and agent memory around a shared enterprise knowledge layer.
September 2026: AWS published a unified GraphRAG and LightRAG architecture using Neptune, Bedrock and OpenSearch to support relationship-aware evidence retrieval.
August 2026: Stardog released Voicebox Service 1.0, supporting multi-step question planning and execution across enterprise knowledge graphs.
April-May 2026: Graphwise released GraphRAG 1.2.0 with stronger ontology enrichment, guardrails and graph-aware tool routing.
May 2026: Memgraph introduced Memgraph Zero and MemGQL, allowing graph queries over existing data without compulsory migration.
Market Outlook
Agentic knowledge-graph deployments are expected to expand as organizations use AI agents for decisions requiring connected, verified enterprise context. Rather than relying only on documents retrieved by similarity, production workflows will increasingly traverse relationships between policy, customer, supplier and operational records to support recommendations and authorized actions.
Commercial growth will be concentrated in managed graph-agent services, automated graph construction and governed semantic modules that solve measurable enterprise problems. Providers must distinguish these incremental services from ordinary graph databases, model inference and retrieval platforms, since bundled functionality and open-source alternatives can constrain prices.
The strongest long-term offerings will provide graph freshness, source lineage, tenant-aware permissions and predictable multi-hop query costs. North America remains the leading modeled region, while Asia Pacific gains share through broader operational automation and rising demand for connected enterprise intelligence.
Agentic Knowledge Graph Market Scope:
| Report Metric | Details |
|---|---|
| Total Market Size in 2026 | USD 315 million |
| Total Market Size in 2031 | USD 2,360 million |
| Forecast Unit | USD Million |
| Growth Rate | 49.60% |
| Study Period | 2021 to 2031 |
| Historical Data | 2021 to 2024 |
| Base Year | 2025 |
| Forecast Period | 2026 – 2031 |
| Segmentation | Commercial Offering, Primary Graph Function, Graph Data Architecture, Deployment Model, Primary Data Source, Primary Application, End-User Industry, Geography |
| Companies |
|
| Customization Scope | 15% Free Customization included with purchase — Request Custom Breakdown → |
| Sample & Data Access | PDF Sample, Excel Databook & Analyst Briefing — Download Free Sample → |
Market Segmentation
By Commercial Offering
Agentic Graph Intelligence Platform Subscriptions
Managed GraphRAG and Graph-Agent Services
Automated Graph Construction and Enrichment
Governed Ontology and Agent-Access Modules
By Primary Graph Function
Automated Graph Construction and Enrichment
Agentic GraphRAG and Multi-Hop Retrieval
Ontology Governance and Semantic Access
Temporal and Dynamic Graph Maintenance
Graph-Grounded Decision and Workflow Reasoning
By Graph Data Architecture
Property Graph
RDF and Ontology-First Semantic Graph
Hybrid and Multimodel Graph
By Deployment Model
Managed Cloud and Metered APIs
Hybrid and Private Managed Deployment
Self-Managed and On-Premises
By Primary Data Source
Enterprise Documents and Knowledge Assets
Transactional and Master Data Systems
Operational Events and Process Records
Scientific, Industrial and Research Datasets
Open Web and Cross-Source Information
By Primary Application
Enterprise Knowledge Assistants
Agent Workflow and Decision Support
Fraud, Compliance and Risk Intelligence
Customer Operations and Support
Scientific Discovery and Life Sciences
Supply-Chain and Other Operational Analytics
By End-User Industry
Technology, Cloud and Software
Banking, Financial Services and Insurance
Manufacturing, Logistics and Energy
Healthcare and Life Sciences
Government and Education
Retail and Professional Services
By Geography
North America
United States
Canada
Mexico
South America
Brazil
Argentina
Rest of South America
Europe
Germany
United Kingdom
France
Netherlands
Italy
Spain
Rest of Europe
Middle East and Africa
United Arab Emirates
Saudi Arabia
Israel
South Africa
Rest of Middle East and Africa
Asia Pacific
China
Japan
India
South Korea
Australia
Singapore
Rest of Asia Pacific
Table of Contents
1. EXECUTIVE SUMMARY
1.1. Research Highlights
1.2. Market Size and Growth Outlook, 2026–2031
1.3. Strategic Market Perspective
2. MARKET SNAPSHOT
2.1. Market Overview
2.2. Market Definition
2.3. Scope of the Study
2.4. Market Segmentation
3. BUSINESS LANDSCAPE
3.1. Market Drivers
3.1.1. Production Demand for Explainable Agent Decisions
3.1.2. Automation of Enterprise Graph Construction
3.1.3. Expansion of Multi-Hop Agentic Retrieval
3.1.4. Growing Need for Shared Semantic Governance
3.1.5. Managed Graph and Agent Service Monetization
3.2. Market Restraints
3.2.1. Bundling with General Graph Database Infrastructure
3.2.2. High Cost of Entity Resolution and Knowledge Maintenance
3.2.3. Data Permissions and Ontology Integration Complexity
3.2.4. Open-Source GraphRAG and Custom Integration Alternatives
3.2.5. Unproven Economics for Broad Agent Deployments
3.3. Market Opportunities
3.4. Porter’s Five Forces Analysis
3.5. Industry Value Chain Analysis
3.6. Policies and Regulations
3.7. Strategic Recommendations
4. TECHNOLOGICAL OUTLOOK
4.1. Ontology-Grounded Agent Planning and Querying
4.2. Document-to-Graph Construction and Identity Resolution
4.3. Hybrid GraphRAG and Multi-Hop Retrieval
4.4. Temporal Graphs, Governance and Memory Interfaces
4.5. Performance, Quality and Cost Controls
5. AGENTIC KNOWLEDGE GRAPH MARKET BY COMMERCIAL OFFERING
5.1. Introduction
5.2. Agentic graph intelligence platform subscriptions
5.3. Managed GraphRAG and graph-agent services
5.4. Automated graph construction and enrichment
5.5. Governed ontology and agent-access modules
6. AGENTIC KNOWLEDGE GRAPH MARKET BY PRIMARY GRAPH FUNCTION
6.1. Introduction
6.2. Automated graph construction and enrichment
6.3. Agentic GraphRAG and multi-hop retrieval
6.4. Ontology governance and semantic access
6.5. Temporal and dynamic graph maintenance
6.6. Graph-grounded decision and workflow reasoning
7. AGENTIC KNOWLEDGE GRAPH MARKET BY GRAPH DATA ARCHITECTURE
7.1. Introduction
7.2. Property graph
7.3. RDF and ontology-first semantic graph
7.4. Hybrid and multimodel graph
8. AGENTIC KNOWLEDGE GRAPH MARKET BY DEPLOYMENT MODEL
8.1. Introduction
8.2. Managed cloud and metered APIs
8.3. Hybrid and private managed deployment
8.4. Self-managed and on-premises
9. AGENTIC KNOWLEDGE GRAPH MARKET BY PRIMARY DATA SOURCE
9.1. Introduction
9.2. Enterprise documents and knowledge assets
9.3. Transactional and master data systems
9.4. Operational events and process records
9.5. Scientific, industrial and research datasets
9.6. Open web and cross-source information
10. AGENTIC KNOWLEDGE GRAPH MARKET BY PRIMARY APPLICATION
10.1. Introduction
10.2. Enterprise knowledge assistants
10.3. Agent workflow and decision support
10.4. Fraud, compliance and risk intelligence
10.5. Customer operations and support
10.6. Scientific discovery and life sciences
10.7. Supply-chain and other operational analytics
11. AGENTIC KNOWLEDGE GRAPH MARKET BY END-USER INDUSTRY
11.1. Introduction
11.2. Technology, cloud and software
11.3. Banking, financial services and insurance
11.4. Manufacturing, logistics and energy
11.5. Healthcare and life sciences
11.6. Government and education
11.7. Retail and professional services
12. AGENTIC KNOWLEDGE GRAPH MARKET BY GEOGRAPHY
12.1. North America
12.1.1. United States
12.1.2. Canada
12.1.3. Mexico
12.2. South America
12.2.1. Brazil
12.2.2. Argentina
12.2.3. Rest of South America
12.3. Europe
12.3.1. Germany
12.3.2. United Kingdom
12.3.3. France
12.3.4. Netherlands
12.3.5. Italy
12.3.6. Spain
12.3.7. Rest of Europe
12.4. Middle East and Africa
12.4.1. United Arab Emirates
12.4.2. Saudi Arabia
12.4.3. Israel
12.4.4. South Africa
12.4.5. Rest of Middle East and Africa
12.5. Asia Pacific
12.5.1. China
12.5.2. Japan
12.5.3. India
12.5.4. South Korea
12.5.5. Australia
12.5.6. Singapore
12.5.7. Rest of Asia Pacific
13. COMPETITIVE ENVIRONMENT AND ANALYSIS
13.1. Major Players and Strategy Analysis
13.2. Market Share Analysis
13.3. Mergers, Acquisitions, Agreements, and Collaborations
13.4. Competitive Dashboard
14. COMPANY PROFILES
14.1. Neo4j, Inc.
14.2. Amazon Web Services, Inc.
14.3. Stardog Union, Inc.
14.4. Graphwise (Ontotext AD)
14.5. TigerGraph, Inc.
14.6. ArangoDB GmbH
14.7. Memgraph Ltd.
14.8. Zep AI
14.9. Franz Inc.
14.10. Diffbot Technologies Corp.
14.11. Fluree PBC
15. APPENDIX
15.1. Currency
15.2. Assumptions
15.3. Base and Forecast Years Timeline
15.4. Key Benefits for Stakeholders
15.5. Research Methodology
15.6. Abbreviations




Frequently asked questions
What is the projected Agentic Knowledge Graph market size by 2031?
The Agentic Knowledge Graph Market is projected to reach USD 2,360 million by 2031.
What is the Compound Annual Growth Rate (CAGR) for this market?
The Agentic Knowledge Graph Market is projected to grow at a 49.60% CAGR.
Which region currently leads spending in the Agentic Knowledge Graph market?
North America leads initial spending; Asia Pacific will gain share.
What are the primary growth drivers for Agentic Knowledge Graphs?
AI agents needing connected context for complex workflows drives growth.
What is the largest modeled functional category for Agentic Knowledge Graphs?
Graph-grounded retrieval and multi-hop answering is the largest functional category.
Which key vendors are mentioned as offering Agentic Knowledge Graph solutions?
Neo4j, AWS, Stardog, and Graphwise are key solution providers.
Cite this report
Knowledge Sourcing Intelligence. (Oct 2026). Agentic Knowledge Graph Market Size, Share & Growth Forecast (2026-2031). https://www.knowledge-sourcing.com/report/agentic-knowledge-graph-market