Blog
Access strategic insights, industry indicators, and expert macro reports curated under Blog.

How America’s Aging Population is Reshaping Healthcare Demand
Population aging is transforming U.S. healthcare by increasing demand for chronic disease management, neurological care, home-based services, preventive healthcare, and precision medicine. Healthcare providers, insurers, pharmaceutical companies, and medical technology firms are adopting digital health, workforce innovation, and value-based care to improve outcomes while addressing rising healthcare costs and expanding senior populations.
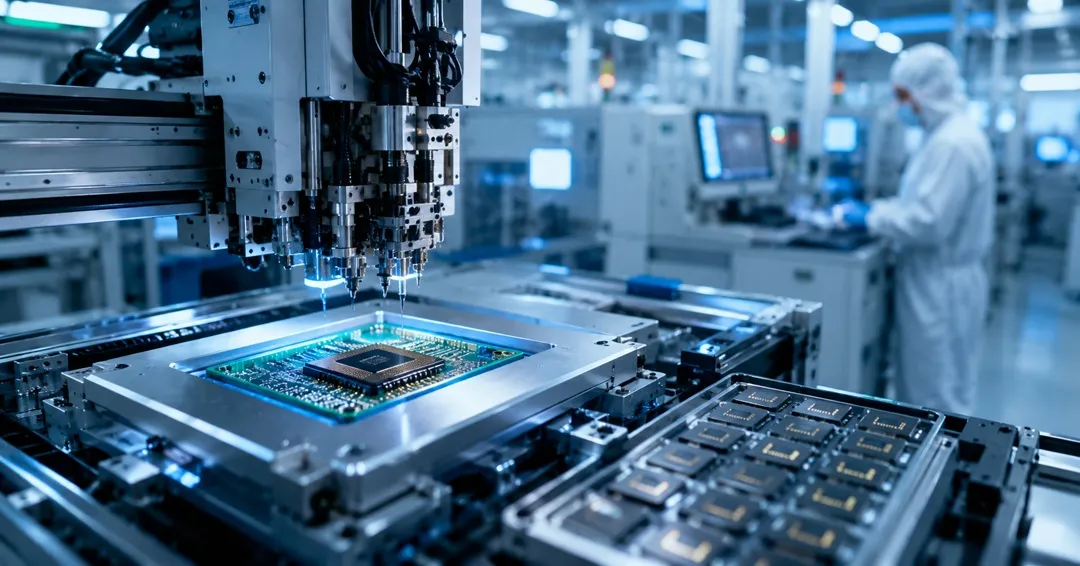
Which OSAT Companies Are Best Positioned for AI and HPC Chip Demand?
Outsourced Semiconductor Assembly and Test (OSAT) companies play a critical role in AI by enabling advanced chip packaging, testing, and integration. As AI accelerators, chiplets, and high-bandwidth memory drive semiconductor innovation, leading OSAT providers are becoming strategic partners, benefiting from growing demand, government investments, and next-generation packaging technologies.

Wearable Health Devices and Their Role in Modern Healthcare
The wearable health tracking market is evolving beyond consumer electronics into a clinically integrated healthcare ecosystem. Continuous bio-telemetry, AI-driven analytics, and regulatory support are enabling preventive care, decentralized clinical trials, and remote patient monitoring. As healthcare shifts toward value-based models, wearable technologies are becoming essential tools for personalized medicine.
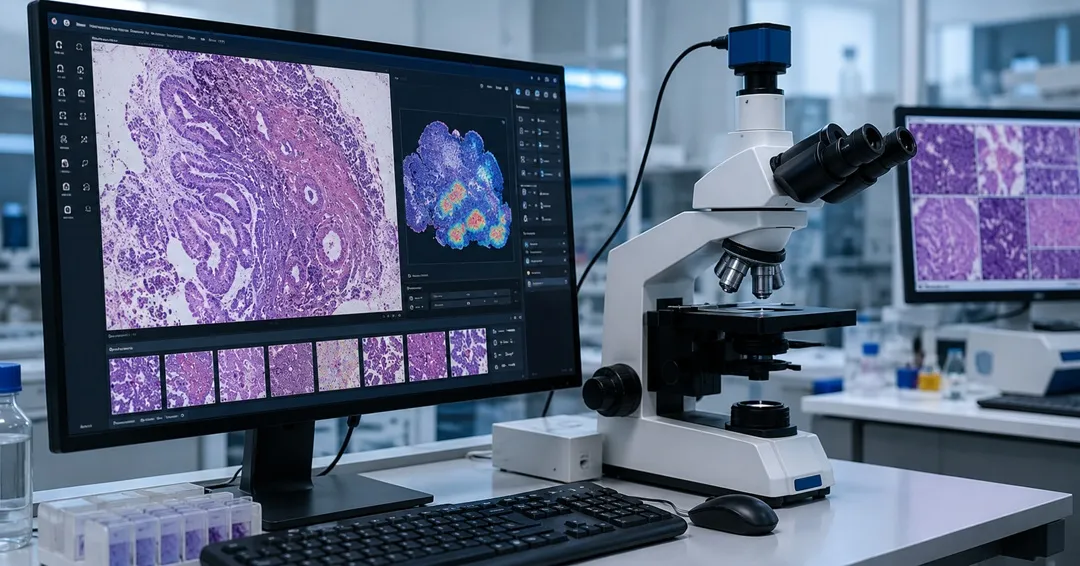
Beyond the Glass: The Decisive Transition to Computational Tissue Intelligence
Digital pathology and AI-assisted microscopy are transforming diagnostics by replacing manual microscope workflows with cloud-based, AI-driven tissue analysis. Growing disease burdens, workforce shortages, automation, and regulatory support are accelerating adoption. Advanced AI improves diagnostic accuracy, efficiency, and biomarker discovery, positioning computational pathology as a core pillar of future precision medicine.

Companion Diagnostics for Targeted Therapies Market: The U.S. Edge In Personalized Medicine
The companion diagnostics (CDx) market for targeted therapies is expanding as precision medicine, biomarker science, and molecular diagnostics reshape healthcare, particularly in the U.S. Strong investments, FDA support, AI integration, and genomic innovations are accelerating oncology advancements, while collaborations, liquid biopsy adoption, and evolving testing models strengthen future growth opportunities.
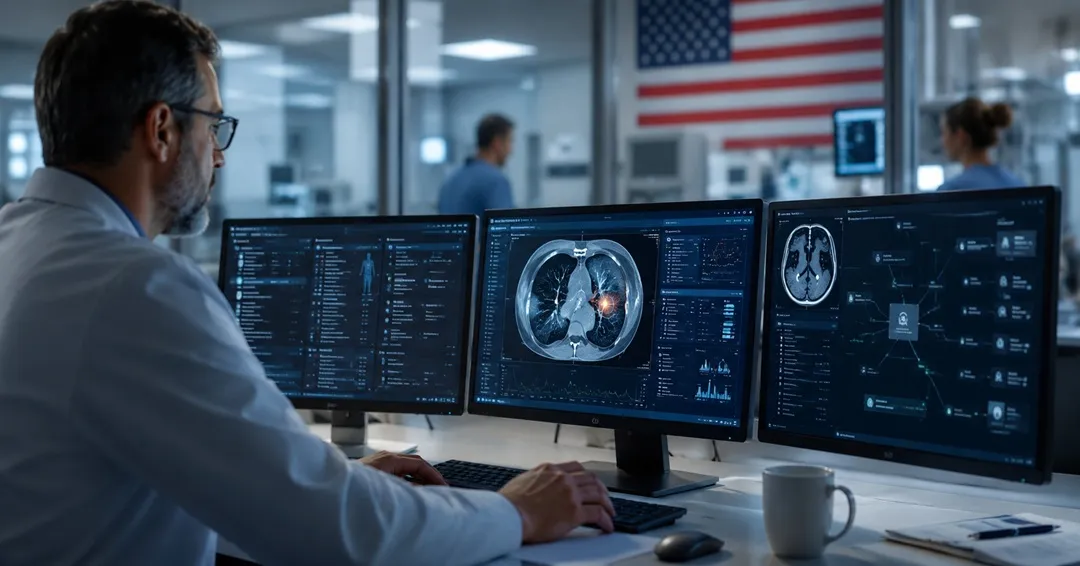
Clinical Decision Support Diagnostic Systems Market: Why the U.S. Healthcare System Is Quietly Rebuilding Diagnosis Around Algorithms
The U.S. clinical decision support diagnostic systems market is rapidly evolving as hospitals adopt AI-driven tools to manage rising diagnostic complexity, workforce shortages, and operational pressures. Growth is fueled by demand for faster, accurate diagnoses, workflow efficiency, interoperability, and value-based care, while physician trust, cybersecurity, and regulatory compliance increasingly determine long-term market success.

Top U.S. Healthcare Industry Trends to Watch in 2026 for the Global Healthcare Market
The global healthcare industry in 2026 is shifting toward AI-driven efficiency, stronger cybersecurity, outpatient care expansion, and domestic pharmaceutical manufacturing. U.S. healthcare leaders are prioritizing workforce support, operational resilience, value-based care, and integrated digital systems to improve patient outcomes while controlling costs.

How AI Is Reshaping the American Healthcare Industry
The U.S. healthcare industry is rapidly integrating artificial intelligence across clinical, administrative, and pharmaceutical operations. AI is improving diagnostics, automating workflows, reducing clinician burden, accelerating drug discovery, and enhancing personalized care. With strong adoption by hospitals and tech companies, AI is transforming healthcare delivery while driving the U.S. AI healthcare market toward significant growth by 2031.

Top Companies Leading the Silicon-Based Capacitor Revolution
Introduction: The Rise of Silicon-Based Capacitors: Electronic circuits use basic capacitors as storage devices to handle three essential tasks including filtering, decoupling, and signal coupling. High-performance silicon capacitors h...

The Role of Chemical Blowing Agents in Sustainable Foaming Solutions
The foam industry is growing at a significant rate, with an increasing trend towards sustainability leading to an increase in demand for lightweight, sustainable materials across industries. This sustainability in foaming solutions is driven by chemical blowing agents, which are specialized compound...

Top 10 Emerging Beverages Set to Dominate the Market in the Coming Years
Top 10 fastest-growing beverage types across the globe: Carbonated Drinks Juice Vegan Milk Fermented Cider Perry Beer Nut Wine Energy Drinks Sake Fruit Flavoured...

The Impact of Changing Consumer Preferences on the Coffee Pods Industry
The single-use coffee container, commonly referred to as the coffee pod, is synonymous with the tea bag and prepares just a single coffee. The major attraction of it is its one-time use and throw nature for customers, as it removes the additives and other flavors from their brewing process and thus...